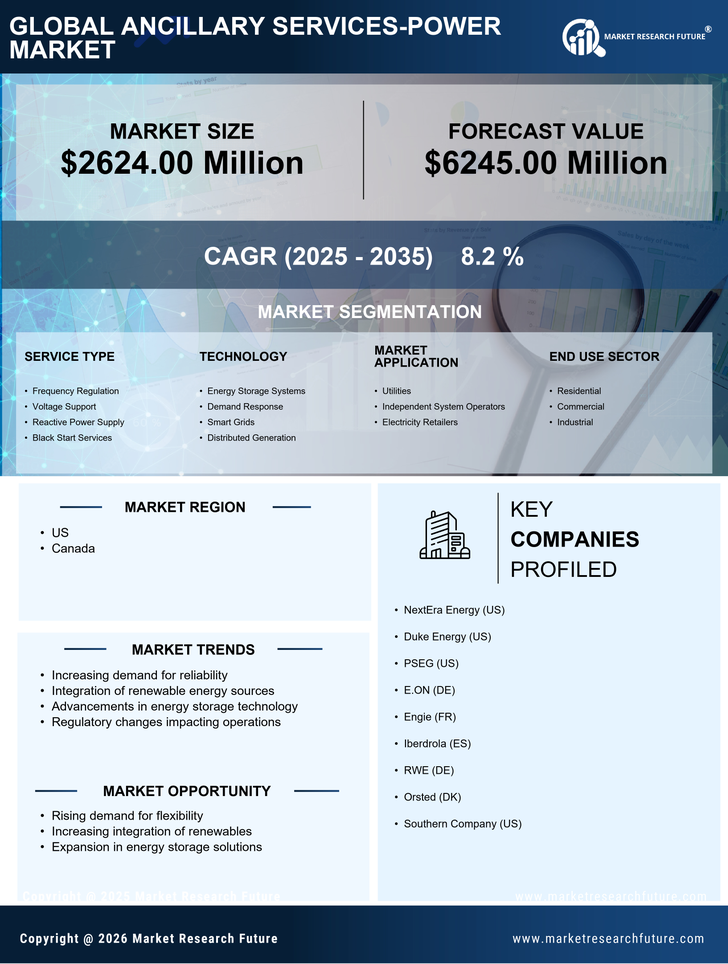
Request Free Sample ×

Kindly complete the form below to receive a free sample of this Report

* Please use a valid business email

Leading companies partner with us for data-driven Insights

clients tt-cursor
Hero Background

North America Ancillary Services Power Market

ID: MRFR/EnP/53489-HCR
200 Pages
Chitranshi Jaiswal
Last Updated: February 06, 2026
North America Ancillary Services Power Market Research Report By Service Type (Frequency Regulation, Voltage Support, Reactive Power Supply, Black Start Services), By Technology (Energy Storage Systems, Demand Response, Smart Grids, Distributed Generation), By Market Application (Utilities, Independent System Operators, Electricity Retailers), By End Use Sector (Residential, Commercial, Industrial) and By Regional (US, Canada)-Forecast to 2035
Download PDF ×

We do not share your information with anyone. However, we may send you emails based on your report interest from time to time. You may contact us at any time to opt-out.

  1. 1 SECTION I: EXECUTIVE SUMMARY AND KEY HIGHLIGHTS
    1. 1.1 EXECUTIVE SUMMARY
      1. 1.1.1 Market Overview
      2. 1.1.2 Key Findings
      3. 1.1.3 Market Segmentation
      4. 1.1.4 Competitive Landscape
      5. 1.1.5 Challenges and Opportunities
      6. 1.1.6 Future Outlook
  2. 2 SECTION II: SCOPING, METHODOLOGY AND MARKET STRUCTURE
    1. 2.1 MARKET INTRODUCTION
      1. 2.1.1 Definition
      2. 2.1.2 Scope of the study
        1. 2.1.2.1 Research Objective
        2. 2.1.2.2 Assumption
        3. 2.1.2.3 Limitations
    2. 2.2 RESEARCH METHODOLOGY
      1. 2.2.1 Overview
      2. 2.2.2 Data Mining
      3. 2.2.3 Secondary Research
      4. 2.2.4 Primary Research
        1. 2.2.4.1 Primary Interviews and Information Gathering Process
        2. 2.2.4.2 Breakdown of Primary Respondents
      5. 2.2.5 Forecasting Model
      6. 2.2.6 Market Size Estimation
        1. 2.2.6.1 Bottom-Up Approach
        2. 2.2.6.2 Top-Down Approach
      7. 2.2.7 Data Triangulation
      8. 2.2.8 Validation
  3. 3 SECTION III: QUALITATIVE ANALYSIS
    1. 3.1 MARKET DYNAMICS
      1. 3.1.1 Overview
      2. 3.1.2 Drivers
      3. 3.1.3 Restraints
      4. 3.1.4 Opportunities
    2. 3.2 MARKET FACTOR ANALYSIS
      1. 3.2.1 Value chain Analysis
      2. 3.2.2 Porter's Five Forces Analysis
        1. 3.2.2.1 Bargaining Power of Suppliers
        2. 3.2.2.2 Bargaining Power of Buyers
        3. 3.2.2.3 Threat of New Entrants
        4. 3.2.2.4 Threat of Substitutes
        5. 3.2.2.5 Intensity of Rivalry
      3. 3.2.3 COVID-19 Impact Analysis
        1. 3.2.3.1 Market Impact Analysis
        2. 3.2.3.2 Regional Impact
        3. 3.2.3.3 Opportunity and Threat Analysis
  4. 4 SECTION IV: QUANTITATIVE ANALYSIS
    1. 4.1 Energy & Power, BY Service Type (USD Billion)
      1. 4.1.1 Frequency Regulation
      2. 4.1.2 Voltage Support
      3. 4.1.3 Spinning Reserve
      4. 4.1.4 Non-Spinning Reserve
      5. 4.1.5 Black Start
    2. 4.2 Energy & Power, BY Market Participant (USD Billion)
      1. 4.2.1 Independent System Operator
      2. 4.2.2 Utility Provider
      3. 4.2.3 Energy Storage Provider
      4. 4.2.4 Demand Response Provider
      5. 4.2.5 Generator
    3. 4.3 Energy & Power, BY Technology Type (USD Billion)
      1. 4.3.1 Battery Energy Storage System
      2. 4.3.2 Flywheel Energy Storage
      3. 4.3.3 Pumped Hydro Storage
      4. 4.3.4 Thermal Energy Storage
      5. 4.3.5 Supercapacitor
  5. 5 SECTION V: COMPETITIVE ANALYSIS
    1. 5.1 Competitive Landscape
      1. 5.1.1 Overview
      2. 5.1.2 Competitive Analysis
      3. 5.1.3 Market share Analysis
      4. 5.1.4 Major Growth Strategy in the Energy & Power
      5. 5.1.5 Competitive Benchmarking
      6. 5.1.6 Leading Players in Terms of Number of Developments in the Energy & Power
      7. 5.1.7 Key developments and growth strategies
        1. 5.1.7.1 New Product Launch/Service Deployment
        2. 5.1.7.2 Merger & Acquisitions
        3. 5.1.7.3 Joint Ventures
      8. 5.1.8 Major Players Financial Matrix
        1. 5.1.8.1 Sales and Operating Income
        2. 5.1.8.2 Major Players R&D Expenditure. 2023
    2. 5.2 Company Profiles
      1. 5.2.1 PJM Interconnection (US)
        1. 5.2.1.1 Financial Overview
        2. 5.2.1.2 Products Offered
        3. 5.2.1.3 Key Developments
        4. 5.2.1.4 SWOT Analysis
        5. 5.2.1.5 Key Strategies
      2. 5.2.2 California Independent System Operator (US)
        1. 5.2.2.1 Financial Overview
        2. 5.2.2.2 Products Offered
        3. 5.2.2.3 Key Developments
        4. 5.2.2.4 SWOT Analysis
        5. 5.2.2.5 Key Strategies
      3. 5.2.3 New York Independent System Operator (US)
        1. 5.2.3.1 Financial Overview
        2. 5.2.3.2 Products Offered
        3. 5.2.3.3 Key Developments
        4. 5.2.3.4 SWOT Analysis
        5. 5.2.3.5 Key Strategies
      4. 5.2.4 Electric Reliability Council of Texas (US)
        1. 5.2.4.1 Financial Overview
        2. 5.2.4.2 Products Offered
        3. 5.2.4.3 Key Developments
        4. 5.2.4.4 SWOT Analysis
        5. 5.2.4.5 Key Strategies
      5. 5.2.5 ISO New England (US)
        1. 5.2.5.1 Financial Overview
        2. 5.2.5.2 Products Offered
        3. 5.2.5.3 Key Developments
        4. 5.2.5.4 SWOT Analysis
        5. 5.2.5.5 Key Strategies
      6. 5.2.6 Ontario Independent Electricity System Operator (CA)
        1. 5.2.6.1 Financial Overview
        2. 5.2.6.2 Products Offered
        3. 5.2.6.3 Key Developments
        4. 5.2.6.4 SWOT Analysis
        5. 5.2.6.5 Key Strategies
      7. 5.2.7 Duke Energy (US)
        1. 5.2.7.1 Financial Overview
        2. 5.2.7.2 Products Offered
        3. 5.2.7.3 Key Developments
        4. 5.2.7.4 SWOT Analysis
        5. 5.2.7.5 Key Strategies
      8. 5.2.8 NextEra Energy (US)
        1. 5.2.8.1 Financial Overview
        2. 5.2.8.2 Products Offered
        3. 5.2.8.3 Key Developments
        4. 5.2.8.4 SWOT Analysis
        5. 5.2.8.5 Key Strategies
      9. 5.2.9 Xcel Energy (US)
        1. 5.2.9.1 Financial Overview
        2. 5.2.9.2 Products Offered
        3. 5.2.9.3 Key Developments
        4. 5.2.9.4 SWOT Analysis
        5. 5.2.9.5 Key Strategies
      10. 5.2.10 PSEG (US)
        1. 5.2.10.1 Financial Overview
        2. 5.2.10.2 Products Offered
        3. 5.2.10.3 Key Developments
        4. 5.2.10.4 SWOT Analysis
        5. 5.2.10.5 Key Strategies
    3. 5.3 Appendix
      1. 5.3.1 References
      2. 5.3.2 Related Reports
  6. 6 LIST OF FIGURES
    1. 6.1 MARKET SYNOPSIS
    2. 6.2 NORTH AMERICA MARKET ANALYSIS BY SERVICE TYPE
    3. 6.3 NORTH AMERICA MARKET ANALYSIS BY MARKET PARTICIPANT
    4. 6.4 NORTH AMERICA MARKET ANALYSIS BY TECHNOLOGY TYPE
    5. 6.5 KEY BUYING CRITERIA OF ENERGY & POWER
    6. 6.6 RESEARCH PROCESS OF MRFR
    7. 6.7 DRO ANALYSIS OF ENERGY & POWER
    8. 6.8 DRIVERS IMPACT ANALYSIS: ENERGY & POWER
    9. 6.9 RESTRAINTS IMPACT ANALYSIS: ENERGY & POWER
    10. 6.10 SUPPLY / VALUE CHAIN: ENERGY & POWER
    11. 6.11 ENERGY & POWER, BY SERVICE TYPE, 2024 (% SHARE)
    12. 6.12 ENERGY & POWER, BY SERVICE TYPE, 2024 TO 2035 (USD Billion)
    13. 6.13 ENERGY & POWER, BY MARKET PARTICIPANT, 2024 (% SHARE)
    14. 6.14 ENERGY & POWER, BY MARKET PARTICIPANT, 2024 TO 2035 (USD Billion)
    15. 6.15 ENERGY & POWER, BY TECHNOLOGY TYPE, 2024 (% SHARE)
    16. 6.16 ENERGY & POWER, BY TECHNOLOGY TYPE, 2024 TO 2035 (USD Billion)
    17. 6.17 BENCHMARKING OF MAJOR COMPETITORS
  7. 7 LIST OF TABLES
    1. 7.1 LIST OF ASSUMPTIONS
  8. 7.1.1
    1. 7.2 North America MARKET SIZE ESTIMATES; FORECAST
      1. 7.2.1 BY SERVICE TYPE, 2026-2035 (USD Billion)
      2. 7.2.2 BY MARKET PARTICIPANT, 2026-2035 (USD Billion)
      3. 7.2.3 BY TECHNOLOGY TYPE, 2026-2035 (USD Billion)
    2. 7.3 PRODUCT LAUNCH/PRODUCT DEVELOPMENT/APPROVAL
  9. 7.3.1
    1. 7.4 ACQUISITION/PARTNERSHIP
  10. 7.4.1

North America Energy & Power Market Segmentation

Energy & Power By Service Type (USD Billion, 2022-2035)

  • Frequency Regulation
  • Voltage Support
  • Spinning Reserve
  • Non-Spinning Reserve
  • Black Start

Energy & Power By Market Participant (USD Billion, 2022-2035)

  • Independent System Operator
  • Utility Provider
  • Energy Storage Provider
  • Demand Response Provider
  • Generator

Energy & Power By Technology Type (USD Billion, 2022-2035)

  • Battery Energy Storage System
  • Flywheel Energy Storage
  • Pumped Hydro Storage
  • Thermal Energy Storage
  • Supercapacitor