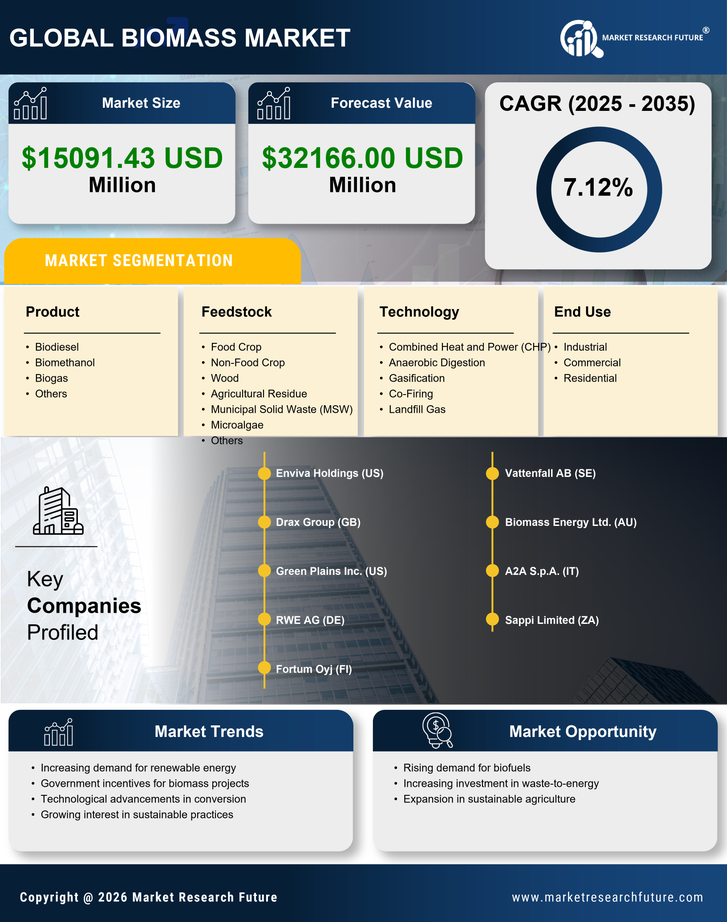
Hero Background

North America Biomass Market

ID: MRFR/CnM/46770-HCR
111 Pages
Chitranshi Jaiswal
Last Updated: April 06, 2026
North America Biomass Market Research Report By Feedstock (Food Crop, Non-Food Crop, Wood, Agricultural Residue, Municipal Solid Waste (MSW), Microalgae, Others), By Technology (Combined Heat and Power (CHP), Anaerobic Digestion and Feedstockification, Co-Firing, Landfill Feedstock), By Product (Biodiesel, Biomethanol, BioFeedstock, Others), By End Use (Industrial, Commercial, Residential) and By Regional (US, Canada) - Forecast to 2035.
Download PDF ×

We do not share your information with anyone. However, we may send you emails based on your report interest from time to time. You may contact us at any time to opt-out.

  1. 1 SECTION I: EXECUTIVE SUMMARY AND KEY HIGHLIGHTS
    1. 1.1 EXECUTIVE SUMMARY
      1. 1.1.1 Market Overview
      2. 1.1.2 Key Findings
      3. 1.1.3 Market Segmentation
      4. 1.1.4 Competitive Landscape
      5. 1.1.5 Challenges and Opportunities
      6. 1.1.6 Future Outlook
  2. 2 SECTION II: SCOPING, METHODOLOGY AND MARKET STRUCTURE
    1. 2.1 MARKET INTRODUCTION
      1. 2.1.1 Definition
      2. 2.1.2 Scope of the study
        1. 2.1.2.1 Research Objective
        2. 2.1.2.2 Assumption
        3. 2.1.2.3 Limitations
    2. 2.2 RESEARCH METHODOLOGY
      1. 2.2.1 Overview
      2. 2.2.2 Data Mining
      3. 2.2.3 Secondary Research
      4. 2.2.4 Primary Research
        1. 2.2.4.1 Primary Interviews and Information Gathering Process
        2. 2.2.4.2 Breakdown of Primary Respondents
      5. 2.2.5 Forecasting Model
      6. 2.2.6 Market Size Estimation
        1. 2.2.6.1 Bottom-Up Approach
        2. 2.2.6.2 Top-Down Approach
      7. 2.2.7 Data Triangulation
      8. 2.2.8 Validation
  3. 3 SECTION III: QUALITATIVE ANALYSIS
    1. 3.1 MARKET DYNAMICS
      1. 3.1.1 Overview
      2. 3.1.2 Drivers
      3. 3.1.3 Restraints
      4. 3.1.4 Opportunities
    2. 3.2 MARKET FACTOR ANALYSIS
      1. 3.2.1 Value chain Analysis
      2. 3.2.2 Porter's Five Forces Analysis
        1. 3.2.2.1 Bargaining Power of Suppliers
        2. 3.2.2.2 Bargaining Power of Buyers
        3. 3.2.2.3 Threat of New Entrants
        4. 3.2.2.4 Threat of Substitutes
        5. 3.2.2.5 Intensity of Rivalry
      3. 3.2.3 COVID-19 Impact Analysis
        1. 3.2.3.1 Market Impact Analysis
        2. 3.2.3.2 Regional Impact
        3. 3.2.3.3 Opportunity and Threat Analysis
  4. 4 SECTION IV: QUANTITATIVE ANALYSIS
    1. 4.1 Food, Beverages & Nutrition, BY Feedstock (USD Million)
      1. 4.1.1 Food Crop
      2. 4.1.2 Non-Food Crop
      3. 4.1.3 Wood
      4. 4.1.4 Agricultural Residue
      5. 4.1.5 Municipal Solid Waste (MSW)
      6. 4.1.6 Microalgae
      7. 4.1.7 Others
    2. 4.2 Food, Beverages & Nutrition, BY Technology (USD Million)
      1. 4.2.1 Combined Heat and Power (CHP)
      2. 4.2.2 Anaerobic Digestion
      3. 4.2.3 Gasification
      4. 4.2.4 Co-Firing
      5. 4.2.5 Landfill Gas
    3. 4.3 Food, Beverages & Nutrition, BY Product (USD Million)
      1. 4.3.1 Biodiesel
      2. 4.3.2 Biomethanol
      3. 4.3.3 Biogas
      4. 4.3.4 Others
    4. 4.4 Food, Beverages & Nutrition, BY End Use (USD Million)
      1. 4.4.1 Industrial
      2. 4.4.2 Commercial
      3. 4.4.3 Residential
  5. 5 SECTION V: COMPETITIVE ANALYSIS
    1. 5.1 Competitive Landscape
      1. 5.1.1 Overview
      2. 5.1.2 Competitive Analysis
      3. 5.1.3 Market share Analysis
      4. 5.1.4 Major Growth Strategy in the Food, Beverages & Nutrition
      5. 5.1.5 Competitive Benchmarking
      6. 5.1.6 Leading Players in Terms of Number of Developments in the Food, Beverages & Nutrition
      7. 5.1.7 Key developments and growth strategies
        1. 5.1.7.1 New Product Launch/Service Deployment
        2. 5.1.7.2 Merger & Acquisitions
        3. 5.1.7.3 Joint Ventures
      8. 5.1.8 Major Players Financial Matrix
        1. 5.1.8.1 Sales and Operating Income
        2. 5.1.8.2 Major Players R&D Expenditure. 2023
    2. 5.2 Company Profiles
      1. 5.2.1 Enviva Holdings (US)
        1. 5.2.1.1 Financial Overview
        2. 5.2.1.2 Products Offered
        3. 5.2.1.3 Key Developments
        4. 5.2.1.4 SWOT Analysis
        5. 5.2.1.5 Key Strategies
      2. 5.2.2 Drax Group (GB)
        1. 5.2.2.1 Financial Overview
        2. 5.2.2.2 Products Offered
        3. 5.2.2.3 Key Developments
        4. 5.2.2.4 SWOT Analysis
        5. 5.2.2.5 Key Strategies
      3. 5.2.3 Green Plains Inc. (US)
        1. 5.2.3.1 Financial Overview
        2. 5.2.3.2 Products Offered
        3. 5.2.3.3 Key Developments
        4. 5.2.3.4 SWOT Analysis
        5. 5.2.3.5 Key Strategies
      4. 5.2.4 RWE AG (DE)
        1. 5.2.4.1 Financial Overview
        2. 5.2.4.2 Products Offered
        3. 5.2.4.3 Key Developments
        4. 5.2.4.4 SWOT Analysis
        5. 5.2.4.5 Key Strategies
      5. 5.2.5 Fortum Oyj (FI)
        1. 5.2.5.1 Financial Overview
        2. 5.2.5.2 Products Offered
        3. 5.2.5.3 Key Developments
        4. 5.2.5.4 SWOT Analysis
        5. 5.2.5.5 Key Strategies
      6. 5.2.6 Vattenfall AB (SE)
        1. 5.2.6.1 Financial Overview
        2. 5.2.6.2 Products Offered
        3. 5.2.6.3 Key Developments
        4. 5.2.6.4 SWOT Analysis
        5. 5.2.6.5 Key Strategies
      7. 5.2.7 Biomass Energy Ltd. (AU)
        1. 5.2.7.1 Financial Overview
        2. 5.2.7.2 Products Offered
        3. 5.2.7.3 Key Developments
        4. 5.2.7.4 SWOT Analysis
        5. 5.2.7.5 Key Strategies
      8. 5.2.8 A2A S.p.A. (IT)
        1. 5.2.8.1 Financial Overview
        2. 5.2.8.2 Products Offered
        3. 5.2.8.3 Key Developments
        4. 5.2.8.4 SWOT Analysis
        5. 5.2.8.5 Key Strategies
      9. 5.2.9 Sappi Limited (ZA)
        1. 5.2.9.1 Financial Overview
        2. 5.2.9.2 Products Offered
        3. 5.2.9.3 Key Developments
        4. 5.2.9.4 SWOT Analysis
        5. 5.2.9.5 Key Strategies
    3. 5.3 Appendix
      1. 5.3.1 References
      2. 5.3.2 Related Reports
  6. 6 LIST OF FIGURES
    1. 6.1 MARKET SYNOPSIS
    2. 6.2 NORTH AMERICA MARKET ANALYSIS BY FEEDSTOCK
    3. 6.3 NORTH AMERICA MARKET ANALYSIS BY TECHNOLOGY
    4. 6.4 NORTH AMERICA MARKET ANALYSIS BY PRODUCT
    5. 6.5 NORTH AMERICA MARKET ANALYSIS BY END USE
    6. 6.6 KEY BUYING CRITERIA OF FOOD, BEVERAGES & NUTRITION
    7. 6.7 RESEARCH PROCESS OF MRFR
    8. 6.8 DRO ANALYSIS OF FOOD, BEVERAGES & NUTRITION
    9. 6.9 DRIVERS IMPACT ANALYSIS: FOOD, BEVERAGES & NUTRITION
    10. 6.10 RESTRAINTS IMPACT ANALYSIS: FOOD, BEVERAGES & NUTRITION
    11. 6.11 SUPPLY / VALUE CHAIN: FOOD, BEVERAGES & NUTRITION
    12. 6.12 FOOD, BEVERAGES & NUTRITION, BY FEEDSTOCK, 2024 (% SHARE)
    13. 6.13 FOOD, BEVERAGES & NUTRITION, BY FEEDSTOCK, 2024 TO 2035 (USD Million)
    14. 6.14 FOOD, BEVERAGES & NUTRITION, BY TECHNOLOGY, 2024 (% SHARE)
    15. 6.15 FOOD, BEVERAGES & NUTRITION, BY TECHNOLOGY, 2024 TO 2035 (USD Million)
    16. 6.16 FOOD, BEVERAGES & NUTRITION, BY PRODUCT, 2024 (% SHARE)
    17. 6.17 FOOD, BEVERAGES & NUTRITION, BY PRODUCT, 2024 TO 2035 (USD Million)
    18. 6.18 FOOD, BEVERAGES & NUTRITION, BY END USE, 2024 (% SHARE)
    19. 6.19 FOOD, BEVERAGES & NUTRITION, BY END USE, 2024 TO 2035 (USD Million)
    20. 6.20 BENCHMARKING OF MAJOR COMPETITORS
  7. 7 LIST OF TABLES
    1. 7.1 LIST OF ASSUMPTIONS
  8. 7.1.1
    1. 7.2 North America MARKET SIZE ESTIMATES; FORECAST
      1. 7.2.1 BY FEEDSTOCK, 2025-2035 (USD Million)
      2. 7.2.2 BY TECHNOLOGY, 2025-2035 (USD Million)
      3. 7.2.3 BY PRODUCT, 2025-2035 (USD Million)
      4. 7.2.4 BY END USE, 2025-2035 (USD Million)
    2. 7.3 PRODUCT LAUNCH/PRODUCT DEVELOPMENT/APPROVAL
  9. 7.3.1
    1. 7.4 ACQUISITION/PARTNERSHIP
  10. 7.4.1

North America Food, Beverages & Nutrition Market Segmentation

Food, Beverages & Nutrition By Feedstock (USD Million, 2025-2035)

  • Food Crop
  • Non-Food Crop
  • Wood
  • Agricultural Residue
  • Municipal Solid Waste (MSW)
  • Microalgae
  • Others

Food, Beverages & Nutrition By Technology (USD Million, 2025-2035)

  • Combined Heat and Power (CHP)
  • Anaerobic Digestion
  • Gasification
  • Co-Firing
  • Landfill Gas

Food, Beverages & Nutrition By Product (USD Million, 2025-2035)

  • Biodiesel
  • Biomethanol
  • Biogas
  • Others

Food, Beverages & Nutrition By End Use (USD Million, 2025-2035)

  • Industrial
  • Commercial
  • Residential