Segmentation Quick Reference
| Dimension | Sub-Segments | Dominant Segment | Fastest Growing Segment |
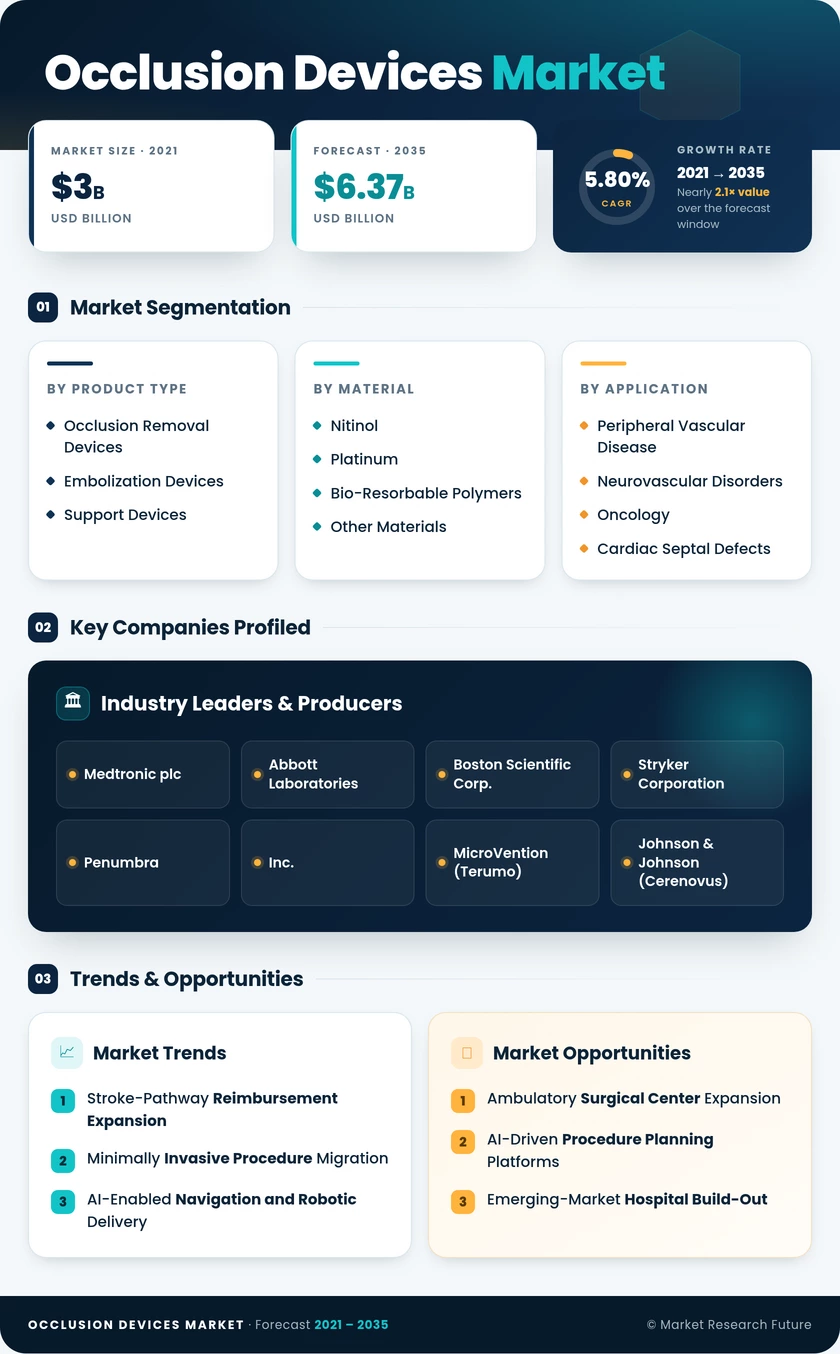
| Product Type | Occlusion Removal Devices, Embolization Devices, Support Devices | Occlusion Removal Devices | Embolization Devices |
| Material | Nitinol, Platinum, Bio-Resorbable Polymers, Other Occlusion Devices Market | Nitinol | Bio-Resorbable Polymers |
| Application | Peripheral Vascular Disease, Neurovascular Disorders, Oncology, Cardiac Septal Defects | Peripheral Vascular Disease | Oncology |
| Disease Pathology | Ischemic Stroke, Aneurysm, Tumor Embolization, Arteriovenous Malformation | Ischemic Stroke | Tumor Embolization |
| End User | Hospitals, Ambulatory Surgical Centers, Specialty Clinics | Hospitals | Ambulatory Surgical Centers |
| Geography | North America, Europe, Asia-Pacific, South America, Middle East & Africa | North America | Asia-Pacific |
Market Segmentation Overview
By Product Type
| Sub-Segment | Key Trend |
| Occlusion Removal Devices | Expanded thrombectomy time windows are driving higher procedural volumes per center |
| Embolization Devices | Hybrid coil-stent platforms broadening treatable aneurysm morphologies |
| Support Devices | Integrated guiding catheters and access sheaths enabling single-operator workflows |
The product landscape centers on retrieval and embolization platforms. Occlusion removal devices benefit from clinical-guideline momentum that has extended treatment eligibility to 24 hours post-symptom onset, while embolization devices are gaining share as flow-diverter evidence matures.
By Material
| Sub-Segment | Key Trend |
| Nitinol | Shape-memory and superelastic properties remain the industry standard for self-expanding devices |
| Platinum | High radiopacity is critical for micro-coil visualization under fluoroscopy |
| Bio-Resorbable Polymers | Eliminates chronic imaging artifacts; strong fit for pediatric and repeat-intervention cases |
| Other Occlusion Devices Market | Cobalt-chromium and stainless-steel alloys are used in specialty access and support devices |
Material innovation is a primary axis of differentiation. Nitinol continues to lead on mechanical performance, while bioresorbable polymers address a growing clinical preference for implants that dissolve after vessel remodeling is complete.
By Application
| Sub-Segment | Key Trend |
| Peripheral Vascular Disease | Aging demographics and diabetes prevalence sustain high procedure volumes globally |
| Neurovascular Disorders | National stroke-center designation programs accelerate device procurement |
| Oncology | TACE and radioembolization are gaining first-line guideline endorsements |
| Cardiac Septal Defects | PFO and ASD closure expanding with long-term clinical evidence maturity |
Application diversity is broadening the revenue base. Peripheral vascular disease remains the volume anchor, but oncology embolization is emerging as the fastest-growing application as trans-arterial chemoembolization enters mainstream treatment protocols.
By Disease Pathology
| Sub-Segment | Key Trend |
| Ischemic Stroke | Mechanical thrombectomy adoption is accelerating across comprehensive stroke centers |
| Aneurysm | Flow-diverter devices reduce retreatment rates versus traditional coiling |
| Tumor Embolization | Liver-cancer incidence trends and drug-eluting microsphere innovation driving growth |
| Arteriovenous Malformation | Multidisciplinary protocols combining embolization with radiosurgery |
Ischemic stroke dominates the pathology dimension, reflecting the sheer scale of the global stroke burden—approximately 12.2 million new cases annually according to the WHO.
By End User
| Sub-Segment | Key Trend |
| Hospitals | Comprehensive stroke and trauma designation requirements mandate advanced occlusion inventories |
| Ambulatory Surgical Centers | Site-neutral payment reforms equalizing reimbursement with hospital outpatient departments |
| Specialty Clinics | Vascular-access and dialysis-oriented clinics are driving targeted device demand |
Hospitals retain the majority of purchasing volume, but ambulatory surgical centers are absorbing a growing share of peripheral and dialysis-access occlusion procedures as payment parity and single-use packaging simplify outpatient workflows.