Optical Sorter Market Summary
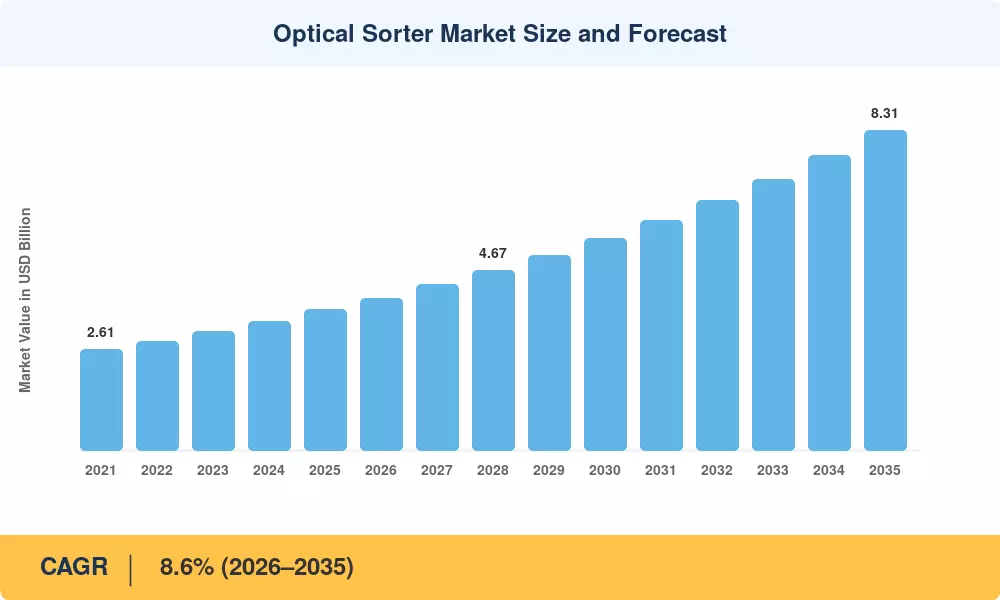
The Optical Sorter Market reached USD 3.65 billion in 2025 and is projected to climb from USD 3.96 billion in 2026 to USD 8.31 billion by 2035, expanding at an 8.6% CAGR during the forecast window. Two catalysts anchor this trajectory: tightening food safety mandates under the FDA's New Era of Smarter Food Safety Blueprint [2] and Extended Producer Responsibility (EPR) frameworks rolling across EU member states and Southeast Asia that demand higher purity grades for recycled plastics and metals [3]. Capital expenditure incentives in India's Production Linked Incentive (PLI) scheme and the U.S. Inflation Reduction Act have further accelerated procurement cycles for automated optical classification equipment.
A technology shift is reshaping the Optical Sorter Market landscape. Legacy single-spectrum camera systems are giving way to AI-enhanced hyperspectral and near-infrared sorting machines capable of detecting sub-millimeter contaminants invisible to conventional sensors. BloombergNEF estimates that machine vision sorting systems attracted over USD 1.2 billion in venture and strategic funding between 2022 and 2024, with deep-learning defect recognition modules now embedded in roughly 38% of new belt-line installations [4]. Color-based optical sorting platforms have also benefited, as food grain optical sorters in South Asia and sub-Saharan Africa now process throughputs 40% higher than mechanical predecessors.
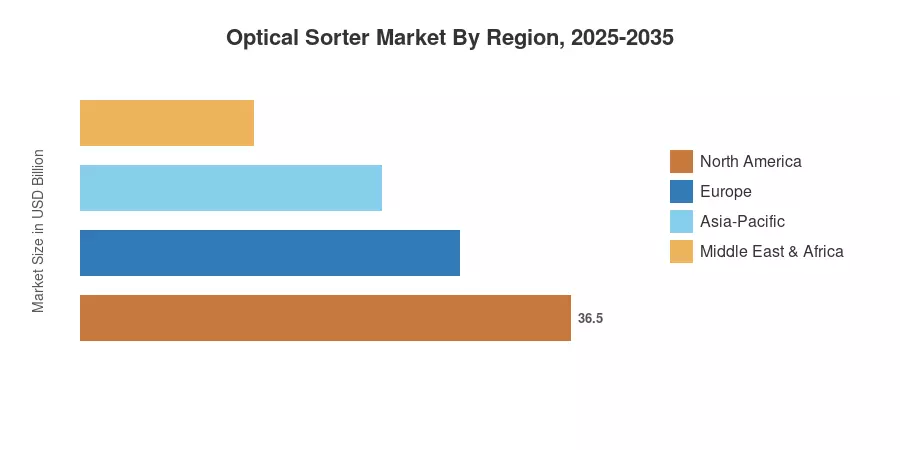
North America commanded a 36.2% revenue share of the Optical Sorter Market in 2025, driven by USDA and EPA compliance spending. Asia-Pacific is the fastest-growing region at an 11.2% CAGR, propelled by rising automation in China's recycling sector and India's grain processing modernization. Europe holds the second-largest share at roughly 27%, underpinned by circular-economy legislation and deposit-return schemes. As sustainability regulations tighten globally, procurement of high-throughput machine vision sorting systems is set to accelerate across every major end-use vertical through 2035.
Key Report Takeaways
• By Technology
- Camera-based systems captured 36.5% of the Optical Sorter Market share in 2025, reflecting widespread adoption of color-based optical sorting across food and recycling lines
- Near-infrared sorting machines are projected to register a 10.4% CAGR through 2035, the fastest among all technology segments, as hyperspectral capabilities expand into mining and textile recovery
• By Platform
- Belt-based configurations accounted for 58.2% of the Optical Sorter Market in 2025, favored for their scalability in high-volume food grain optical sorters and municipal recycling facilities
• By End-User Industry
- Belt-based configurations accounted for 58.2% of the Optical Sorter Market in 2025, favored for their scalability in high-volume food grain optical sorters and municipal recycling facilities
- Food processing held a 62.0% revenue share in 2025; the recycling end-user segment is forecast to grow at an 11.2% CAGR, driven by EPR mandates requiring automated optical classification of post-consumer waste streams
• By Region
- North America led the Optical Sorter Market with 36.2% of global revenue in 2025
- Asia-Pacific is expected to post the highest regional CAGR of 11.2% through 2035, supported by government investment in food grain optical sorters and circular-economy infrastructure
Market Size and Forecast (2021–2035)
MRFR's proprietary estimation framework triangulates bottom-up revenue analysis across 120+ OEMs and system integrators with top-down macro benchmarks from industry associations, import/export databases, and verified procurement records.