Segmentation Quick Reference
| Dimension | Sub-Segments | Dominant Segment | Fastest Growing Segment |
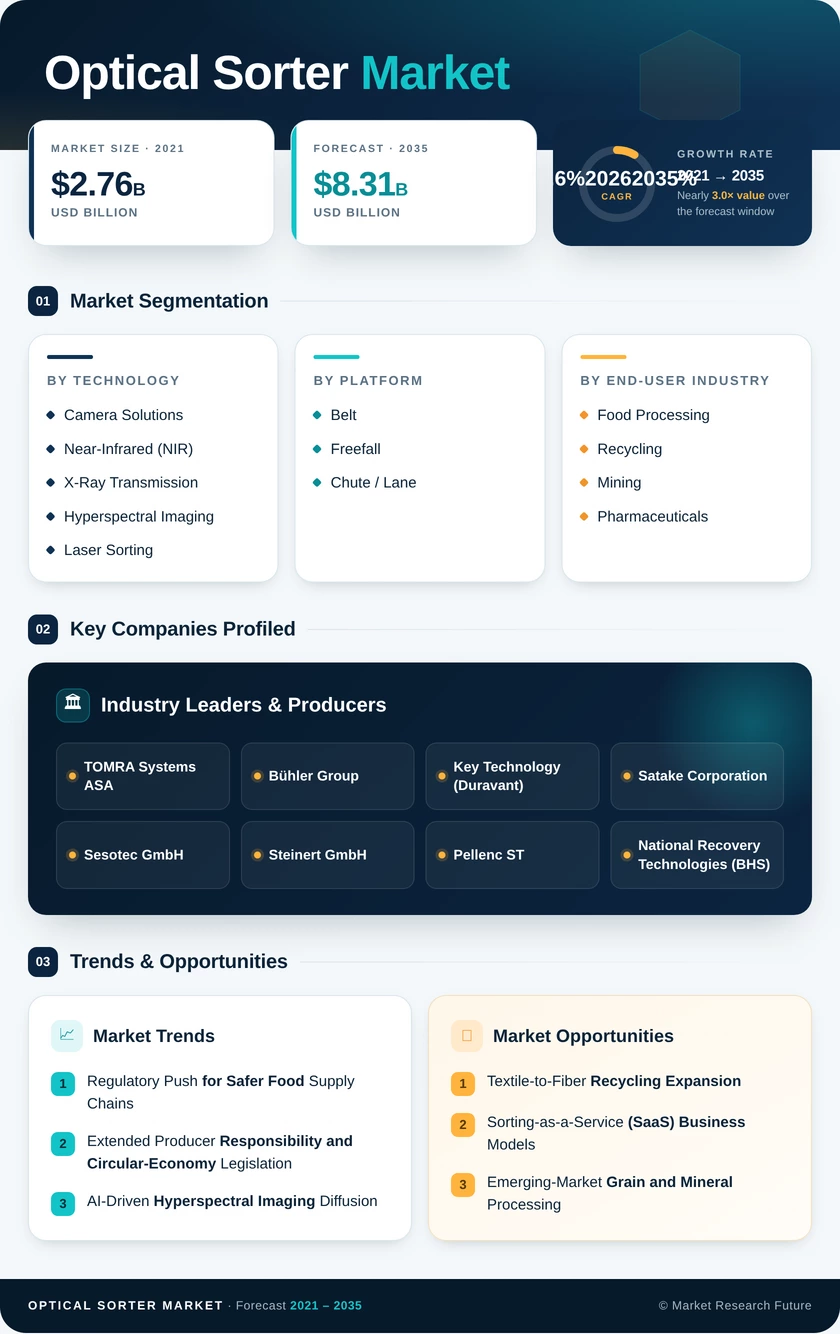
| Technology | Camera Solutions, Near-Infrared (NIR), X-Ray Transmission, Hyperspectral Imaging, Laser Sorting | Camera Solutions | Hyperspectral Imaging |
| Platform | Belt, Freefall, Chute / Lane | Belt | Freefall |
| End-User Industry | Food Processing, Recycling, Mining, Optical Sorter Markets | Food Processing | Optical Sorter Markets |
| Region | North America, Europe, Asia-Pacific, South America, Middle East & Africa | North America | Asia-Pacific |
Market Segmentation Overview
By Technology
| Sub-Segment | Key Trend |
| Camera Solutions | RGB and multispectral cameras remain the workhorse for visual defect detection in food and recycling lines |
| Near-Infrared (NIR) | Polymer-identification capabilities driving rapid adoption in PET/HDPE recycling facilities |
| X-Ray Transmission | Density-based contaminant detection expanding in meat, seafood, and confectionery processing |
| Hyperspectral Imaging | Multi-band sensing enabling simultaneous material and defect classification in mining and textiles |
| Laser Sorting | High-precision grain and seed grading applications in premium agricultural markets |
Camera solutions and near-infrared systems together account for the majority of the Optical Sorter Market revenue. AI integration is accelerating across all sub-segments, with deep-learning inference modules becoming standard on new installations from 2025 onward.
By Platform
| Sub-Segment | Key Trend |
| Belt | Dominant configuration for high-throughput food processing and municipal recycling applications |
| Freefall | Preferred for gravity-fed grain, rice, and pulse sorting in compact mill environments |
| Chute / Lane | Used for small-particle applications including nuts, spices, and plastic flakes |
Belt-based platforms lead due to their adaptability to wide material widths and integration with existing conveyor infrastructure. Freefall systems are the fastest-growing platform as grain-processing modernization programs scale across Asia and Africa.
By End-User Industry
| Sub-Segment | Key Trend |
| Food Processing | Regulatory compliance (FSMA, FSSAI, EU hygiene) driving mandatory optical inspection adoption |
| Recycling | EPR mandates and deposit-return schemes expanding the installed base of NIR and camera sorters |
| Mining | Ore pre-concentration using sensor-based sorting reduces water usage and energy consumption |
| Optical Sorter Markets | GMP compliance driving adoption for capsule, tablet, and packaging inspection |
Food processing remains the largest end-user segment. The recycling sector is growing fastest as global circular-economy legislation raises purity thresholds, requiring advanced sorting infrastructure to meet compliance deadlines through 2035.