Segmentation Quick Reference
| Dimension | Sub-Segments | Dominant Segment | Fastest Growing Segment |
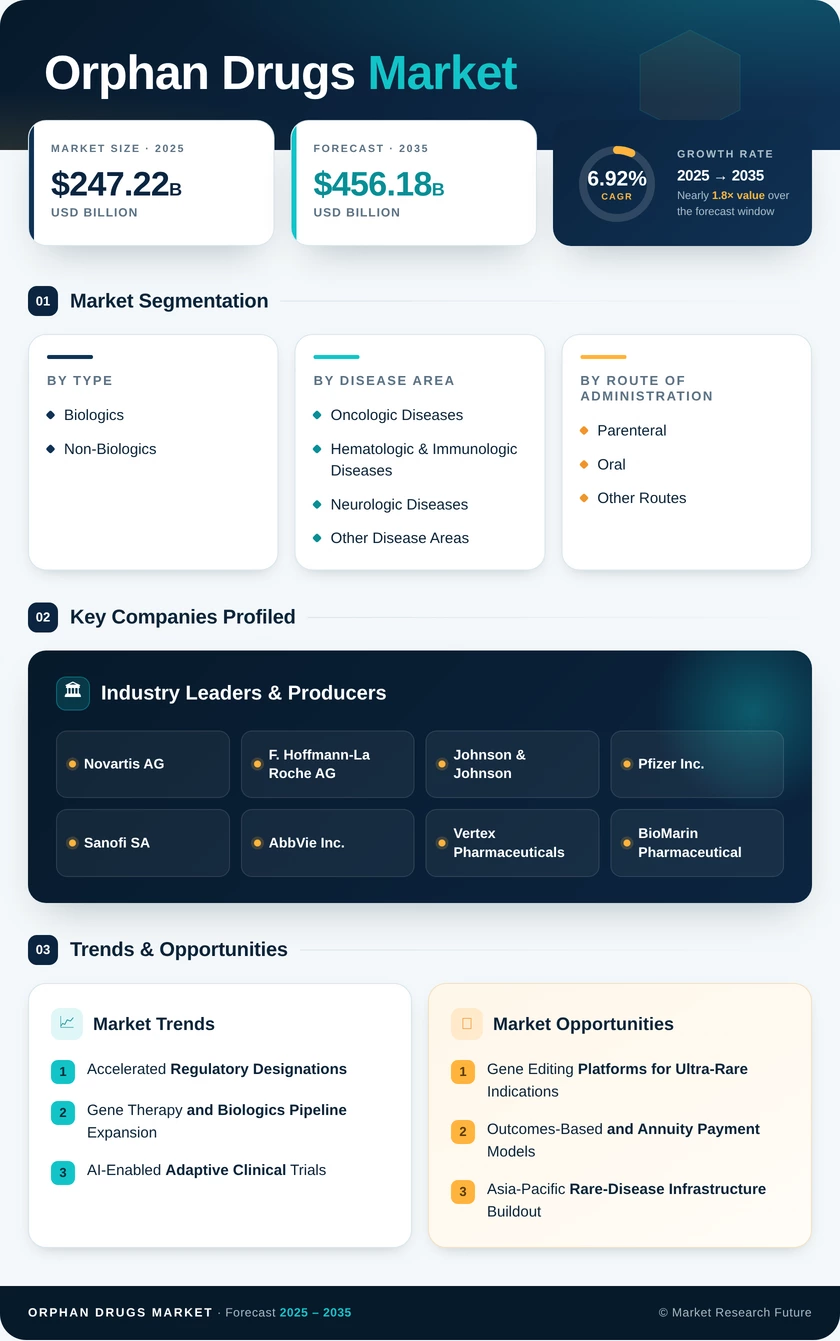
| Drug Type | Biologics, Non-Biologics | Biologics | Non-Biologics |
| Disease Area | Oncologic Diseases, Hematologic & Immunologic Diseases, Neurologic Diseases, Other | Oncologic Diseases | Neurologic Diseases |
| Route of Administration | Parenteral, Oral, Other | Parenteral | Oral |
| Distribution Channel | Hospital Pharmacies, Online Pharmacies, Other | Hospital Pharmacies | Online Pharmacies |
| Geography | North America, Europe, Asia-Pacific, South America, Middle East & Africa | North America | Asia-Pacific |
Market Segmentation Overview
By Drug Type
| Sub-Segment | Key Trend |
| Biologics | Gene therapies and monoclonal antibodies are driving premium pricing and market share expansion |
| Non-Biologics | Next-generation small molecules and substrate reduction therapies are gaining traction in chronic rare conditions |
Biologics continue to capture the majority of orphan drug revenue, supported by accelerating gene therapy approvals and expanding enzyme replacement therapy indications. Non-biologics are experiencing renewed investment as advanced formulation platforms improve oral bioavailability for previously injectable rare disease candidates.
By Disease Area
| Sub-Segment | Key Trend |
| Oncologic Diseases | Highest volume of orphan designations; precision oncology driving targeted therapy adoption |
| Hematologic & Immunologic Diseases | Gene therapy approvals for hemophilia and sickle cell transforming treatment paradigms |
| Neurologic Diseases | Antisense oligonucleotides and CNS-targeted gene therapies opening new therapeutic frontiers |
| Other Disease Areas | Metabolic, endocrine, and pulmonary rare conditions are seeing steady pipeline growth |
Oncology dominates due to the regulatory incentive structure that favors tumor-specific orphan designations. Neurologic diseases represent the fastest-growing category as breakthrough therapies for spinal muscular atrophy and rare epilepsies demonstrate durable clinical benefit.
By Route of Administration
| Sub-Segment | Key Trend |
| Parenteral | Infusion and injection remain the default for biologics-heavy rare disease portfolios |
| Oral | Formulation innovation enabling transition from injectable to oral dosing |
| Other Routes | Intrathecal delivery expanding for CNS rare diseases; inhaled therapies emerging for pulmonary conditions |
Parenteral routes maintain dominance given the protein-based nature of most approved orphan therapies. Oral administration is the fastest-growing route as sponsors invest in enabling technologies that convert hospital-administered therapies into at-home oral regimens.
By Distribution Channel
| Sub-Segment | Key Trend |
| Hospital Pharmacies | Primary channel for complex biologics requiring cold-chain handling and clinical oversight |
| Online Pharmacies | Rapid digitization of specialty pharmacy; direct-to-patient models improving access |
| Other Channels | Retail specialty pharmacies and government depot systems supporting regional distribution |
Hospital pharmacies handle the clinical and logistical complexity of most orphan therapies. Online and digital specialty pharmacy models are scaling rapidly, particularly for chronic-dosing products where home delivery enhances patient adherence and reduces treatment burden.
By Geography
| Sub-Segment | Key Trend |
| North America | Regulatory incentive leadership and premium reimbursement sustaining global dominance |
| Europe | Exclusivity reform and cross-border HTA shaping the competitive landscape |
| Asia-Pacific | Policy-driven catalog expansion and accelerated approval pathways are fueling double-digit growth |
| South America | Public health system integration and judicial access pathways are expanding coverage |
| Middle East & Africa | National rare-disease strategies and import policy reform are opening new access corridors |
North America's entrenched regulatory and reimbursement advantages sustain its position as the largest orphan drug market globally. Asia-Pacific's rapid policy evolution — particularly in China, Japan, and South Korea — is establishing the region as the primary growth engine through 2035.