Segmentation Quick Reference
| Dimension | Sub-Segments | Dominant Segment | Fastest Growing Segment |
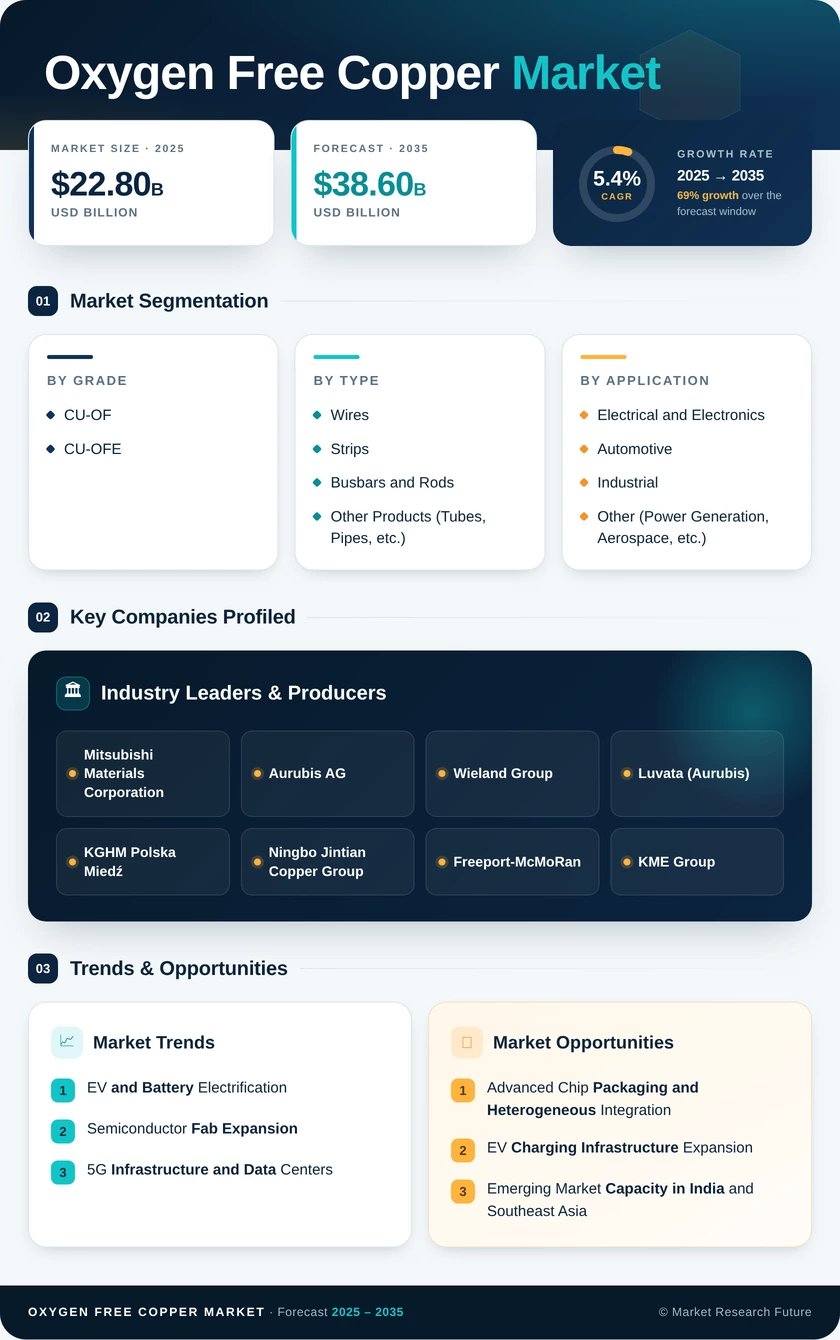
| Grade | CU-OF, CU-OFE | CU-OF (~62% share) | CU-OFE (5.8% CAGR) |
| Product | Wires, Strips, Busbars and Rods, Other Products (Tubes and Pipes, Etc.) | Wires (USD 9.40B, 2025) | Busbars and Rods (5.6% CAGR) |
| End-User Industry | Electrical and Electronics, Automotive, Industrial, Other End-User Industries (Power Generation, Aerospace, Etc.) | Electrical and Electronics (~44% share) | Automotive (6.0% CAGR) |
| Geography | Asia-Pacific, North America, Europe, South America, the Middle East & Africa | Asia-Pacific (~48% share) | Asia-Pacific (6.1% CAGR) |
Market Segmentation Overview
By Grade
| Sub-Segment | Key Trend |
| CU-OF | Volume-driven demand across general electronics, power wiring, and industrial applications, where ≤50 ppm oxygen content suffices |
| CU-OFE | Premium growth fueled by semiconductor, aerospace, and superconductor requirements demanding ≤5 ppm oxygen content |
CU-OF remains the workhorse grade, while CU-OFE is capturing an increasing value share as chip nodes shrink below 5 nm and automotive power electronics transition to 800V architectures. The grade split reflects a market that serves both commodity-scale and ultra-high-specification demand simultaneously.
By Product
| Sub-Segment | Key Trend |
| Wires | Largest segment: growth sustained by EV wiring harnesses, 5G cabling, and power transmission upgrades |
| Strips | Second-largest; driven by lead frames, connector stamping, and flexible printed circuit demand |
| Busbars and Rods | Fastest growing, propelled by renewable energy switchgear and hyperscale data center power distribution |
| Other Products (Tubes and Pipes, Etc.) | Niche segment serving HVAC, medical instrumentation, and heat exchanger applications |
Wires dominate in volume, but busbars and rods are gaining share as grid infrastructure and data center construction drive demand for heavy-gauge, high-current copper products. Strips benefit from the miniaturization trend in electronics, requiring tighter dimensional tolerances.
By End-User Industry
| Sub-Segment | Key Trend |
| Electrical and Electronics | Largest end-user: 5G, semiconductor packaging, and consumer electronics sustain a stable demand |
| Automotive | Fastest growing; battery EV platforms multiply copper intensity per vehicle by 2.5× vs. ICE |
| Industrial | Steady growth from motor, transformer, and general machinery applications |
| Other End-User Industries (Power Generation, Aerospace, Etc.) | Niche but high-margin; turbine windings, avionics, and defense systems specify CU-OFE grades |
The electrical and electronics sector provides base-load demand stability, while the automotive sector is the primary growth engine. Industrial applications offer consistent volume, and aerospace/defense segments command the highest per-unit margins.
By Geography
| Sub-Segment | Key Trend |
| Asia-Pacific | Dominant and fastest growing, anchored by China's smelting scale, Japan's specialty refining, and India's capacity expansion |
| Europe | Second-largest; driven by automotive OEM electrification and the EU Critical Raw Oxygen-Free Copper Market Act |
| North America | Third-largest; CHIPS Act, defense procurement, and data center investment fuel growth |
| South America | Emerging mining-to-refining integration in Chile and Peru adds value-added capacity |
| Middle East & Africa | The smallest infrastructure projects in Saudi Arabia and the UAE create localized premium demand |
Regional dynamics reflect the interplay between upstream refining capacity and downstream manufacturing density. Asia-Pacific's structural advantage lies in the co-location of smelting, fabrication, and end-user assembly, while North America and Europe are investing to reduce import dependency.