Passive Authentication Market (2026 - 2035)

Passive Authentication Market Size, Share and Research Report By Component (Solutions, Services), By Authentication Type (Behavioral Biometrics, Device Recognition, Risk-Based Authentication, Continuous Authentication), By Deployment Mode (Cloud-Based, On-Premises), By Organization Size (Large Enterprises, Small and Medium Enterprises), By End User (Banking, Financial Services and Insurance, Healthcare, Retail and E-commerce, Government, Telecommunications, Information Technology and Others) and By Regional (North America, Europe, South America, Asia Pacific, Middle East and Africa) - Industry Forecast to 2035.
ID: MRFR/ICT/6065-HCR
100 Pages
Ankit Gupta
Last Updated: June 26, 2026
Passive Authentication Market
Market Size
Forecast Period2026-2035
CAGR (2026-2035)21.5%
2025 Market SizeUSD 2.33 Billion
2035 Market SizeUSD 16.34 Billion
Key Players
BioCatch
NuData Security
LexisNexis Risk Solutions
Callsign
Ping Identity
IBM
Opportunities
  • Embedded Authentication in Digital Health Platforms
  • SME-Focused Authentication-as-a-Service Models
  • Identity Monetization in Open-Banking Ecosystems

Passive Authentication Market Summary

The Passive Authentication Market was valued at USD 2.33 billion in 2025 and is projected to reach USD 2.83 billion in 2026 before climbing to USD 16.34 billion by 2035, advancing at a 21.5% CAGR during 2026–2035. This trajectory is driven by an acute rise in AI-powered identity fraud — synthetic deepfakes increased 3,000% between 2022 and 2024 according to industry trackers [1] — and by regulatory mandates compelling financial institutions and healthcare providers to embed stronger, non-intrusive verification layers into digital workflows. The Passive Authentication Market sits at the intersection of cybersecurity urgency and consumer experience design.

A fundamental technology shift underpins this growth. Legacy challenge-response models — passwords, one-time PINs, knowledge-based questions — are giving way to ambient signal analysis that evaluates keystroke cadence, device posture, geolocation patterns, and session behavior in real time. Europe's PSD2 Strong Customer Authentication requirements and Asia's evolving biometric mandates have pulled these capabilities from niche pilots into mainstream procurement [2]. Global enterprise spending on identity-centric security surpassed USD 28 billion in 2024, and a rising share of that budget now flows toward passive verification architectures [3].

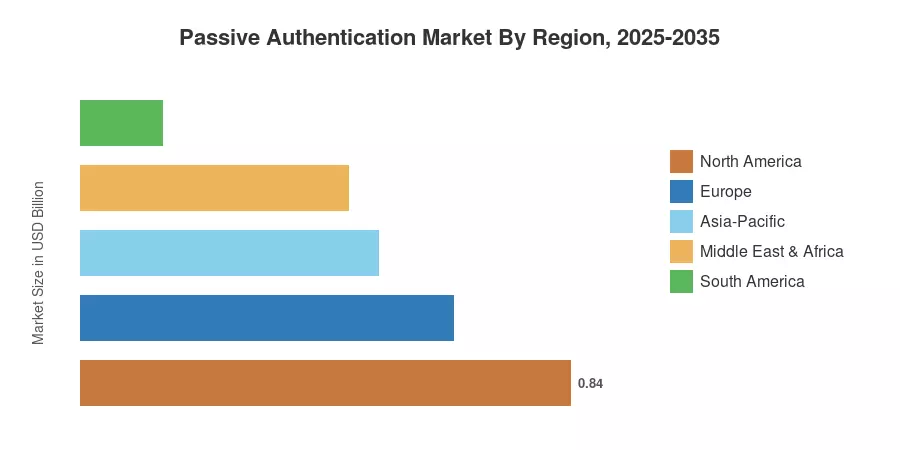
North America held 36.2% of the Passive Authentication Market in 2025, anchored by early zero-trust adoption across U.S. financial services and federal agencies. Europe captured the second-largest share at approximately 27.5%, propelled by PSD2 and eIDAS 2.0 compliance cycles. Asia-Pacific is tracking the fastest regional CAGR of 21.9% through 2035, fueled by India's Digital Personal Data Protection Act and China's expanding mobile-payment ecosystem. As digital identity frameworks mature globally, the Passive Authentication Market is poised to become a foundational layer of enterprise security architecture.


Key Report Takeaways

• By Component

  • Solutions represented 76.0% of the Passive Authentication Market in 2025, reflecting strong demand for integrated software platforms.
  • Services are projected to expand at a 22.2% CAGR through 2035, driven by managed detection and deployment consulting engagements.

• By Authentication Technology

  • Behavioral analytics captured 34.3% of total revenue in 2025, remaining the single largest technology segment.
  • Multi-modal authentication is forecast to grow at a 22.7% CAGR, reflecting enterprise preference for layered signal fusion.

• By End-User Industry

  • BFSI accounted for 44.3% of the Passive Authentication Market in 2025, led by fraud-prevention mandates.
  • Healthcare and life sciences are forecast to grow at a 21.8% CAGR, as patient-portal security regulations tighten.

• By Region

  • North America held the dominant share of the Passive Authentication Market, driven by federal zero-trust mandates.
  • Asia-Pacific is expanding at a 21.9% CAGR, the fastest among all regions, propelled by digital payment proliferation.


Market Size and Forecast (2021–2035)

Market Research Future derived historical estimates from verified vendor revenues, regulatory filings, and third-party spending surveys across identity and access management sectors. Forecast projections apply a compound growth model calibrated to macroeconomic indicators, regulatory pipeline analysis, and end-user adoption curves across 42 countries.
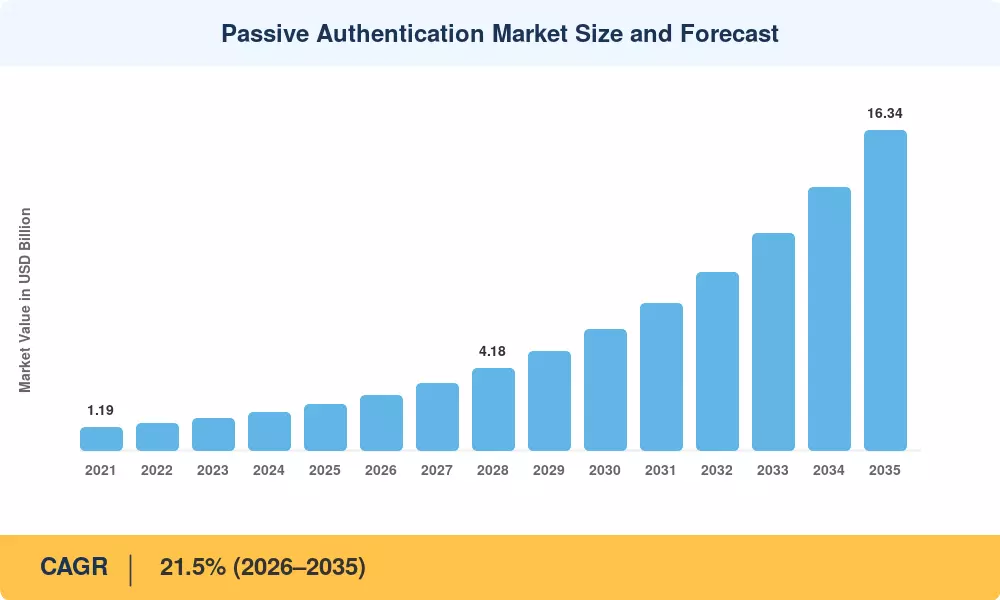
Passive Authentication Market Size and Forecast
Our Impact
Enabled $4.3B Revenue Impact for Fortune 500 and Leading Multinationals
Partnering with 2000+ Global Organizations Each Year
30K+ Citations by Top-Tier Firms in the Industry

Driver Impact Analysis

Driver ~% Impact on CAGR Geographic Relevance Impact Timeline
AI-generated identity fraud proliferation 22–25% Global Short-term (≤2 yr)
Zero-trust security framework mandates 18–21% North America, Europe Medium-term (2–4 yr)
PSD2 SCA and open-banking regulations 14–17% Europe, Asia-Pacific Short-term (≤2 yr)
Mobile-payment ecosystem expansion 12–15% Asia-Pacific, South America Medium-term (2–4 yr)
Cloud-native identity platform adoption 10–13% Global Long-term (≥4 yr)
Digital health and telemedicine identity needs 8–10% North America, Europe Medium-term (2–4 yr)
Insurance and underwriting fraud reduction 5–7% North America Long-term (≥4 yr)


AI-Generated Identity Fraud Proliferation

Deepfake attacks targeting account-onboarding and transaction-authorization workflows increased by over 3,000% between 2022 and 2024 [1]. Financial institutions reported that synthetic identity fraud alone cost U.S. lenders approximately USD 3.1 billion in 2024, according to the Federal Reserve's payments fraud tracker [14]. These threats have made passive signal analysis — which evaluates hundreds of behavioral and device parameters per session — a front-line defense that static credentials cannot replicate. The Passive Authentication Market benefits directly, as banks and fintechs accelerate procurement to close this gap.

Zero-Trust Security Framework Mandates

The U.S. Office of Management and Budget's M-22-09 directive required federal agencies to implement zero-trust architectures by the end of fiscal year 2024, triggering a procurement wave that cascaded into civilian-sector contracts [3]. Passive verification fits naturally into zero-trust models because it enables continuous session validation without disrupting workflows. estimated that 60% of large enterprises will have partially deployed zero-trust programs by 2026, each requiring identity-layer investments that feed the Passive Authentication Market pipeline [15].

PSD2 SCA and Open-Banking Regulations

Europe's Revised Payment Services Directive mandated Strong Customer Authentication for electronic transactions, and subsequent regulatory technical standards pushed banks toward low-friction compliance solutions [2]. The European Banking Authority recorded a 35% decline in card-not-present fraud across EEA member states between 2021 and 2024, directly attributable to SCA adoption. Passive authentication methods — which satisfy SCA's "inherence" factor by analyzing user behavior — became the preferred compliance pathway because they minimize transaction abandonment. This regulatory tailwind extends the Passive Authentication Market across every European payment corridor.

Mobile-Payment Ecosystem Expansion

India's Unified Payments Interface processed over 14 billion transactions per month by late 2024 [11], and Southeast Asia's mobile-wallet penetration rate surpassed 55% across ASEAN-6 economies. Each transaction requires identity assurance at a speed and scale that challenge conventional two-factor models. Passive authentication layers running behind mobile-payment interfaces are emerging as the preferred approach, particularly where SMS-based OTPs face interception risks. This mobile-commerce explosion is a primary reason the Passive Authentication Market in Asia-Pacific is advancing at the fastest regional growth rate.


Restraints Impact Analysis

The restraint impacts below represent directional drag estimates on the market's growth trajectory. They reflect supply-side friction, regulatory ambiguity, and adoption hesitancy rather than absolute reductions in revenue.

Restraint ~% Drag on CAGR Geographic Relevance Impact Timeline
Privacy and biometric data regulations –4 to –6% Europe, North America Short-term (≤2 yr)
Integration complexity with legacy IAM stacks –3 to –5% Global Medium-term (2–4 yr)
False-positive rates and user friction trade-offs –2 to –4% Global Short-term (≤2 yr)
High upfront deployment cost for SMEs –2 to –3% South America, MEA Long-term (≥4 yr)
Limited awareness in non-BFSI verticals –1 to –2% Global Medium-term (2–4 yr)


Privacy and Biometric Data Regulations

The EU's General Data Protection Regulation classifies behavioral biometric signals as special-category personal data, requiring explicit consent and data-protection impact assessments before deployment [16]. Similar restrictions under Brazil's LGPD and India's Digital Personal Data Protection Act create compliance overhead that slows procurement cycles. Vendors must demonstrate purpose limitation, data minimization, and right-to-erasure capabilities — requirements that add engineering cost and lengthen sales cycles for the Passive Authentication Market, particularly in cross-border deployments.

Integration Complexity with Legacy IAM Stacks

Many enterprises still operate identity architectures built around LDAP directories, RADIUS servers, and on-premises single-sign-on appliances [15]. Layering passive signal analysis on top of these stacks often demands custom API middleware, schema mapping, and parallel-run validation periods that can stretch deployments to 12–18 months. A 2024 survey found that 42% of identity-security buyers cited integration difficulty as the top barrier to adopting new authentication technologies, underscoring a drag factor on the Passive Authentication Market.

False-Positive Rates and User Friction Trade-Offs

Passive authentication models that flag too many legitimate sessions as anomalous can degrade user experience and increase helpdesk costs [17]. The 2024 digital trust survey reported that 27% of enterprises experienced customer complaints linked to overly aggressive risk scoring during initial deployments. Calibrating detection thresholds — balancing fraud catch rates against false-decline volumes — remains an operational challenge. Until vendors deliver more adaptive tuning, this friction dampens the expansion of the Passive Authentication Market beyond early adopters.

Passive Authentication Market Opportunities

Embedded Authentication in Digital Health Platforms

By 2024, there will be over 1.3 billion telehealth visits globally [12], and healthcare platforms are under increasing regulatory demand to authenticate the identity of patients without impeding treatment delivery. Both HIPAA’s identity-proofing update and the European Health Data Space framework from the EU promote non-intrusive verification approaches. Embedding session-level behavioral checks in electronic health record portals and remote-monitoring devices can help the Passive Authentication Market seize a significant greenfield opportunity.


SME-Focused Authentication-as-a-Service Models

Often, resource-constrained small and mid-sized organizations lack the in-house security staff required to setup and tune passive authentication systems. Authentication-as-a-service options managed by API-first cloud platforms with per-transaction pricing dramatically lower the barrier to entry. This sector is growing at a CAGR of 23.4% and is a largely untapped distribution channel for the Passive Authentication Market, especially throughout South American and Middle Eastern regions.


Identity Monetization in Open-Banking Ecosystems

Open-banking legislation in the EU, UK, Australia and Brazil requires financial companies to exchange client data using common APIs [2]. Passive authentication companies can serve as trust brokers in these data-exchange systems by licensing identity confidence scores to third-party fintechs. This establishes a recurring income stream outside of typical software licensing and opens up an additional layer of addressability for the Passive Authentication Market.


Government Digital Identity Programs in Emerging Markets

Together, India’s Aadhaar ecosystem, Indonesia’s IKD digital identity effort, and Nigeria’s NIN enrollment drive cover more than 1.5 billion residents [11]. As these programs transition from enrollment checks to transaction verification, passive signal analysis can offer a means to detect fraud on a large scale without the need for specialist hardware. The Passive Authentication Market can benefit from public sector procurement in regions where smartphone penetration is greater than traditional credit infrastructure.


Automotive and IoT Identity Verification

Connected vehicles and industrial IoT endpoints will exceed 30 billion units globally by 2030, according to GSMA forecasts [18]. Each connected device requires context-aware identity verification — driver profiles in vehicles, operator authentication on industrial control systems — that cannot rely on manual credential entry. Passive behavioral and environmental signals provide the only scalable approach. This emerging vertical presents a long-horizon growth vector for the Passive Authentication Market beyond traditional enterprise IT perimeters.


Passive Authentication Market Future Outlook

AI-Native Authentication Architectures

By 2028, the majority of passive authentication platforms will transition from rule-based anomaly detection to AI-native architectures that self-train on individual user behavioral models [9]. projects that 75% of identity verification decisions will be augmented by machine learning by 2027, enabling the Passive Authentication Market to deliver sub-100-millisecond risk scores across billions of daily sessions. This shift will compress deployment timelines and reduce false-positive rates by an estimated 40–50%.

Platform Consolidation and Vendor Convergence

The Passive Authentication Market is entering a consolidation phase. Established identity vendors — including Thales, LexisNexis, and Mastercard — have already acquired behavioral-analytics specialists, and this M&A cadence is expected to accelerate through 2030 [20]. The long-term outcome will be integrated identity platforms that bundle passive authentication with credential management, fraud orchestration, and compliance reporting, raising barriers for standalone entrants.

Decentralized Identity and Verifiable Credentials

The W3C Verifiable Credentials standard and the EU's eIDAS 2.0 digital-wallet regulation are converging to create a user-controlled identity layer [16]. Passive authentication will serve as the trust anchor within these decentralized frameworks — verifying that the person presenting a credential is the legitimate holder through ambient behavioral signals. This architectural evolution extends the Passive Authentication Market's addressable scope beyond enterprise perimeters into citizen-facing government services.

Sustainability and Ethical Deployment

Regulators and enterprise buyers alike are scrutinizing the ethical implications of ambient data collection [17]. By 2030, expect certification frameworks — similar to SOC 2 but specific to behavioral biometric processing — to become procurement prerequisites. Vendors that proactively achieve these certifications will gain competitive advantages, positioning the Passive Authentication Market as a trust-enhancing layer rather than a surveillance mechanism.


Passive Authentication Market Segmentation

By Component

Segment Key Metric Primary Demand Driver
Solutions 76.0% share (2025) Integrated platform demand across BFSI
Services 22.2% CAGR (2026–2035) Managed deployment for SMEs and mid-tier banks


Solutions dominate the Passive Authentication Market because enterprises prefer self-contained platforms that embed directly into existing identity stacks via APIs. Vendors such as BioCatch and Callsign offer cloud-native SDK packages that financial institutions deploy within weeks rather than months. The services segment, meanwhile, is accelerating as managed-service providers bundle deployment consulting, model tuning, and 24/7 threat monitoring for organizations that lack dedicated identity-security teams.

By Authentication Technology

Segment Key Metric Primary Demand Driver
Behavioral Biometrics 34.3% share (2025) Keystroke and navigation-pattern analysis for fraud detection
Face and Gesture Recognition USD 0.52 Billion (2025) Mobile-device native sensor integration
Device and Location Analytics 18.4% CAGR (2026–2035) IP-geofencing and device-fingerprint validation
Multi-Modal Authentication 22.7% CAGR (2026–2035) Signal-fusion platforms for high-assurance use cases


Behavioral analytics remains the largest technology segment within the Passive Authentication Market, valued for its ability to assess identity through typing rhythms, mouse dynamics, and touchscreen gestures without requiring dedicated hardware. Multi-modal authentication — which fuses behavioral signals with device telemetry, location context, and biometric inputs — is the fastest-expanding technology approach, as enterprises seek layered assurance models that reduce single-point-of-failure risks.

By Deployment Mode

Segment Key Metric Primary Demand Driver
Cloud 72.0% share (2025) API-first scalability and rapid provisioning
On-Premises USD 0.65 Billion (2025) Data-sovereignty requirements in regulated industries


Cloud deployment commands the largest portion of the Passive Authentication Market, reflecting the industry-wide preference for API-accessible, elastically scalable identity services. On-premises installations persist primarily in defense, government, and heavily regulated healthcare environments where data must remain within controlled network boundaries.

By Organization Size

Segment Key Metric Primary Demand Driver
Large Enterprises 69.0% share (2025) Complex identity stacks and regulatory mandates
Small and Medium Enterprises 23.4% CAGR (2026–2035) Authentication-as-a-service accessibility


Large enterprises continue to anchor the Passive Authentication Market, deploying behavioral verification across customer-facing portals, internal workforce access, and supply-chain partner interactions. SMEs represent the faster-growing segment, as cloud-delivered per-transaction pricing models remove capital-expenditure barriers and enable mid-market retailers and digital-health startups to access enterprise-grade identity assurance.

By End-User Industry

Segment Key Metric Primary Demand Driver
BFSI 44.3% share (2025) Fraud reduction and SCA compliance mandates
Retail and E-Commerce USD 0.33 Billion (2025) Checkout-conversion optimization
Healthcare and Life Sciences 21.8% CAGR (2026–2035) Patient-portal identity assurance
IT and Telecom 17.9% CAGR (2026–2035) Workforce access governance
Government and Defense USD 0.19 Billion (2025) National digital-identity programs


BFSI remains the cornerstone vertical for the Passive Authentication Market, with banks deploying behavioral session monitoring across online banking, mobile apps, and payment gateways. Healthcare is accelerating fastest as HIPAA identity-proofing guidance tightens, and telemedicine platforms must verify patient identity across every remote-care session without imposing cumbersome login steps.


Regional Market Share Analysis

Region Key Metric Primary Investment Themes
North America 36.2% share (2025) Zero-trust mandates, BFSI fraud prevention
Europe USD 0.64 Billion (2025) PSD2 SCA compliance, eIDAS 2.0 rollout
Asia-Pacific 21.9% CAGR (2026–2035) Mobile-payment security, digital ID programs
South America USD 0.14 Billion (2025) Open-banking regulation, fintech growth
Middle East & Africa 19.8% CAGR (2026–2035) Smart-government initiatives, banking digitization
Total USD 2.33 Billion (2025)

The Passive Authentication Market exhibits a clear geographic concentration pattern, with North America and Europe collectively representing over 63% of global revenue in 2025. Asia-Pacific is closing the gap rapidly, driven by mobile-commerce scale and regulatory modernization.


North America

Country Key Metric Key Driver
United States 78.4% of regional share Federal zero-trust mandates and BFSI investment
Canada USD 0.11 Billion (2025) Open-banking framework rollout
Mexico 20.6% CAGR (2026–2035) Fintech expansion and digital payment growth


The United States remains the primary revenue contributor within the Passive Authentication Market in North America, driven by the OMB zero-trust executive order and aggressive fraud-prevention spending across top-20 banks [3]. Canada's Consumer-Driven Banking framework, entering its implementation phase in 2025, is expected to accelerate demand for transaction-level authentication services. Mexico's fintech licensing regime under CNBV is pulling smaller lenders toward cloud-delivered verification, making it the fastest-growing country within the subregion.

Europe

Country Key Metric Key Driver
Germany 21.3% of regional share PSD2 enforcement and industrial IoT security
United Kingdom USD 0.13 Billion (2025) Post-Brexit financial-services digitization
France 18.7% CAGR (2026–2035) eIDAS 2.0 digital-wallet mandate
Italy 14.8% of regional share Banking consolidation and digital payments
Spain 19.2% CAGR (2026–2035) Mobile banking penetration growth
Nordic Countries USD 0.06 Billion (2025) BankID ecosystem expansion
Russia 12.4% CAGR (2026–2035) Domestic fintech development
Rest of Europe USD 0.05 Billion (2025) Regulatory harmonization across EU member states


Europe's Passive Authentication Market is shaped by the regulatory cadence of PSD2 revisions and the eIDAS 2.0 digital identity wallet framework, which the European Commission aims to make available to all EU citizens by 2027 [16]. Germany's strong industrial base is driving early adoption in manufacturing-sector identity verification, while France benefits from aggressive government digitization timelines.

Asia-Pacific

Country Key Metric Key Driver
China 29.5% of regional share Mobile-payment scale and data-security law
India 24.3% CAGR (2026–2035) Aadhaar-linked financial authentication
Japan USD 0.07 Billion (2025) Banking-sector cybersecurity investment
South Korea 21.8% CAGR (2026–2035) MyData initiative and open-banking APIs
ASEAN 23.1% CAGR (2026–2035) Digital-wallet proliferation
Rest of Asia-Pacific USD 0.04 Billion (2025) Emerging digital-identity programs


Asia-Pacific represents the fastest-growing theater for the Passive Authentication Market, propelled by India's UPI ecosystem processing over 14 billion monthly transactions and China's Personal Information Protection Law driving enterprise-grade identity verification [11]. South Korea's MyData framework and Japan's revised Act on Protection of Personal Information are creating parallel demand corridors across Northeast Asia.

South America

Country Key Metric Key Driver
Brazil 62.8% of regional share PIX payments and LGPD compliance
Argentina 20.4% CAGR (2026–2035) Fintech licensing expansion
Rest of South America USD 0.03 Billion (2025) Cross-border payment corridors


Brazil dominates South America's Passive Authentication Market thanks to the explosive growth of the PIX instant-payment system, which exceeded 200 million registered users by 2024 [11]. The country's General Data Protection Law (LGPD) simultaneously compels financial institutions to implement identity-verification methods that satisfy both security and privacy requirements. Argentina's fintech sector, though smaller, is expanding rapidly under new central-bank licensing guidelines.

Middle East & Africa

Country Key Metric Key Driver
Saudi Arabia 31.7% of regional share Vision 2030 digital transformation
UAE USD 0.04 Billion (2025) Smart-government and fintech hub ambitions
South Africa 18.9% CAGR (2026–2035) Mobile-banking penetration growth
Egypt 21.2% CAGR (2026–2035) Financial inclusion initiatives
Rest of MEA USD 0.02 Billion (2025) Telecom-led mobile-money platforms


Saudi Arabia's Vision 2030 program is channeling substantial public-sector investment into digital government platforms, each requiring scalable identity assurance [19]. The UAE's position as a regional fintech hub drives early-mover adoption of the Passive Authentication Market, while South Africa and Egypt represent high-growth pockets linked to mobile-money expansion and financial inclusion mandates from their respective central banks.


Passive Authentication Market By Region, 2025-2035

Competitive Benchmarking

The Passive Authentication Market exhibits medium concentration, with the top five vendors holding an estimated 35–42% combined share. The Herfindahl-Hirschman Index sits in the 800–1,100 range, indicating a moderately fragmented landscape where specialized behavioral-analytics firms compete alongside global identity-platform conglomerates. M&A activity has intensified since 2022, as established security vendors acquire niche behavioral specialists to assemble end-to-end identity suites.

Company Est. Revenue Share Range Key Offerings for Passive Authentication Market Strategic Positioning
BioCatch ~8–11% Behavioral session intelligence for banking and payments Market pioneer in behavioral analytics
NuData Security (Mastercard) ~7–10% NuDetect platform for transaction-risk scoring Payment-network integration advantage
LexisNexis Risk Solutions ~6–9% BehavioSec behavioral biometrics suite, ThreatMetrix Broad data-asset and identity-graph leverage
Callsign ~5–8% Intelligence-driven authentication platform AI-first identity orchestration
Ping Identity (Thales) ~5–7% PingOne DaVinci identity orchestration engine Enterprise IAM ecosystem integration
IBM ~4–7% IBM Security Verify with adaptive-access policies Hybrid-cloud and zero-trust portfolio
Microsoft ~4–6% Entra ID with Nuance voice biometrics Ecosystem scale across Azure and M365
SecureAuth ~3–5% Arculix passwordless and continuous authentication Workforce-identity specialization
Plurilock ~2–4% DEFEND behavioral endpoint authentication Government and defense focus
Zighra ~2–4% SensifyID continuous trust platform Edge-device and IoT identity


Recent News & Developments

  • LexisNexis Risk Solutions (May 2022 ): Completed full integration of BehavioSec technology into the ThreatMetrix identity platform, creating a unified behavioral-biometric and device-intelligence solution [20].
  • European Banking Authority (January 2024): Published updated Guidelines on SCA and Common and Secure Communication, reinforcing the role of inherence-based authentication methods for PSD2 compliance [2].
  • Callsign (July 2022 ): Secured USD 60 million in Series C funding to expand AI-driven identity orchestration across Southeast Asian banking markets [21].


Passive Authentication Market Report Scope

Parameter Details
Market Scope Passive authentication solutions and services across component, technology, deployment, organization size, end-user, and geography
Study Period 2021–2035
CAGR (Forecast Period) 21.5% (2026–2035)
Market Size (2025) USD 2.33 Billion
Market Size (2035) USD 16.34 Billion
Fastest Growing Segment Multi-Modal Authentication by technology; SMEs by organization size; Asia-Pacific by geography
Companies Profiled BioCatch, NuData Security (Mastercard), LexisNexis Risk Solutions, Callsign, Ping Identity (Thales), IBM, Microsoft, SecureAuth, Plurilock, Zighra
Valuation Currency USD Billion


FAQs

List of Tables
Table 1: Passive Authentication Market Summary Table Table 2: Passive Authentication Market Market Size and Forecast, 2021–2035 Table 3: Driver Impact Analysis Table 4: Restraints Impact Analysis Table 5: Regional Market Share Summary Table 6: North America Country-Level Analysis Table 7: Europe Country-Level Analysis Table 8: Asia-Pacific Country-Level Analysis Table 9: South America Country-Level Analysis Table 10: Middle East & Africa Country-Level Analysis Table 11: Passive Authentication Market Segmentation by By Component Table 12: Passive Authentication Market Segmentation by By Authentication Technology Table 13: Passive Authentication Market Segmentation by By Deployment Mode Table 14: Passive Authentication Market Segmentation by By Organization Size Table 15: Passive Authentication Market Segmentation by By End-User Industry Table 16: Competitive Benchmarking Matrix Table 17: Report Scope and Methodology Table 18: Detailed Sources and Citations
List of Figures
Figure 1: Passive Authentication Market Market Size Trend, 2021–2035 Figure 2: Passive Authentication Market Year-over-Year Growth Outlook Figure 3: Regional Revenue Share Analysis Figure 4: Driver and Restraint Impact Matrix Figure 5: Competitive Landscape Snapshot Figure 6: Segment Share by By Component Figure 7: Segment Share by By Authentication Technology Figure 8: Segment Share by By Deployment Mode Figure 9: Segment Share by By Organization Size Figure 10: Segment Share by By End-User Industry
Author
Author
Author Profile
Ankit Gupta LinkedIn
Team Lead - Research
Ankit Gupta is a seasoned market intelligence and strategic research professional with over six plus years of experience in the ICT and Semiconductor industries. With academic roots in Telecom, Marketing, and Electronics, he blends technical insight with business strategy. Ankit has led 200+ projects, including work for Fortune 500 clients like Microsoft and Rio Tinto, covering market sizing, tech forecasting, and go-to-market strategies. Known for bridging engineering and enterprise decision-making, his insights support growth, innovation, and investment planning across diverse technology markets.

Research Approach


Secondary Research

The secondary research process involved comprehensive analysis of regulatory frameworks, cybersecurity standards, peer-reviewed technical journals, industry whitepapers, and authoritative technology organizations. Key sources included the National Institute of Standards and Technology (NIST) Digital Identity Guidelines (SP 800-63), European Union Agency for Cybersecurity (ENISA) Threat Landscape Reports, International Organization for Standardization (ISO/IEC 27001, ISO/IEC 30107 for biometrics), FIDO Alliance Technical Specifications, Cybersecurity and Infrastructure Security Agency (CISA) Zero Trust Architecture Guidelines, Financial Services Information Sharing and Analysis Center (FS-ISAC) Reports, Identity Management Institute (IMI) Standards, IEEE Transactions on Information Forensics and Security, ACM Computing Surveys on Authentication Systems, Gartner Hype Cycle for Identity and Access Management, Forrester Wave Reports on Customer Identity Management, IDC Worldwide Identity and Access Management Market Analysis, European Banking Authority (EBA) Guidelines on Strong Customer Authentication, UK National Cyber Security Centre (NCSC) Authentication Guidance, and Pan-European Trust Framework (eIDAS) Regulatory Databases. These sources were used to collect technology adoption statistics, regulatory compliance data, cybersecurity incident reports, enterprise deployment trends, and competitive landscape analysis for behavioral biometrics, device fingerprinting, geolocation intelligence, and risk-based authentication technologies.


Primary Research

To gather both qualitative and quantitative insights, supply-side and demand-side stakeholders were interviewed during the primary research process. Chief Technology Officers, VPs of Identity Engineering, Product Heads for Fraud Prevention Solutions, and Commercial Directors from manufacturers of cybersecurity platforms, biometric technology suppliers, and passive authentication software were examples of supply-side sources. Chief information security officers (CISOs), vice presidents or directors of fraud prevention, heads of digital banking, security architects for e-commerce platforms, and procurement leads from Tier 1 financial institutions, retail businesses, healthcare systems, and government digital identity initiatives were among the demand-side sources. Primary research verified AI/ML product roadmap timelines, validated market segmentation across cloud-based and on-premises installations, and collected data on enterprise adoption trends, SaaS price dynamics, and regulatory compliance expenditures.

Primary Respondent Breakdown:

By Designation: C-level Primaries (40%), Director Level (25%), Others (35%)

By Region: North America (40%), Europe (25%), Asia-Pacific (28%), Rest of World (7%)


Market Size Estimation

Global market valuation was derived through revenue mapping and enterprise deployment volume analysis. The methodology included:

Identification of 50+ key technology providers across North America, Europe, Asia-Pacific, and Latin America specializing in behavioral analytics, device intelligence, and continuous authentication

Product mapping across behavioral biometrics, device recognition, user environment analysis, geolocation tracking, and hybrid authentication models

Analysis of reported and modeled annual recurring revenues (ARR) specific to passive authentication and identity verification portfolios

Coverage of vendors representing 75-80% of global market share in 2024, including cloud-native authentication platforms and legacy identity management providers pivoting to passive solutions

Extrapolation using bottom-up (enterprise user seats × average revenue per user by industry vertical) and top-down (vendor revenue validation and cloud infrastructure spend attribution) approaches to derive segment-specific valuations for banking, e-commerce, healthcare, and government sectors

Key Adjustments Made:

Secondary Sources: Replaced medical regulators (FDA/EMA) with cybersecurity authorities (NIST, ENISA, CISA, FIDO Alliance) and identity management standards (ISO/IEC 30107, eIDAS)

Primary Stakeholders: Shifted from medical professionals (dermatologists, surgeons) to cybersecurity decision-makers (CISOs, fraud prevention directors, digital banking heads)

Respondent Percentages: Adjusted to reflect cybersecurity purchasing dynamics (higher C-level engagement at 40%, North America emphasis at 40% matching the 45% market share, increased APAC representation at 28% reflecting rapid growth)

Market Sizing: Adapted from "procedure volume × ASP" to SaaS metrics (enterprise seats × ARPU) and cloud infrastructure spend attribution appropriate for software-based authentication solutions

Download Free Sample

Kindly complete the form below to receive a free sample of this Report

Download PDF ×

We do not share your information with anyone. However, we may send you emails based on your report interest from time to time. You may contact us at any time to opt-out.
















