Download Free Sample
Kindly complete the form below to receive a free sample of this Report
Patient Monitoring System MRO Services Market Size, Share and Trends Analysis Research Report Information By End Use (Hospitals, Home Care Settings, Ambulatory Surgical Centers, Long-Term Care Facilities), By Technology (Wireless Technology, Telemedicine Technology, Cloud-Based Technology, AI Technology), By Application (Cardiac, Neurological, Respiratory, Multi-Parameter Monitoring), By Device Type (Wearable, Portable, Stationary, Implantable Monitors), By Service Type (Repair, Calibration, Maintenance, Technical Support), And By Region – Market Forecast Till 2035.
As per MRFR analysis, the Patient Monitoring System MRO Services Market was estimated at 5.2 USD Billion in 2024. The Patient Monitoring System MRO Services industry is projected to grow from 5.44 USD Billion in 2025 to 8.6 USD Billion by 2035, exhibiting a compound annual growth rate (CAGR) of 4.68% during the forecast period 2025 - 2035.
The Patient Monitoring System MRO Services Market is poised for substantial growth driven by technological advancements and a shift towards patient-centric care.
| 2024 Market Size | 5.2 (USD Billion) |
| 2035 Market Size | 8.6 (USD Billion) |
| CAGR (2025 - 2035) | 4.68% |
Medtronic (US), Philips (NL), GE Healthcare (US), Siemens Healthineers (DE), Johnson & Johnson (US), Abbott Laboratories (US), Baxter International (US), Boston Scientific (US), Nihon Kohden (JP)
Our Impact
Enabled $4.3B Revenue Impact for Fortune 500 and Leading Multinationals
Partnering with 2000+ Global Organizations Each Year
30K+ Citations by Top-Tier Firms in the Industry
The Patient Monitoring System MRO Services Market is currently experiencing a transformative phase, characterized by advancements in technology and an increasing emphasis on patient-centric care. As healthcare providers seek to enhance operational efficiency and improve patient outcomes, the demand for maintenance, repair, and overhaul services for monitoring systems is on the rise. This market appears to be driven by the integration of innovative solutions, such as remote monitoring capabilities and data analytics, which facilitate real-time patient management. Furthermore, the growing prevalence of chronic diseases necessitates continuous monitoring, thereby propelling the need for reliable MRO services. In addition, regulatory compliance and the need for adherence to safety standards are influencing the landscape of the Patient Monitoring System MRO Services Market. Healthcare facilities are increasingly prioritizing the maintenance of their monitoring equipment to ensure optimal performance and compliance with industry regulations. This trend suggests a shift towards more proactive maintenance strategies, which may enhance the longevity and reliability of monitoring systems. As the market evolves, stakeholders must remain vigilant to emerging technologies and changing regulatory frameworks that could shape future service offerings.
The incorporation of advanced technologies into patient monitoring systems is reshaping the MRO services landscape. Innovations such as artificial intelligence and machine learning are enhancing predictive maintenance capabilities, allowing for timely interventions and reducing downtime.
There is a growing emphasis on patient-centric approaches within healthcare, which is influencing MRO services. Providers are increasingly seeking solutions that not only ensure equipment reliability but also enhance the overall patient experience during monitoring.
The Patient Monitoring System MRO Services Market is witnessing heightened attention towards regulatory compliance. Healthcare facilities are prioritizing adherence to safety standards, which is driving demand for comprehensive maintenance and repair services.
The trend towards home healthcare solutions is reshaping the Patient Monitoring System MRO Services Market. With an increasing number of patients opting for home-based care, there is a growing demand for portable and user-friendly monitoring devices. This shift necessitates the development of MRO services tailored to home healthcare environments, ensuring that devices remain functional and effective. The market for home healthcare monitoring systems is anticipated to grow, potentially leading to a significant increase in the demand for MRO services. As patients seek to manage their health from home, the need for reliable support and maintenance services becomes paramount.
The rising incidence of chronic diseases such as diabetes, cardiovascular disorders, and respiratory conditions is a key driver for the Patient Monitoring System MRO Services Market. As the population ages and lifestyle-related health issues become more prevalent, healthcare providers are increasingly reliant on monitoring systems to manage patient health effectively. The demand for continuous monitoring solutions is expected to rise, leading to an increased need for maintenance, repair, and operational services. This trend indicates a robust market potential for MRO services, as healthcare facilities strive to enhance their monitoring capabilities to improve patient outcomes and reduce hospital readmission rates.
Regulatory compliance is a critical factor influencing the Patient Monitoring System MRO Services Market. Healthcare organizations are mandated to adhere to stringent regulations and quality assurance standards to ensure patient safety and system reliability. Compliance with these regulations necessitates regular maintenance and calibration of monitoring equipment, thereby driving the demand for MRO services. As healthcare providers prioritize adherence to safety standards, the market for MRO services is likely to expand. This focus on compliance not only enhances patient safety but also fosters trust in healthcare systems, further propelling the need for reliable monitoring solutions.
Investment in healthcare infrastructure is a driving force behind the Patient Monitoring System MRO Services Market. Governments and private entities are increasingly allocating funds to enhance healthcare facilities, which includes upgrading patient monitoring systems. This investment not only improves the quality of care but also necessitates ongoing maintenance and operational support for these advanced systems. As healthcare facilities expand and modernize, the demand for MRO services is expected to rise correspondingly. This trend indicates a robust market opportunity for service providers, as healthcare organizations seek to ensure the longevity and reliability of their monitoring equipment.
The Patient Monitoring System MRO Services Market is experiencing a surge in demand due to rapid technological advancements. Innovations such as wireless monitoring devices, cloud-based data storage, and artificial intelligence integration are enhancing the efficiency and accuracy of patient monitoring. These technologies facilitate real-time data collection and analysis, which is crucial for timely medical interventions. The market for patient monitoring systems is projected to grow significantly, with estimates suggesting a compound annual growth rate of over 10% in the coming years. This growth is likely to drive the demand for MRO services, as healthcare facilities seek to maintain and optimize these advanced systems to ensure high-quality patient care.
In the Patient Monitoring System MRO Services Market, the distribution of market share among application segments reveals that Cardiac Monitoring holds the largest share, driven by the increasing prevalence of cardiovascular diseases and the need for continuous monitoring solutions. Following closely, Multi-Parameter Monitoring is emerging as a vital segment, catering to the growing need for integrated monitoring solutions that offer real-time data on various health parameters, appealing to hospital and home-care settings alike.
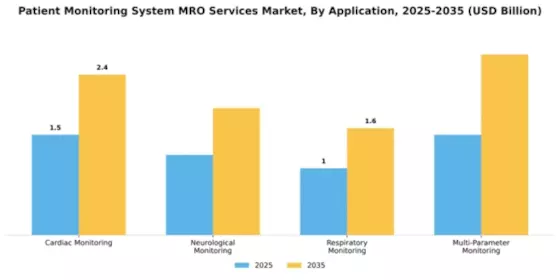
Cardiac Monitoring (Dominant) vs. Neurological Monitoring (Emerging)
Cardiac Monitoring is the dominant application in the Patient Monitoring System MRO Services Market, characterized by advanced technologies that enhance patient outcomes. This segment benefits from a robust demand for heart disease precautions, with continuous innovations in monitoring equipment. Conversely, Neurological Monitoring is regarded as an emerging segment, fueled by increased awareness of neurological disorders and the necessity for timely interventions. Both segments exhibit distinct characteristics where Cardiac Monitoring focuses on real-time heart health analytics, while Neurological Monitoring emphasizes comprehensive brain activity assessment, positioning them strategically in the evolving healthcare landscape.
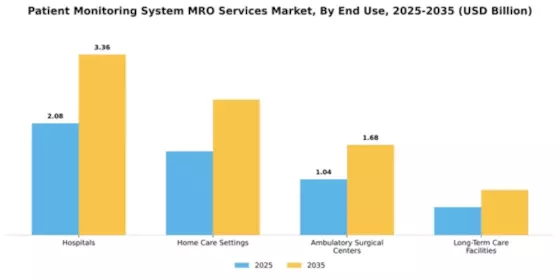
The Patient Monitoring System MRO Services Market is primarily diversified among various end-use segments including hospitals, home care settings, ambulatory surgical centers, and long-term care facilities. Hospitals dominate this market segment owing to their extensive healthcare operations and the dependence on advanced monitoring systems for patient care. Conversely, home care settings are rapidly gaining traction, transforming the way healthcare services are delivered outside traditional facilities, focusing on personalized and convenient patient care. Growth trends indicate that the surge in the elderly population and the increasing prevalence of chronic diseases are pivotal in driving the demand for patient monitoring systems across various settings. Hospitals continue to invest in innovations and integrate advanced technologies, while home care settings are leveraging digital and telehealth solutions, enabling patients to receive constant monitoring at home. This evolution reflects a broader shift towards patient-centric healthcare models that prioritize accessibility and efficiency in various care environments.
Hospitals: Dominant vs. Home Care Settings: Emerging
The dominant segment, hospitals, play a crucial role in the Patient Monitoring System MRO Services Market as they are equipped with complex healthcare infrastructure that relies heavily on monitoring systems. These establishments emphasize the necessity for real-time data and analytics to enhance patient outcomes. In contrast, the emerging segment of home care settings is witnessing substantial growth; they provide tailored monitoring solutions that empower patients to manage their health effectively from the comfort of their homes. This segment's appeal lies in its ability to reduce hospital visits, improve patient satisfaction, and foster independence, thus attracting a new demographic of healthcare services that value convenience and personalized care. As technology advances, both segments are poised to further evolve, with hospitals enhancing their capabilities and home care settings expanding their service offerings.
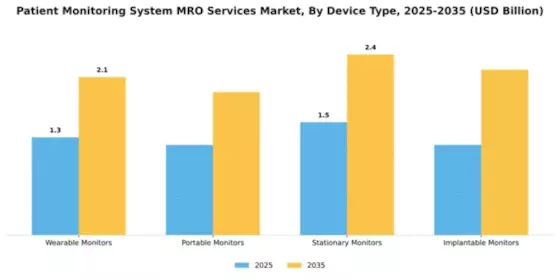
In the Patient Monitoring System MRO Services Market, the device type segment is characterized by diverse devices including wearable monitors, portable monitors, stationary monitors, and implantable monitors. Currently, wearable monitors occupy the largest market share due to their widespread adoption for continuous monitoring, leading to enhanced patient engagement and health management. Portable monitors are rapidly gaining traction as a convenient alternative for both patients and healthcare providers seeking flexibility and ease of use, contributing significantly to their market presence.
Wearable Monitors (Dominant) vs. Implantable Monitors (Emerging)
Wearable monitors represent the dominant segment in the patient monitoring system landscape, distinguished by their capacity for real-time health tracking and user-friendly interfaces. These devices are typically equipped with sensors to monitor vital signs, activity levels, and health metrics, appealing to both consumers and healthcare professionals for proactive health management. In contrast, implantable monitors, while emerging and showing promising growth, are utilized primarily for patients requiring constant monitoring due to specific medical conditions. These devices offer a more invasive but comprehensive method of data collection, enabling precise health insights that can significantly improve treatment outcomes. As technology advances, both segments are likely to innovate further, enhancing their applications in patient care.
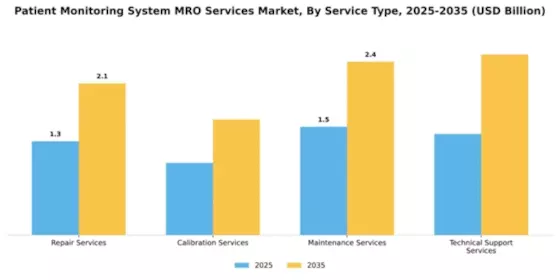
The Patient Monitoring System MRO Services Market consists of several service types, each contributing uniquely to the overall landscape. Repair Services dominate the market, accounting for a significant share due to the high demand for restoring equipment functionality, particularly in critical healthcare settings. In contrast, Calibration Services are becoming increasingly important, catering to the need for ensuring accuracy and compliance in medical devices, thus expanding their market presence.
Repair Services (Dominant) vs. Calibration Services (Emerging)
Repair Services have established themselves as the cornerstone of the Patient Monitoring System MRO Services Market, characterized by their reliability and necessity in maintaining operational efficiency. These services are often preferred due to their immediate impact on device availability and patient safety. On the other hand, Calibration Services emerge as a vital component of this ecosystem, focusing on precise measurement and quality assurance in monitoring devices. As healthcare regulations evolve and technological complexity increases, Calibration Services are gaining recognition for their role in enhancing device performance and patient care outcomes. The contrasting positions of these services highlight a dynamic market poised for growth.
The Patient Monitoring System MRO Services Market is witnessing a dynamic landscape driven by advancements in technology. Among the segment values, Wireless Technology holds the largest market share, reflecting widespread adoption across healthcare facilities. Telemedicine Technology, on the other hand, emerges as the fastest-growing segment, significantly gaining traction due to the increasing demand for remote patient monitoring solutions.
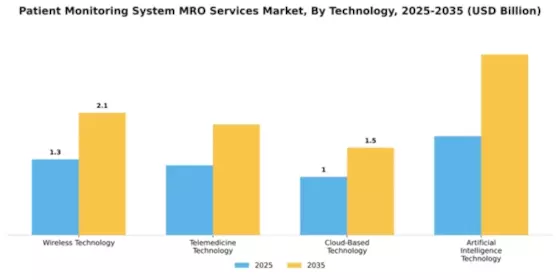
Technology: Wireless (Dominant) vs. Telemedicine (Emerging)
Wireless Technology dominates the Patient Monitoring System MRO Services Market by providing seamless connectivity and real-time data transmission. This technology enhances patient care by enabling continuous monitoring without the constraints of wired systems. In contrast, Telemedicine Technology is rapidly emerging, fueled by the shift towards virtual healthcare services. This growth is characterized by increased investments in telehealth platforms and the growing acceptance of remote consultations, making it a crucial player in enhancing accessibility and efficiency in patient monitoring.
Get more detailed insights about Patient Monitoring System MRO Services Market Request Free Sample
North America is poised to maintain its leadership in the Patient Monitoring System MRO Services Market, holding a significant market share of 2.6 in 2024. The region's growth is driven by advanced healthcare infrastructure, increasing demand for remote patient monitoring, and stringent regulatory standards that ensure high-quality service delivery. The integration of AI and IoT technologies further enhances monitoring capabilities, making healthcare more efficient and responsive. The competitive landscape in North America is robust, featuring key players such as Medtronic, GE Healthcare, and Johnson & Johnson. These companies are investing heavily in R&D to innovate and expand their service offerings. The U.S. remains the largest market, supported by a high prevalence of chronic diseases and a growing aging population. This environment fosters collaboration among healthcare providers and technology firms, ensuring continuous improvement in patient care.
Europe's Patient Monitoring System MRO Services Market is valued at 1.5, reflecting a growing demand for advanced healthcare solutions. The region benefits from supportive regulatory frameworks that encourage innovation and the adoption of new technologies. Increased investments in healthcare infrastructure and a rising focus on patient-centric care are key drivers of market growth. Additionally, the aging population in Europe is propelling the need for effective monitoring solutions, enhancing the overall market landscape. Leading countries in this region include Germany, France, and the UK, where major players like Philips and Siemens Healthineers are actively expanding their market presence. The competitive environment is characterized by strategic partnerships and collaborations aimed at enhancing service delivery. As healthcare systems evolve, the emphasis on integrated monitoring solutions is expected to drive further growth in the coming years.
The Asia-Pacific region, with a market size of 1.0, is rapidly emerging as a key player in the Patient Monitoring System MRO Services Market. The growth is fueled by increasing healthcare expenditure, rising awareness of chronic diseases, and a growing demand for advanced monitoring technologies. Governments are also investing in healthcare infrastructure, which is expected to further enhance service delivery and accessibility across the region. Countries like Japan, China, and India are at the forefront of this growth, with significant contributions from local and international players. Companies such as Nihon Kohden are expanding their footprint, while The Patient Monitoring System MRO Services to capitalize on the burgeoning demand. The competitive landscape is evolving, with a focus on innovation and affordability to cater to diverse patient needs in this dynamic region.
The Middle East and Africa region, with a market size of 0.1, presents untapped potential in the Patient Monitoring System MRO Services Market. The growth is driven by increasing investments in healthcare infrastructure and a rising prevalence of chronic diseases. Governments are prioritizing healthcare reforms, which are expected to enhance service delivery and improve patient outcomes. The demand for advanced monitoring solutions is gradually increasing, supported by a growing awareness of healthcare quality. Leading countries in this region include South Africa and the UAE, where healthcare systems are evolving to meet modern demands. The competitive landscape is characterized by a mix of local and international players, with companies exploring partnerships to enhance their service offerings. As the region continues to develop, the focus on patient monitoring solutions is expected to grow, paving the way for future opportunities.
The Patient Monitoring System MRO Services Market is characterized by a dynamic competitive landscape, driven by technological advancements and an increasing demand for efficient healthcare solutions. Key players such as Medtronic (US), Philips (NL), and GE Healthcare (US) are at the forefront, each adopting distinct strategies to enhance their market presence. Medtronic (US) focuses on innovation through the development of advanced monitoring technologies, while Philips (NL) emphasizes partnerships to expand its service offerings. GE Healthcare (US) is leveraging digital transformation to optimize its operations, collectively shaping a competitive environment that is increasingly reliant on technological integration and strategic collaborations.In terms of business tactics, companies are localizing manufacturing and optimizing supply chains to enhance operational efficiency. The market appears moderately fragmented, with several key players exerting considerable influence. This structure allows for a diverse range of services and products, fostering competition that drives innovation and improves service delivery across the sector.In November Siemens Healthineers (DE) announced a strategic partnership with a leading telehealth provider to enhance remote patient monitoring capabilities. This collaboration is likely to bolster Siemens' position in the market by integrating advanced telehealth solutions with its existing monitoring systems, thereby addressing the growing demand for remote healthcare services. Such strategic moves indicate a shift towards more integrated healthcare solutions, aligning with current market trends.In October Johnson & Johnson (US) launched a new line of wearable monitoring devices aimed at chronic disease management. This initiative not only reflects the company's commitment to innovation but also positions it to capture a larger share of the growing market for personalized healthcare solutions. The introduction of these devices is expected to enhance patient engagement and improve health outcomes, further solidifying Johnson & Johnson's competitive edge.In September Abbott Laboratories (US) expanded its service portfolio by acquiring a digital health startup specializing in AI-driven analytics for patient monitoring. This acquisition is anticipated to enhance Abbott's capabilities in data analytics, allowing for more precise monitoring and timely interventions. The integration of AI into patient monitoring systems is a critical trend, as it enables healthcare providers to make data-driven decisions, ultimately improving patient care.As of December the competitive trends in the Patient Monitoring System MRO Services Market are increasingly defined by digitalization, sustainability, and AI integration. Strategic alliances are becoming pivotal in shaping the landscape, as companies seek to combine their strengths to deliver comprehensive solutions. Looking ahead, competitive differentiation is likely to evolve from traditional price-based competition to a focus on innovation, technology, and supply chain reliability, underscoring the importance of adaptability in a rapidly changing market.



The Patient Monitoring System MRO Services Market is projected to grow at a 4.68% CAGR from 2025 to 2035, driven by technological advancements, increasing healthcare demands, and regulatory support.
New opportunities lie in:
By 2035, the market is expected to achieve robust growth, reflecting evolving healthcare needs and technological integration.
| MARKET SIZE 2024 | 5.2(USD Billion) |
| MARKET SIZE 2025 | 5.44(USD Billion) |
| MARKET SIZE 2035 | 8.6(USD Billion) |
| COMPOUND ANNUAL GROWTH RATE (CAGR) | 4.68% (2025 - 2035) |
| REPORT COVERAGE | Revenue Forecast, Competitive Landscape, Growth Factors, and Trends |
| BASE YEAR | 2024 |
| Market Forecast Period | 2025 - 2035 |
| Historical Data | 2019 - 2024 |
| Market Forecast Units | USD Billion |
| Key Companies Profiled | Medtronic (US), Philips (NL), GE Healthcare (US), Siemens Healthineers (DE), Johnson & Johnson (US), Abbott Laboratories (US), Baxter International (US), Boston Scientific (US), Nihon Kohden (JP) |
| Segments Covered | Application, End Use, Device Type, Service Type, Technology |
| Key Market Opportunities | Integration of advanced analytics and artificial intelligence in Patient Monitoring System MRO Services Market. |
| Key Market Dynamics | Rising demand for advanced Patient Monitoring System Maintenance, Repair, and Overhaul services driven by technological advancements and regulatory compliance. |
| Countries Covered | North America, Europe, APAC, South America, MEA |
The market is projected to reach a valuation of 8.6 USD Billion by 2035.
In 2024, the market valuation was 5.2 USD Billion.
The expected CAGR for the market during the forecast period is 4.68%.
The Artificial Intelligence Technology segment is projected to grow significantly, reaching 3.1 USD Billion by 2035.
Key players include Medtronic, Philips, GE Healthcare, Siemens Healthineers, and Johnson & Johnson.
By 2035, the market for wearable monitors is expected to reach 2.1 USD Billion, while stationary monitors may reach 2.4 USD Billion.
Cardiac monitoring services are projected to grow to 2.4 USD Billion by 2035.
The Hospitals segment is expected to have the highest valuation, reaching 3.36 USD Billion by 2035.
Maintenance services are anticipated to reach a market size of 2.4 USD Billion by 2035.
By 2035, telemedicine technology is projected to reach 1.9 USD Billion, while cloud-based technology may reach 1.5 USD Billion.


Kindly complete the form below to receive a free sample of this Report

“This is really good guys. Excellent work on a tight deadline. I will continue to use you going forward and recommend you to others. Nice job”


“Thanks. It’s been a pleasure working with you, please use me as reference with any other Intel employees.”


“Thanks for sending the report it gives us a good global view of the Betaïne market.”


“Thank you, this will be very helpful for OQS.”


“We found the report very insightful! we found your research firm very helpful. I'm sending this email to secure our future business.”


“I am very pleased with how market segments have been defined in a relevant way for my purposes (such as "Portable Freezers & refrigerators" and "last-mile"). In general the report is well structured. Thanks very much for your efforts.”


“I have been reading the first document or the study, ,the Global HVAC and FP market report 2021 till 2026. Must say, good info! I have not gone in depth at all parts, but got a good indication of the data inside!”


“We got the report in time, we really thank you for your support in this process. I also thank to all of your team as they did a great job.”


“The Automotive 48V ECU Components Procurement Intelligence Study” was a complex project, but the Market Research Future (MRFR) team handled it with quality, agility, and customer-centricity. They delivered all requested data on time and within the agreed scope. The team, including Shubhendra Anand and Rahul Gotadki, was always readily available to clarify questions and swiftly implement necessary adjustments, driving the project to a successful conclusion within a very demanding timeframe.
I would also like to specifically commend Akshay Agarwal for his responsiveness and support at every stage—from our initial inquiry on May 6th through to final delivery on June 18th. His dedication made the entire process seamless.”



