Pharmaceutical Cartridges Market

Key Players: SCHOTT AG, Gerresheimer AG, Stevanato Group, Nipro Corporation, West Pharmaceutical Services, Becton Dickinson (BD), SGD Pharma, Corning Incorporated

Pharmaceutical Cartridges Market

Pharmaceutical Cartridges Market Research Report Information By Material (Glass and Plastic), By Capacity (Below 5 ml, 5-50 ml, 51-250 ml, and Above 250 ml), And By Region (North America, Europe, Asia-Pacific, And Rest Of The World) –Market Forecast Till 2035
ID: MRFR/Pharma/10159-HCR
128 Pages
Rahul Gotadki, Snehal Singh
Last Updated: June 22, 2026

Pharmaceutical Cartridges Market Summary

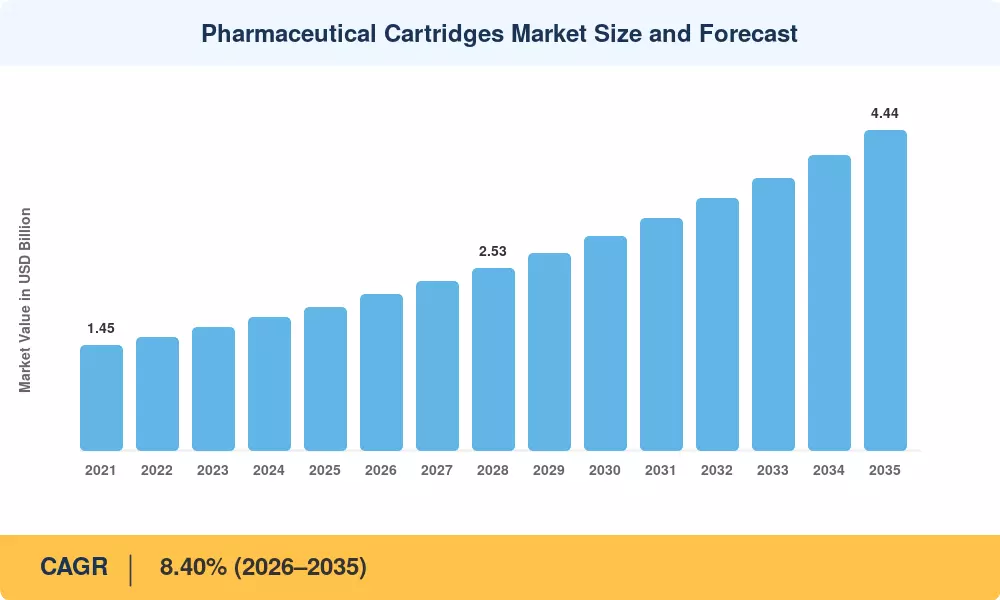
The Global Pharmaceutical Cartridges Market size was valued at USD 1.99 Billion in 2025, and the market is projected to grow from USD 2.15 Billion in 2026 to USD 4.44 Billion by 2035, registering a CAGR of 8.40% during the forecast period 2026–2035. This trajectory is propelled by the rapid migration of biologic therapies into self-administration formats and by the European Union's revised Annex 1 sterility guidelines, which are pushing fill-finish operations toward ready-to-use cartridge configurations that eliminate costly depyrogenation steps [2]. Multibillion-dollar capacity investments announced by leading glass and polymer suppliers in 2024–2025 have further reinforced confidence in the Pharmaceutical Cartridges Market outlook.

A structural technology shift is reshaping this space. Legacy bulk-washed glass cartridges are giving way to pre-sterilized, ready-to-use formats—supported by AI-driven fill-finish automation that has reduced glass breakage rates by up to 40% and halved false rejection rates on inspection lines [3]. Engineering plastics based on cyclic olefin copolymer (COC) and cyclic olefin polymer (COP) are gaining traction for their superior break resistance and chemical inertness, though Type I borosilicate glass still commands the majority of volume across the Pharmaceutical Cartridges Market.

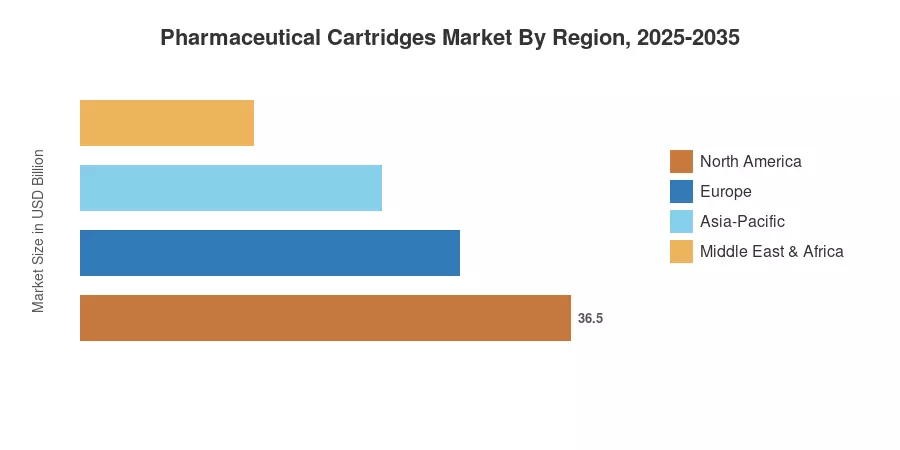
Regionally, North America maintained the largest share of the Pharmaceutical Cartridges Market at approximately 40.9% of global revenue in 2025, anchored by a dense network of contract fill-finish facilities and robust biosimilar uptake [4]. Asia-Pacific is emerging as the fastest-growing region with a projected CAGR of 10.5% through 2035, driven by expanding insulin pen programs in China and India. Europe, the second-largest region, continues to benefit from stringent EU GMP regulations that incentivize high-quality cartridge adoption.


Key Report Takeaways

• By Material

  • Glass (Type I borosilicate) accounted for roughly 67.8% of the Pharmaceutical Cartridges Market in 2025, reflecting its dominance across insulin and biologic delivery platforms.
  • Engineering plastics (COC/COP) are forecast to expand at a 12.5% CAGR during 2026–2035, the fastest pace among material segments.

• By Delivery Device Compatibility

  • Reusable pen injectors held approximately 46.6% revenue share of the Pharmaceutical Cartridges Market in 2025.
  • Wearable on-body delivery pumps are projected to grow at an 11.8% CAGR through 2035, outpacing all other device categories.

• By Therapeutic Area

  • Diabetes represented the leading therapeutic segment with a 25.8% share of the Pharmaceutical Cartridges Market in 2025.
  • Oncology cartridge demand is anticipated to rise at a 13.1% CAGR as antibody-drug conjugates shift to cartridge-based delivery.

• By Region

  • North America captured 40.9% of the Pharmaceutical Cartridges Market in 2025, driven by large-scale fill-finish expansions.
  • Asia-Pacific is poised to register the highest regional CAGR of 10.5% during 2026–2035.


Pharmaceutical Cartridges Market Size and Forecast (2021–2035)

Market Research Future derived the historical market size using a combination of bottom-up revenue modeling across cartridge manufacturers, validated against top-down pharmaceutical packaging benchmarks from WHO, IQVIA, and trade association databases. Forecast projections apply the calibrated 8.40% CAGR for 2026–2035 with adjustments for regulatory adoption curves and capacity ramp-ups[5].

Pharmaceutical Cartridges Market Size and Forecast
Our Impact
Enabled $4.3B Revenue Impact for Fortune 500 and Leading Multinationals
Partnering with 2000+ Global Organizations Each Year
30K+ Citations by Top-Tier Firms in the Industry

Driver Impact Analysis

Driver ~% Impact on CAGR Geographic Relevance Impact Timeline
Self-administered biologic therapies expansion ~22% Global Medium-term (2–4 yr)
EU Annex 1 RTU cartridge mandates ~18% Europe, Global Short-term (≤2 yr)
GLP-1 receptor agonist volume growth ~16% North America, Europe Short-term (≤2 yr)
AI-driven fill-finish automation ~14% North America, Asia-Pacific Medium-term (2–4 yr)
Engineering plastics adoption (COC/COP) ~12% Global Long-term (≥4 yr)
Large-volume subcutaneous delivery expansion ~10% Global Long-term (≥4 yr)
Emerging-market insulin pen programs ~8% Asia-Pacific, South America Long-term (≥4 yr)


Self-Administered Biologic Therapies

One significant driver of demand for the pharmaceutical cartridges market is the continuous transition from hospital-based infusion to subcutaneous injection at home. Clinical demand for reliable cartridge delivery methods is growing as original biological licensing applications (BLAs) account for a greater portion of FDA approvals each year (representing 32% of innovative drug entry in 2024) and lifetime extensions increasingly emphasize decentralized care. By 2028, more than 35% of all biologics will be given by prefilled cartridge-based devices, according to the sources [6]. In order to meet strict combination product criteria, this trend forces device manufacturers to invest in tighter dimensional tolerances and optimize cartridge procurement processes.


EU Annex 1 Sterility Regulations

The European Commission's revised Annex 1, effective August 2023 with full enforcement by 2025, has raised contamination control expectations to a level that makes traditional bulk-washed cartridges increasingly uneconomical [2]. RTU cartridge formats—pre-washed, depyrogenated, and nested—eliminate three to four process steps, cutting contamination risk and capital expenditure simultaneously. Industry estimates suggest the switch to RTU formats saves contract manufacturers approximately EUR 1.2 million per filling line annually [2][12].

GLP-1 Receptor Agonist Volume Growth

Global GLP-1 therapy revenue surpassed USD 50 billion in 2024, and the resulting cartridge demand has created supply bottlenecks across the Pharmaceutical Cartridges Market [11]. Novo Nordisk and Eli Lilly together consumed an estimated 3.8 billion cartridge units in 2024, and both companies have committed to multi-year supply agreements with Tier-1 cartridge producers. The weight-management indication expansion for semaglutide and tirzepatide will only amplify this demand trajectory through 2030.

AI-Driven Fill-Finish Automation

Machine-vision inspection systems powered by deep-learning algorithms have reduced false rejection rates from approximately 5% to under 2.5% in high-speed cartridge filling lines [3]. SCHOTT and Stevanato Group both disclosed AI-integration timelines during 2024 investor calls, targeting full-scale deployment across their cartridge filling networks by 2027. The productivity gains directly improve unit economics and support the price-competitive positioning of glass cartridges against polymer alternatives.


Restraints Impact Analysis

Restraint impact percentages represent estimated drag effects on the Pharmaceutical Cartridges Market growth rate and are not directly subtractable from the headline CAGR.

Restraint ~% Drag on CAGR Geographic Relevance Impact Timeline
Glass supply chain fragility and breakage ~−20% Global Short-term (≤2 yr)
High capital cost of RTU filling line conversion ~−18% Europe, North America Medium-term (2–4 yr)
Regulatory divergence across markets ~−15% Asia-Pacific, South America Long-term (≥4 yr)
Extractable/leachable concerns with polymer cartridges ~−12% Global Medium-term (2–4 yr)
Skilled workforce shortages in aseptic manufacturing ~−10% Global Long-term (≥4 yr)


Glass Supply Chain Fragility

The open merchant market for pharmaceutical-grade glass tube production is anchored by SCHOTT, Corning, and Nippon Electric Glass (NEG), three major worldwide suppliers of type I borosilicate glass tubing [13]. The downstream pharmaceutical cartridges market is rapidly impacted by supply interruptions, such as the regional energy and natural gas price surges in Europe during 2022–2023. In contrast to sophisticated polymer alternatives, glass breakage during transit and mechanical processing continues to result in yield losses of 2-4% on average, increasing structural cost pressures.


Capital Intensity of RTU Line Conversion

While RTU cartridges deliver long-run savings, the initial investment for a single RTU-capable filling line ranges between USD 15 million and USD 25 million [12]. Small and mid-sized contract manufacturers—particularly those in South America and Southeast Asia—find this barrier steep enough to delay adoption by three to five years. This capital hurdle fragments the Pharmaceutical Cartridges Market into RTU-ready and legacy tiers with differing cost structures.


Pharmaceutical Cartridges Market Opportunities

Wearable On-Body Delivery Devices

The rise of high-viscosity biologics requiring large-volume subcutaneous delivery (≥3 mL) is creating a fast-emerging opportunity for cartridge formats designed to interface with wearable on-body pumps [8]. These devices bypass the volumetric limitations of standard pen injectors and offer patient-friendly dosing that aligns with the Pharmaceutical Cartridges Market shift toward home-based care.

Emerging-Market Insulin Access Programs

Government-funded insulin pen distribution programs in India, China, Indonesia, and Brazil represent a significant volume opportunity for the Pharmaceutical Cartridges Market [10]. India's Pradhan Mantri Jan Arogya Yojana program is projected to cover 150 million additional diabetes patients by 2030, creating demand for low-cost cartridge configurations that engineering plastics suppliers are well positioned to serve.

Oncology Antibody-Drug Conjugate Migration

The migration of specific antibody-drug conjugates (ADCs) from conventional IV infusion to subcutaneous delivery is being investigated by longer-term growth pipelines. This move would add a very sophisticated, premium therapeutic subsegment to the pharmaceutical cartridges market [11]. Advanced container-interaction testing is being made possible by successful early-stage human trials of co-formulated subcutaneous ADCs, but the majority of current clinical trials remain focused on traditional lyophilized IV paths due to technical challenges related to structural stability and local tissue toxicity. By the end of the decade, there will be a greater need for specialized, low-leachable cartridge systems if these liquid formulations show bioequivalency and safety.


Data-Enabled Smart Cartridge Platforms

Connected cartridges embedded with NFC chips and temperature-monitoring sensors offer pharmaceutical companies a new data monetization channel. Real-world adherence data captured through smart cartridge platforms can improve clinical outcomes while generating licensing revenue streams—an opportunity valued at an estimated USD 800 million globally by 2032 [16].

Contract Manufacturing Capacity Expansion

CMOs and CDMOs are the fastest-growing end-user segment of the Pharmaceutical Cartridges Market, creating an opportunity for cartridge suppliers to secure multi-year take-or-pay supply agreements. As pharma companies increasingly outsource fill-finish operations, cartridge vendors that embed quality agreements into long-term contracts will capture share from spot-market competitors.


Pharmaceutical Cartridges Market Future Outlook

AI-Integrated Manufacturing and Digital Twins

Artificial intelligence will fundamentally reshape cartridge production economics over the next decade. Digital-twin simulations of glass-forming processes are expected to cut development cycles by 30%, while predictive maintenance algorithms can reduce unplanned downtime on high-speed filling lines by an estimated 25% by 2030 [3][16]. The Pharmaceutical Cartridges Market will increasingly favor suppliers that can offer AI-auditable production data to regulators.

Platform Standardization and Interoperability

The ISO 11040 cartridge standard revision expected in 2027 will introduce tighter dimensional tolerances aimed at improving cross-platform interoperability between cartridge suppliers and device manufacturers [17]. Standardization lowers switching costs, intensifies price competition, and ultimately benefits buyers across the Pharmaceutical Cartridges Market by compressing procurement lead times and reducing qualification expenses.

Sustainability and Circular Packaging

The market for pharmaceutical cartridges is being affected by environmental factors more quickly than many had predicted. COC cartridges produce 35% fewer carbon emissions per unit during production than borosilicate glass, according to life-cycle studies released by the Parenteral Drug Association [18]. At least three significant pharmaceutical companies have pledged to use only recyclable or reusable primary packaging by 2035, and reusable pen platforms further reduce per-dose waste.


Cell and Gene Therapy Cartridge Formats

Advanced therapy medicinal products—including CAR-T cell therapies and mRNA-based treatments—are beginning to explore cartridge-based delivery for point-of-care reconstitution and administration [19]. While still nascent, this segment could represent a meaningful incremental opportunity for the Pharmaceutical Cartridges Market by the early 2030s, with the WHO projecting over 50 approved cell and gene therapies globally by 2033.


Pharmaceutical Cartridges Market Segmentation

By Material

Segment Key Metric Primary Demand Driver
Glass (Type I Borosilicate and others) 67.8% share (2025) Established regulatory acceptance; insulin dominance [13]
Engineering Plastics (COC/COP and others) 12.5% CAGR (2026–2035) Break resistance; lightweight logistics [7]
Others USD 0.06 Billion (2025) Specialty coatings and hybrid materials [17]


Glass remains the backbone of the Pharmaceutical Cartridges Market due to decades of regulatory acceptance and unmatched chemical inertness for sensitive biologic formulations. Type I borosilicate tubing from SCHOTT and Nipro sets the dimensional benchmark that device manufacturers design around, creating significant switching inertia [13]. Engineering plastics, led by COC and COP resins from TOPAS and Zeon, are gaining ground in applications where breakage risk during shipping and patient handling is a critical concern—particularly wearable on-body devices and pediatric delivery systems [7].

By Delivery Device Compatibility

Segment Key Metric Primary Demand Driver
Reusable Pen Injectors 46.6% share (2025) Insulin pen installed base [11]
Autoinjectors 8.6% CAGR (2026–2035) Biologic self-administration growth [6]
Wearable On-Body Pumps 11.8% CAGR (2026–2035) Large-volume biologic delivery [8]
Disposable Pen Injectors USD 0.31 Billion (2025) Cost-sensitive emerging markets [10]


Reusable pen injectors dominate the Pharmaceutical Cartridges Market because the global installed base of insulin pens exceeds 500 million devices, each requiring regular cartridge replacement [11]. Wearable on-body pumps, while small today, represent the most disruptive growth vector—these devices accommodate cartridge volumes above 10 mL and are critical for high-viscosity monoclonal antibody and GLP-1 formulations that cannot be delivered through standard 3 mL cartridges [8].

By Capacity

Segment Key Metric Primary Demand Driver
Below 3 mL 43.8% share (2025) Standard insulin and biologic dosing [11]
3 mL–5 mL USD 0.47 Billion (2025) Mid-volume biologic therapies [6]
5 mL–10 mL 9.2% CAGR (2026–2035) GLP-1 dose-volume increase [11]
Above 10 mL 10.6% CAGR (2026–2035) On-body pump and large-volume delivery [8]


By Therapeutic Area

Segment Key Metric Primary Demand Driver
Diabetes 25.8% share (2025) Global insulin cartridge demand [11]
Oncology 13.1% CAGR (2026–2035) ADC subcutaneous migration [11]
Autoimmune Diseases USD 0.28 Billion (2025) TNF-inhibitor and IL-inhibitor pens [6]
Ophthalmology 9.8% CAGR (2026–2035) Intravitreal cartridge-device approvals [8]
Others USD 0.24 Billion (2025) Rare diseases, hormonal therapies [9]


By End User

Segment Key Metric Primary Demand Driver
Pharmaceutical Companies 63.2% share (2025) In-house fill-finish operations [4]
CMOs/CDMOs 12.1% CAGR (2026–2035) Outsourced biologic fill-finish surge [12]
Research Institutions USD 0.05 Billion (2025) Clinical trial cartridge supply [9]


Pharmaceutical companies control the largest share of the Pharmaceutical Cartridges Market because global majors—Novo Nordisk, Sanofi, Eli Lilly—operate proprietary fill-finish networks that consume billions of cartridges annually [4]. CMOs and CDMOs, however, are growing at double the market average as mid-sized biopharma firms increasingly outsource cartridge filling to specialist operators equipped with RTU-ready lines [12].


Regional Market Share Analysis

Region Key Metric Primary Investment Themes
North America 40.9% share (2025) Biologic fill-finish expansion; GLP-1 supply chains [4]
Europe USD 0.56 Billion (2025) EU Annex 1 compliance; RTU format adoption [2]
Asia-Pacific 10.5% CAGR (2026–2035) Insulin pen programs; domestic manufacturing build-out [10]
South America USD 0.12 Billion (2025) Public health insulin access; CDMO emergence [14]
Middle East & Africa 7.2% CAGR (2026–2035) Healthcare infrastructure investment; diabetes care programs [15]
Total USD 1.99 Billion (2025)

The Pharmaceutical Cartridges Market exhibits a concentrated regional structure, with North America and Europe jointly accounting for nearly 69% of global revenue. Growth momentum, however, is shifting toward Asia-Pacific and select emerging economies that are scaling up domestic cartridge production capacity [4].


North America

Country Key Metric Key Driver
United States 82.4% of regional revenue FDA combination product approvals; GLP-1 capacity [4]
Canada 8.8% CAGR (2026–2035) Biosimilar cartridge uptake [9]
Mexico USD 0.03 Billion (2025) Nearshoring of fill-finish operations [14]


The United States dominates the North American Pharmaceutical Cartridges Market, supported by an ecosystem of more than 40 FDA-registered cartridge filling sites and the world's highest per-capita spend on injectable biologics. Eli Lilly's USD 3.7 billion manufacturing campus in Lebanon, Indiana, announced in 2024, will incorporate dedicated cartridge filling capacity slated for commissioning in 2027 [4][12].

Europe

Country Key Metric Key Driver
Germany 28.5% of regional revenue SCHOTT and Gerresheimer HQ operations [13]
United Kingdom 7.8% CAGR (2026–2035) NHS biosimilar switching programs [9]
France USD 0.08 Billion (2025) Sanofi insulin cartridge volumes [11]
Italy 7.4% CAGR (2026–2035) Stevanato Group expansion [12]
Spain USD 0.04 Billion (2025) Generic injectable growth [14]
Nordic Countries 7.6% CAGR (2026–2035) Novo Nordisk supply chain proximity [11]
Russia USD 0.02 Billion (2025) Domestic insulin self-sufficiency programs [15]
Rest of Europe 6.9% CAGR (2026–2035) Regional CDMO capacity additions [12]


Europe's Pharmaceutical Cartridges Market is shaped by regulatory rigor and the headquarters presence of two of the world's largest cartridge glass manufacturers—SCHOTT and Gerresheimer—in Germany. The EU Annex 1 timeline has triggered a measurable acceleration in RTU format procurement, with industry surveys indicating that 62% of European fill-finish sites plan to operate fully RTU cartridge lines by 2028 [2].

Asia-Pacific

Country Key Metric Key Driver
China 34.2% of regional revenue National insulin pen promotion; domestic glass production [10]
India 11.2% CAGR (2026–2035) Government diabetes care expansion [10]
Japan USD 0.06 Billion (2025) Aging population; biologic uptake [6]
South Korea 10.8% CAGR (2026–2035) Biosimilar export cartridge demand [9]
ASEAN USD 0.03 Billion (2025) Healthcare infrastructure scale-up [15]
Rest of Asia-Pacific 9.4% CAGR (2026–2035) Emerging biologic manufacturing hubs [14]


Asia-Pacific represents the highest-growth frontier for the Pharmaceutical Cartridges Market. China's National Healthcare Security Administration included insulin pens in its volume-based procurement program starting in 2024, and early data suggest this single policy action could add 600 million cartridge units annually to domestic demand by 2028 [10].

South America

Country Key Metric Key Driver
Brazil 58.3% of regional revenue SUS public health insulin distribution [10]
Argentina 7.6% CAGR (2026–2035) Local cartridge assembly initiatives [14]
Rest of South America USD 0.02 Billion (2025) Basic healthcare cartridge import growth [15]


Brazil's unified public health system (SUS) is the primary demand engine for the South American Pharmaceutical Cartridges Market, purchasing insulin pen cartridges at scale for its 16 million registered diabetes patients. Recent tenders have specified RTU cartridge requirements for the first time, signaling quality convergence with North American and European standards [14].

Middle East & Africa

Country Key Metric Key Driver
Saudi Arabia 32.1% of regional revenue Vision 2030 pharma localization [15]
UAE 8.1% CAGR (2026–2035) Free-zone fill-finish hubs [12]
South Africa USD 0.02 Billion (2025) HIV biologic cartridge pilots [6]
Egypt 7.0% CAGR (2026–2035) Insulin self-sufficiency targets [10]
Rest of MEA USD 0.02 Billion (2025) Donor-funded vaccine cartridge procurement [15]


Saudi Arabia's Vision 2030 pharmaceutical localization mandate requires that 40% of drug packaging components—including cartridges—be sourced domestically by 2030 [15]. This policy is attracting joint-venture investments from SCHOTT and Gerresheimer into the Kingdom and positions the region for steady share gains within the global Pharmaceutical Cartridges Market.


Pharmaceutical Cartridges Market By Region, 2025-2035

Competitive Benchmarking

The Pharmaceutical Cartridges Market exhibits a medium level of concentration, with the top five companies collectively holding an estimated 48–55% revenue share. The Herfindahl-Hirschman Index (HHI) for this market is estimated in the 1,200–1,500 range, indicating moderate concentration where established glass manufacturers maintain scale advantages while polymer entrants and regional players add competitive intensity[13].

Company Est. Revenue Share Range Key Offerings for Pharmaceutical Cartridges Market Strategic Positioning
SCHOTT AG ~12–16% Type I glass cartridges; SCHOTT iQ RTU platform Global leader in pharma glass tubing and RTU cartridges
Gerresheimer AG ~10–14% Glass and COP cartridges; Gx RTF cartridge systems Integrated glass-to-device solutions
Stevanato Group ~8–12% EZ-fill cartridge platforms; integrated assembly Vertically integrated from glass to device
Nipro Corporation ~6–9% Type I glass cartridges; polymer syringes Asian-market scale; cost leadership
West Pharmaceutical Services ~5–8% Cartridge closure systems; NovaPure components Elastomer and closure system specialization
Becton Dickinson (BD) ~4–7% BD Rondo cartridge recapping systems; pen needles Device-cartridge interface integration
SGD Pharma ~3–6% Molded glass cartridges; Type I tubular glass European and Asian production network
Corning Incorporated ~3–5% Valor Glass cartridges; aluminosilicate technology Next-gen glass chemistry leadership
Terumo Corporation ~2–4% PLAJEX polymer cartridges; COP containers Polymer cartridge pioneer for biologics
Baxter International ~2–4% RTU cartridge components; sterile fill services Integrated pharma services positioning


Recent News & Developments

  • SCHOTT AG (November 2024): Opened a USD 400 million cartridge production facility in Müllheim, Germany, expanding RTU cartridge output by 2.5 billion units annually [12].
  • Stevanato Group (September 2024): Announced a USD 500 million greenfield plant in Fishers, Indiana (USA), dedicated to high-speed cartridge filling lines for GLP-1 therapies, with commissioning planned for Q3 2026 [4].
  • European Commission (August 2024): Confirmed full enforcement of revised Annex 1 GMP guidelines, accelerating RTU cartridge demand across the Pharmaceutical Cartridges Market [2].


  • Nipro Corporation (March 2024): Expanded COP cartridge production capacity at its Tianjin, China, plant by 40%, targeting domestic insulin pen programs [10].
  • Corning Incorporated (January 2024): Received FDA Drug Master File acceptance for Valor Glass cartridge formats, enabling broader adoption in biologic combination products [17].
  • West Pharmaceutical Services (October 2023): Launched NovaPure 2.0 cartridge plunger system designed to reduce particulate contamination by 50% compared to standard elastomer closures [13].
  • Eli Lilly (July 2023): Committed USD 3.7 billion to a new manufacturing campus in Lebanon, Indiana, including dedicated cartridge-based injectable filling capacity [4].


Pharmaceutical Cartridges Market Report Scope

Parameter Detail
Market Scope Global Pharmaceutical Cartridges Market — cartridges for injectable drug delivery devices
Study Period 2021–2035
CAGR 8.40% (2026–2035)
Base Year Market Size USD 1.99 Billion (2025)
Forecast Endpoint USD 4.44 Billion (2035)
Fastest Growing Segments Engineering Plastics (Material); Oncology (Therapeutic Area); CMOs/CDMOs (End User)
Companies Profiled SCHOTT AG, Gerresheimer AG, Stevanato Group, Nipro Corp., West Pharmaceutical Services, BD, SGD Pharma, Corning Inc., Terumo Corp., Baxter International
Valuation Currency USD Billion


FAQs

How does the extractable and leachable profile of COC cartridges compare to that of Type I glass for sensitive biologics?

COC cartridges exhibit lower extractable levels than borosilicate glass, particularly for metal ions and silicone oil. Regulatory agencies accept COC for most biologic formulations when supported by container-closure interaction studies [7].

What fill-speed limitations should buyers consider when switching from glass to polymer cartridges?

Polymer cartridges typically run 10–15% slower on legacy glass filling lines due to different thermal and friction properties. Dedicated polymer-optimized lines eliminate this gap entirely [7].

How do RTU cartridge formats affect the total cost of ownership versus bulk-washed alternatives?

RTU cartridges carry a 20–30% higher unit price but reduce facility capital, water, and energy costs by approximately EUR 1.2 million per line annually [2][12].

What qualification timeline should CDMOs expect when onboarding a new cartridge supplier?

Typical supplier qualification takes 12–18 months, covering dimensional verification, extractable studies, and stability testing under ICH guidelines [15].

Are dual-chamber cartridges gaining traction for lyophilized biologic reconstitution?

Yes — dual-chamber cartridges are growing in demand for lyophilized ADCs and vaccines requiring point-of-care reconstitution. At least four new dual-chamber device platforms entered development in 2024 [8].

How does cartridge dimensional tolerance affect device-level combination product regulatory filings?

Tighter ISO 11040 tolerances reduce device performance variability, simplifying human-factors studies required for FDA and EMA combination product approvals [17].

What role do secondary packaging innovations play in reducing cartridge breakage during cold-chain logistics?

Advanced nest-and-tub secondary packaging has cut transit breakage from 3–4% to below 0.5%, delivering measurable savings for temperature-sensitive biologic shipments [13].    
Author
Author
Author Profile
Rahul Gotadki LinkedIn
Research Manager
He holds an experience of about 9+ years in Market Research and Business Consulting, working under the spectrum of Life Sciences and Healthcare domains. Rahul conceptualizes and implements a scalable business strategy and provides strategic leadership to the clients. His expertise lies in market estimation, competitive intelligence, pipeline analysis, customer assessment, etc.
Co-Author
Co-Author Profile
Snehal Singh LinkedIn
Manager - Research
High acumen in analyzing complex macro & micro markets with more than 6 years of work experience in the field of market research. By implementing her analytical skills in forecasting and estimation into market research reports, she has expertise in Packaging, Construction, and Equipment domains. She handles a team size of 20-25 resources and ensures smooth running of the projects, associated marketing activities, and client servicing.

Research Approach


Secondary Research

The secondary research process involved comprehensive analysis of pharmaceutical packaging regulations, drug delivery system publications, medical device databases, and authoritative healthcare organizations. Key sources included the US Food & Drug Administration (FDA), European Medicines Agency (EMA), International Organization for Standardization (ISO 13926 standards for pen-injectors), International Society for Pharmaceutical Engineering (ISPE), Parenteral Drug Association (PDA), European Directorate for the Quality of Medicines & HealthCare (EDQM), United States Pharmacopeia (USP), National Institutes of Health (NIH) Clinical Trials Database, National Center for Biotechnology Information (NCBI/PubMed), World Health Organization (WHO) Prequalification Programme, International Conference on Harmonisation (ICH) guidelines, US Census Bureau Trade Data (pharmaceutical glass/plastic imports), Eurostat Pharmaceutical Production Statistics, China National Medical Products Administration (NMPA), Japan Ministry of Health Labour and Welfare (MHLW) medical device database, and national pharmaceutical manufacturing reports from key markets. These sources were used to collect drug approval data, regulatory standards for primary packaging, biologics market trends, glass and plastic material specifications, production volume statistics, and competitive landscape analysis for prefilled syringes, pen-injectors, and other cartridge-based delivery systems.


Primary Research

In order to gather both qualitative and quantitative insights, supply-side and demand-side stakeholders were interviewed during the primary research process. CEOs, VPs of Manufacturing Operations, heads of quality assurance, R&D directors, and commercial leaders from glass tubing suppliers, pharmaceutical cartridge makers, and pharmaceutical packaging OEMs were among the supply-side sources. Demand-side sources included supply chain directors from large pharmaceutical manufacturers, regulatory affairs managers from pharmaceutical businesses, drug delivery device engineers, procurement heads from biopharmaceutical companies, and packaging development scientists. Primary research obtained information on material adoption trends, barrier property requirements, regulatory compliance strategies, and pricing dynamics for biologics vs. small molecule applications. It also verified manufacturing capacity expansion timelines and validated market segmentation across glass vs. plastic materials and capacity ranges.

Primary Respondent Breakdown:

By Designation: C-level Primaries (32%), Director Level (31%), Others (37%)

By Region: North America (38%), Europe (30%), Asia-Pacific (25%), Rest of World (7%)


Market Size Estimation

Global market valuation was derived through revenue mapping and production volume analysis. The methodology included:

Identification of 40+ key manufacturers across North America, Europe, Asia-Pacific, and Latin America specializing in glass and plastic pharmaceutical cartridges

Product mapping across glass cartridges (Type I borosilicate, Type III soda-lime), plastic cartridges (COP, COC, polypropylene), and capacity segments (below 5 ml, 5-50 ml, 51-250 ml, above 250 ml)

Analysis of reported and modeled annual revenues specific to pharmaceutical cartridge portfolios, including primary packaging for insulin pens, growth hormone delivery, and GLP-1 agonists

Coverage of manufacturers representing 75-80% of global market share in 2024

Extrapolation using bottom-up (pharmaceutical production volume × cartridge requirement by drug category × ASP by material type) and top-down (manufacturer revenue validation across glass tubing suppliers and finished cartridge producers) approaches to derive segment-specific valuations for biologics, vaccines, and small molecule injectables

Download Free Sample

Kindly complete the form below to receive a free sample of this Report

Download PDF ×

We do not share your information with anyone. However, we may send you emails based on your report interest from time to time. You may contact us at any time to opt-out.