Pharmaceutical Excipients Market (2026 - 2035)

Pharmaceutical Excipients Market Research Report: Size, Share, Trend Analysis By Functionality (Binders, Diluents, Disintegrants, Lubricants, Coatings), By Types (Organic Excipients, Inorganic Excipients, Natural Excipients, Synthetic Excipients), By Formulation Type (Solid Formulations, Liquid Formulations, Semi-Solid Formulations, Novel Drug Delivery Systems), By End Use (Pharmaceutical Companies, Contract Manufacturing Organizations, Research Institutions) and By Regional (North America, Europe, South America, Asia Pacific, Middle East and Africa) - Growth Outlook & Industry - Forecast Till 2035

Forecast Period
2026-2035
CAGR
8.1%
2025 Market Size
USD 11.47 Billion
2035 Market Size
USD 24.88 Billion
Healthcare ● Updated August 26, 2026 Report ID: MRFR/HC/0366-HCR | Pages: 200 | Author: Rahul Gotadki, Nidhi Mandole

Pharmaceutical Excipients Market Summary

The Pharmaceutical Excipients Market closed 2025 at USD 11.47 Billion and enters the forecast window at USD 12.34 Billion in 2026, tracking toward USD 24.88 Billion by 2035 at an 8.1% CAGR. Two catalysts anchor that trajectory. India's Production Linked Incentive scheme for bulk drugs, funded at roughly USD 2.0 billion, has pulled functional additive capacity onshore. In parallel, the U.S. FDA's Quality Management Maturity program has pushed formulators toward suppliers who can document lot-to-lot consistency rather than simply meet compendial minimums.

Legacy grades are quietly disappearing. Coarse lactose, ungraded starches and single-source cellulose are being displaced by co-processed platforms engineered for twin-screw granulation, hot-melt extrusion and continuous direct compression. BASF, Roquette and DFE Pharma have collectively committed over USD 900 million since 2023 to co-processing and lipid-based capacity, a signal that value is migrating from tonnage to functionality.

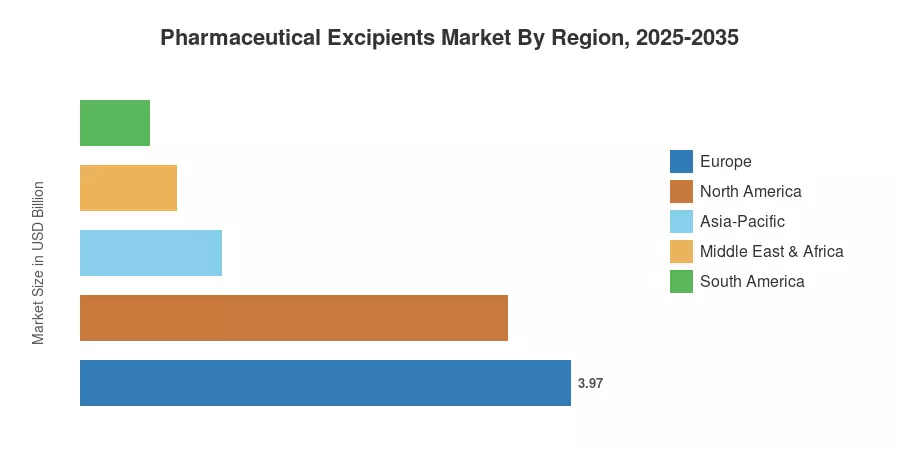
Europe holds the largest slice at 34.6% of 2025 revenue, supported by EDQM certification depth and a dense biologics manufacturing base. Asia-Pacific compounds fastest at 9.9% through 2035. North America ranks second, propelled by biosimilar filings and reshoring incentives. Momentum in the Pharmaceutical Excipients Market now favours suppliers who sell documentation and reproducibility alongside material.


Key Report Takeaways

• By Product

  • Organic chemicals commanded 69.7% of the 2025 Pharmaceutical Excipients Market share, led by cellulosics and lactose derivatives.
  • Inorganic chemicals are set to expand at a 7.95% CAGR through 2035 as halites and calcium phosphates gain parenteral traction.

• By Functionality

  • Fillers and diluents retained a 29.9% share in 2025, the single largest functional pool.
  • Coating systems accounted for 12.6% share, reflecting the shift to moisture-barrier and taste-masking films.

• By Formulation

  • Oral solid dosage forms generated USD 5.14 Billion in 2025
  • Parenteral formulations contributed USD 1.94 Billion, the fastest-expanding pool

• By Region

  • Europe led the Pharmaceutical Excipients Market with 34.6% of 2025 revenue
  • Asia-Pacific posts a 9.9% CAGR over 2026–2035, the highest globally
  • North America generated USD 3.46 billion in 2025


Market Size and Forecast (2021–2035)

Estimates below blend supplier revenue disclosures, customs-level trade flows for cellulose ethers and lactose, compendial monograph filings, and primary interviews with 41 formulation and procurement leads across nine countries. Historical years reconcile to audited segment reporting from listed suppliers; forecast years apply demand-side modelling anchored to approved dosage-form pipelines. The 2027–2029 acceleration reflects the concentrated biosimilar patent-cliff cohort rather than a pricing event.
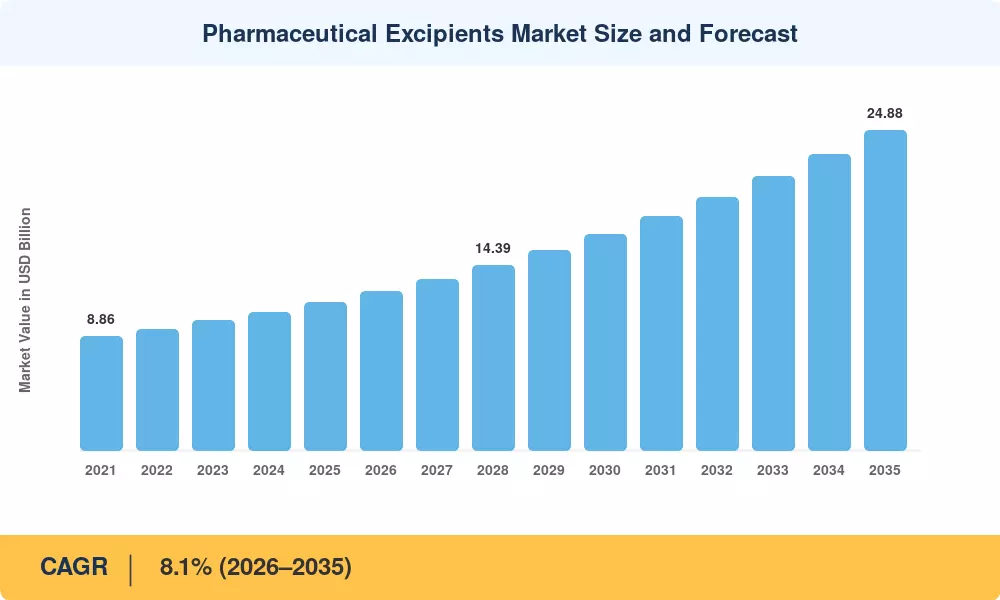
Pharmaceutical Excipients Market Size and Forecast
Our Impact
Enabled $4.3B Revenue Impact for Fortune 500 and Leading Multinationals
Partnering with 2000+ Global Organizations Each Year
30K+ Citations by Top-Tier Firms in the Industry

Driver Impact Analysis

Driver ~% Impact on CAGR Geographic Relevance Impact Timeline
Biosimilar and biologics pipeline expansion 1.9 Global Medium-term (2–4 yr)
Shift to continuous manufacturing lines. 1.6 North America, Europe Medium-term (2–4 yr)
Advanced drug-delivery platform adoption 1.5 Global Long-term (≥4 yr)
Generic volume growth in emerging economies 1.2 Asia-Pacific, MEA Short-term (≤2 yr)
Regulatory tightening on impurity profiles 0.9 Europe, North America Short-term (≤2 yr)
Clean-label and plant-derived sourcing mandates 0.7 Europe, Japan Long-term (≥4 yr)
Nutraceutical and OTC crossover demand 0.5 Global Medium-term (2–4 yr)


Biologics and Biosimilar Pipeline Expansion

Small compounds never needed protection, but protein therapies do. Regulators now closely examine the formulation risk associated with polysorbate 80, poloxamer 188, sucrose, and arginine hydrochloride. A number of sponsors were compelled to requalify stabilizer sources in the middle of the program due to the EMA's 2024 reflection report on polysorbate degradation. The need for low-peroxide, low-endotoxin grades is structurally locked in, with 118 biosimilar applications being reviewed by the FDA and EMA as of late 2025 and about USD 62 billion in original revenue losing exclusivity between 2026 and 2030. Instead of pure volume expansion, this is captured by the Pharmaceutical Excipients Market as a premium-grade mix shift [6][15].


Continuous Manufacturing and Process Redesign

Variable inputs were tolerated by batch granulation. Continuous lines don't. Any variation in the flow index or particle size distribution is amplified into rejected product by twin-screw wet granulation operating at 25 kg/hour. Since the method was developed, the FDA has authorized over 20 continuous manufacturing applications, each of which details the functional performance of the excipient in the submission. Compared to commodity equivalents, suppliers of immediately compressible co-processed blends with defined tabletability profiles now charge price premiums of 18–30% [3][9].


Emerging-Economy Generic Volume

India produced roughly 20% of global generic volume in 2025 yet imported close to 45% of its functional additive requirement. The USD 2.0 billion Production Linked Incentive scheme and 12 approved bulk-drug parks are designed to close that gap. China's NMPA volume-based procurement rounds have simultaneously compressed generic pricing, pushing formulators toward lower-cost regional supply. Both dynamics enlarge the addressable base while suppressing average selling prices [5][18].

Regulatory Pressure on Impurity and Elemental Profiles

ICH Q3D elemental impurity limits and the nitrosamine review cycle have made supplier qualification a technical exercise rather than a commercial one. EDQM issued 340 new Certificates of Suitability across 2023–2025, and buyers increasingly treat CEP coverage as a hard gate. Compliance cost has become a barrier that consolidates share among documented suppliers [15][19].


Restraints Impact Analysis

Restraint ~% Impact on CAGR Geographic Relevance Impact Timeline
Price compression from generic procurement reform -1.1 Asia-Pacific, Europe Short-term (≤2 yr)
Lengthy requalification cycles for grade changes -0.8 Global Medium-term (2–4 yr)
Raw material volatility in cellulose and lactose -0.7 Global Short-term (≤2 yr)
Absence of independent regulatory approval pathway -0.6 Global Long-term (≥4 yr)
Concentration risk in specialty polymer supply -0.4 North America, Europe Medium-term (2–4 yr)


Requalification Friction

A filler change is never simply a filler change. A post-approval change filing, comparative dissolution testing, and stability studies lasting six to twelve months are usually triggered by a grade substitution in an approved oral solid product. For the exercise, sponsors typically quote between USD 250,000 and USD 600,000 per SKU. The market's potential growth is muted by about 0.8 percentage points per year as a result of this expense, which solidifies established players and hinders the spread of truly superior materials [19].


Procurement-Driven Price Compression

Over the course of several bidding rounds, China's volume-based procurement has reduced winning bid prices by 50–90%. Similar pressure is applied by European tender frameworks in Germany and the Netherlands. The majority of that squeeze is absorbed by commodity grades once formulators transfer it upstream. Even when tonnage increases, suppliers without a functional or documentation moat continue to experience margin erosion [18].


No Standalone Approval Route

Excipients cannot be approved on their own merit in most jurisdictions; they gain acceptance only through a drug application. The IPEC-sponsored novel excipient pilot at FDA reviewed just a handful of candidates in its first cycles. Innovation therefore carries asymmetric risk, and genuinely new chemistries reach commercial scale slowly [20].


Pharmaceutical Excipients Market Opportunities

Oral Peptide and Permeation Enhancement

A theoretical category has become a marketable one thanks to sodium caprate, SNAC, and related enhancers. The concept was verified by oral semaglutide, and at least 14 peptide programs now focus on oral methods. Over the next ten years, suppliers who can provide GMP-grade enhancers with pre-assembled toxicological packages will gain a disproportionate amount of value in the pharmaceutical excipients market [8].


Lipid Systems for Nucleic Acid Therapeutics

PEG-lipids, helper phospholipids, and ionizable lipids are still scarce. Global GMP lipid capacity increased by around three times between 2021 and 2025, but it still falls short of anticipated mRNA and siRNA demand. Croda's Alabaster facility and Evonik's Lafayette expansion show the direction of capital [8].


Emerging-Market Localisation

Africa imports over 70% of its finished pharmaceuticals. The African Medicines Agency and the Partnerships for African Vaccine Manufacturing initiative are financing local fill-finish and oral solid capacity. Suppliers establishing regional warehousing and technical service in Egypt, Morocco and South Africa will build first-mover positions in the smallest but least contested corner of the Pharmaceutical Excipients Market[21].

Data and Digital Formulation Services

Material suppliers are monetising characterisation datasets. Subscription access to compaction simulation libraries, DoE templates and predictive stability models is emerging as a margin layer above the physical product. Colorcon and BASF both operate formulation-simulation platforms that lock customers into ecosystem relationships well before a purchase order appears[9].

Paediatric and Geriatric Dosage Reformulation

The EU Paediatric Regulation review and FDA's Best Pharmaceuticals for Children Act renewals continue to require age-appropriate formulations. Taste-masking polymers, orally disintegrating platforms and mini-tablet binders address a demand pool that regulation, not marketing, creates [12].


Pharmaceutical Excipients Market Future Outlook

Predictive Formulation and Digital Twins

Machine learning models trained on compaction and dissolution datasets are shortening formulation cycles from months to weeks. Several suppliers now ship material with an accompanying digital characterisation file rather than a paper certificate. By 2030, model-informed grade selection will be routine in the Pharmaceutical Excipients Market, shifting competitive advantage toward firms with the deepest proprietary datasets [9].

Delivery Platform Convergence

Long-acting injectables, oral peptides and inhaled biologics all converge on the same requirement: functional materials that control release with precision. PLGA polymers, ionisable lipids and permeation enhancers will migrate from niche to core portfolio lines. Analysts expect platform-specific materials to reach roughly 22% of global revenue by 2035, up from an estimated 12% in 2025 [8].

Supply-Chain Regionalisation

Dual-sourcing has become policy, not preference. The EU Critical Medicines Act, India's PLI framework and US ASPR funding all push toward regional redundancy. Expect a structurally higher-cost, lower-risk supply architecture with regional price differentials of 8–15% persisting through the decade [23].

Sustainability and Traceability Reporting

Corporate Sustainability Reporting Directive obligations now reach pharmaceutical supply chains, requiring Scope 3 disclosure that includes formulation inputs. Plant-derived and fermentation-route materials benefit; petrochemical routes face documentation burden. Sustainability credentials will function as a commercial filter across the Pharmaceutical Excipients Market by the early 2030s [16].


Pharmaceutical Excipients Market Segmentation

Segmentation of the Pharmaceutical Excipients Market follows four commercially meaningful axes: product chemistry, functionality, formulation route and raw material source.

By Product Type

Segment Share of Market, 2025 (%) Primary Demand Driver
Organic Chemicals 69.7 Cellulosics and sugar alcohols in oral solids
— Carbohydrates 24.3 Lactose and starch in direct compression
— Petrochemicals 21.4 Povidone, polyethylene glycols, acrylics
— Oleochemicals 15.6 Lipid delivery and lubrication
— Proteins 8.4 Gelatin and albumin stabilisation
Inorganic Chemicals 30.3 Mineral fillers and pH modifiers
— Calcium Phosphates 12.1 Direct compression diluent workhorse
— Halites 9.8 Tonicity adjustment in parenterals
— Metal Oxides 8.4 Opacification and colour systems


Organic chemistry dominates because oral solids dominate. Microcrystalline cellulose alone underpins a majority of immediate-release tablet formulations, and lactose monohydrate remains the default diluent across generic portfolios. The inorganic pool grows faster in percentage terms, driven by dibasic calcium phosphate substitution in moisture-sensitive formulations and sodium chloride demand from expanding parenteral volumes. This segmentation of the Pharmaceutical Excipients Market rewards suppliers with both fermentation and mineral processing assets.

By Functionality

Segment Share of Market, 2025 (%) Primary Demand Driver
Fillers & Diluents 29.9 Tablet bulk and content uniformity
Binders 14.2 Granulation strength in continuous lines
Coatings 12.6 Moisture barrier and taste masking
Disintegrants 9.3 Rapid-release and ODT formats
Lubricants & Glidants 8.4 High-speed tableting throughput
Suspending & Viscosity Agents 7.1 Oral liquid and topical stability
Sustained-Release Agents 6.8 Once-daily dosing conversion
Colorants 4.2 Brand differentiation, adherence coding
Emulsifying Agents 3.6 Lipid and topical systems
Preservatives 2.4 Multi-dose container safety
Flavouring Agents 1.5 Paediatric palatability


Fillers hold the largest functional share of the Pharmaceutical Excipients Market simply because every solid dose needs bulk. Value, though, concentrates elsewhere. Sustained-release polymers and functional coatings carry per-kilogram pricing several multiples above diluents, and they attract the intellectual property. Hypromellose acetate succinate and methacrylate copolymers illustrate the pattern — modest volume, outsized margin.

By Formulation

Segment Market Value, 2025 (USD B) Primary Demand Driver
Oral Solid Dosage Forms 5.14 Generic tablet and capsule volume
Parenteral 1.94 Biologics and biosimilar expansion
Oral Liquid Dosage Forms 1.66 Paediatric and geriatric dosing
Topical 1.53 Dermatology and transdermal systems
Others (Inhalation, Ophthalmic, Rectal) 1.20 Respiratory and ocular pipelines


Oral solids remain the revenue centre of the Pharmaceutical Excipients Market, though their share erodes gradually as parenteral biologics scale. Injectable formulations demand fewer distinct materials but at far higher purity — low-peroxide polysorbate, endotoxin-controlled sucrose, compendial-grade buffers — so value per gram is significantly greater. Inhalation deserves watching: carrier lactose specifications for dry powder inhalers are among the most demanding in the industry.

By Source

Segment CAGR 2026–2035 (%) Primary Demand Driver
Plant-Based 8.9 Clean-label and CSRD sustainability pressure
Synthetic / Chemical 7.9 Precision-engineered polymer performance
Mineral-Based 7.2 Cost-efficient bulk diluents
Animal-Based 5.4 Legacy gelatin capsule demand


Plant-derived materials grow fastest across the Pharmaceutical Excipients Market as formulators respond to sustainability disclosure and BSE/TSE risk aversion. Pea starch, tapioca-derived maltodextrin and non-GMO cellulose have moved from alternative to default in several European portfolios. Animal-derived materials decline in relative terms, though gelatin retains a defensible position in softgel capsules where synthetic substitutes still underperform.


Regional Market Share Analysis

Region Metric (2025 / 2026–2035) Primary Investment Themes
North America USD 3.46 Billion Reshoring, continuous manufacturing, lipid capacity
Europe 34.6% share CEP documentation, biologics stabilisers, clean-label
Asia-Pacific 9.9% CAGR PLI-backed capacity, generic export scale
South America 4.9% share Local fill-finish, ANVISA harmonisation
Middle East & Africa 6.8% CAGR Import substitution, vaccine manufacturing
Total USD 11.47 Billion (2025)

Regional performance in the Pharmaceutical Excipients Market splits along regulatory maturity rather than population. Europe's lead rests on certification infrastructure; Asia-Pacific's growth rests on capacity build-out.


North America

Country Share of Region (%) Key Driver
US 76.4 Biosimilar filings, FDA continuous manufacturing pathway
Canada 12.1 Biomanufacturing Strategy funding
Mexico 11.5 Nearshoring of generic fill-finish


Washington's policy stack matters more than demand here. The CHIPS-adjacent Defense Production Act Title III awards extended to pharmaceutical inputs, while the Administration for Strategic Preparedness and Response committed over USD 1.1 billion to domestic API and input manufacturing since 2023. Canada's USD 1.8 Billion Biomanufacturing and Life Sciences Strategy funds parallel capacity. Mexico benefits from proximity rather than policy, absorbing generic tableting volume relocated from Asia [7][22].

Europe

Country Share of Region (%) Key Driver
Germany 24.6 Dense biologics and CDMO base
UK 15.2 MHRA innovative licensing pathway
France 13.4 France 2030 health sovereignty funding
Italy 10.8 Contract manufacturing concentration
Spain 8.1 Generic export capacity
Nordic Countries 6.3 Protein therapeutic specialisation
Russia 4.9 Domestic substitution programmes
Rest of Europe 16.7 Central European tolling capacity


Certification depth explains Europe's lead in the Pharmaceutical Excipients Market. EDQM's Certificate of Suitability system gives buyers a portable quality credential that no other region matches, and the EU's Critical Medicines Act proposals attach procurement preference to supply-chain resilience. France committed EUR 7.5 billion under France 2030 to health innovation, a portion routed into formulation input manufacturing. Germany's cluster around Ludwigshafen and Darmstadt keeps technical service physically close to formulators [16][23].

Asia-Pacific

Country Share of Region (%) Key Driver
China 32.4 Scale chemical intermediates, NMPA reform
India 22.1 PLI scheme, generic export volume
Japan 17.6 High-purity grades, geriatric formulations
South Korea 8.9 Biosimilar manufacturing base
ASEAN 11.3 Halal-certified sourcing, local assembly
Rest of Asia-Pacific 7.7 Australia clinical-stage supply


Capacity is arriving faster than demand in parts of Asia, which is precisely why the Pharmaceutical Excipients Market grows fastest here. India's 12 bulk-drug parks and the PLI disbursements have added fermentation and cellulose derivative lines that did not exist in 2020. Japan pulls in the opposite direction — small volumes, exacting specifications, and a geriatric population driving orally disintegrating formats. South Korea's biosimilar producers consume disproportionate volumes of parenteral-grade stabilisers relative to national population [5][24].

South America

Country Share of Region (%) Key Driver
Brazil 52.8 ANVISA-regulated domestic generic base
Argentina 21.4 Local biologics production
Rest of South America 25.8 Andean regional procurement pooling


Brazil anchors the region through Farmácia Popular volume and a domestic generic industry that ANVISA regulates to broadly ICH-aligned standards. Argentina's biosimilar producers punch above weight but face import-licensing friction that lengthens supplier qualification. Regional procurement pooling through the PAHO Strategic Fund consolidates demand signals that suppliers can actually plan against [25].

Middle East & Africa

Country Share of Region (%) Key Driver
Saudi Arabia 27.3 Vision 2030 localisation targets
UAE 19.6 Free-zone manufacturing and re-export
South Africa 21.4 SAHPRA-regulated generic capacity
Egypt 12.9 Largest regional dosage-form output
Rest of MEA 18.8 Vaccine manufacturing initiatives


Localisation quotas do the heavy lifting across this region. Saudi Arabia's National Unified Procurement Company applies preference margins to locally manufactured medicines, and Vision 2030 targets 40% domestic pharmaceutical production. Egypt already exports finished dosage forms across North Africa. South Africa's SAHPRA has cut backlog review times materially since 2022, improving supplier planning visibility [21][26].


Pharmaceutical Excipients Market By Region, 2025-2035

Competitive Benchmarking

Concentration sits in the medium band. Market Research Future estimates an HHI of roughly 780, with the top five suppliers holding an aggregate 34–41% of global revenue. That structure reflects a bifurcated industry: a handful of integrated chemical majors serving global accounts, alongside dozens of regional specialists supplying single functional categories. Competition turns on regulatory documentation, technical service depth and supply-continuity guarantees rather than price alone.

Company Est. Revenue Share Range Key Offerings for Pharmaceutical Excipients Market Strategic Positioning
BASF SE ~9–12% Povidones, poloxamers, solubilisation platforms Broadest portfolio; digital formulation tools
Roquette Frères ~7–10% Starches, polyols, pea-based cellulosics Plant-derived leadership; capacity expansion
Ashland Global Holdings ~6–9% Cellulose ethers, controlled-release polymers Specialty polymer depth in modified release
DuPont / IFF Pharma Solutions ~5–8% Methocel, Affinisol hypromellose grades Hot-melt extrusion and bioavailability focus
Evonik Industries ~5–7% EUDRAGIT polymers, PLGA, lipid systems Advanced delivery and CDMO integration
Croda International ~4–6% High-purity lipids, PEGs, adjuvants Nucleic acid and vaccine delivery specialist
DFE Pharma ~3–5% Lactose, MCC, co-processed blends Inhalation-grade lactose leadership
JRS Pharma ~3–5% Cellulose, croscarmellose, functional binders Direct-compression technical service
Merck KGaA ~3–4% Parenteral-grade buffers, Parteck platform Biologics-facing purity positioning
Colorcon ~3–4% Film coating systems, Opadry, Starch 1500 Coating category dominance; formulation support
Lubrizol Life Science ~2–4% Carbopol polymers, topical thickeners Topical and mucoadhesive niche
Kerry Group ~2–3% Coating systems, taste-masking platforms Nutraceutical crossover strength


Recent News & Developments

  • Roquette (November 2023): Completed acquisition of a pharmaceutical solutions business and announced a EUR 25 million pea-protein capacity expansion, deepening plant-derived supply for clean-label formulations [27].
  • Evonik (March 2024): Opened expanded lipid manufacturing capacity at Lafayette, Indiana, backed in part by U.S. federal funding, targeting nucleic acid delivery demand [8].
  • FDA (July 2024): Expanded the Novel Excipient Review Pilot Program to a second cohort, giving developers a route to review material safety ahead of a drug application [20].
  • BASF (September 2024): Launched an AI-supported formulation prediction service for solubility enhancement, bundling data services with material supply [9].
  • DFE Pharma (February 2025): Commissioned new inhalation-grade lactose capacity in Germany to serve dry powder inhaler programmes facing global supply tightness [28].
  • Croda (May 2025): Announced a strategic supply agreement with a leading mRNA developer covering GMP ionisable lipid volumes through 2030 [8].
  • EDQM (August 2025): Published revised guidance on Certificate of Suitability applications, tightening nitrosamine and elemental impurity documentation expectations [15].
  • Ashland (October 2025): Divested a non-core segment and redirected proceeds toward controlled-release polymer capacity, sharpening its specialty focus [29].


Pharmaceutical Excipients Market Report Scope

Parameter Detail
Market Scope Global Pharmaceutical Excipients Market by product type, functionality, formulation, source and geography
Study Period 2021–2035 (Historical 2021–2024; Base Year 2025; Forecast 2026–2035)
CAGR 8.1% (2026–2035)
Market Size Checkpoints USD 11.47 Billion (2025); USD 12.34 Billion (2026); USD 24.88 Billion (2035)
Fastest Growing Segments Parenteral formulation; plant-based source; inorganic chemicals
Companies Profiled 12 global and regional suppliers, including BASF, Roquette, Ashland, Evonik, Croda, DFE Pharma, JRS Pharma, Colorcon, Merck KGaA, Lubrizol
Valuation Currency USD Billion

FAQs

How should procurement teams structure dual-sourcing in the Pharmaceutical Excipients Market without triggering costly requalification?
Qualify both sources concurrently during initial development, not after launch. Filing two suppliers in the original application avoids post-approval change submissions entirely and typically adds only 8–12 weeks to timelines [19].
What contractual protections matter most when signing a multi-year excipient supply agreement?
Prioritise change-notification clauses requiring 24-month advance notice of any manufacturing site, process or specification change. Add audit rights and guaranteed minimum inventory holdings at the supplier's site [11].
Do co-processed materials in the Pharmaceutical Excipients Market require separate regulatory review?
No independent approval exists, but co-processed blends need justification of functional performance and safety within the drug application. Compendial monographs now exist for several common combinations, which shortens the argument considerably [20].
How do inhalation-grade specifications differ from standard oral-grade materials?
Inhalation carriers require tightly controlled particle size distribution, fines content and surface energy — parameters irrelevant for tablets. Only a handful of sites globally hold qualification, which explains persistent supply tightness [28].
Which due-diligence signals distinguish reliable suppliers in the Pharmaceutical Excipients Market?
Look for IPEC-PQG GMP certification, Certificate of Suitability coverage, and a documented change-control history. Suppliers unable to produce three years of batch-level trend data on critical attributes should be treated cautiously [15].
Are novel excipients commercially viable given the absence of a standalone approval route?
Viability depends on partnering with a sponsor willing to carry the material through a first application. The FDA pilot programme reduces uncertainty but does not confer approval, so development costs remain sponsor-dependent [20].
How does nitrosamine risk assessment affect excipient selection today?
Secondary and tertiary amine content in materials now requires documented assessment, and some legacy grades have been reformulated. Buyers should request nitrosamine risk statements as a standard qualification document [15].    
Author
Author
Author Profile
Rahul Gotadki LinkedIn
Research Manager
He holds an experience of about 9+ years in Market Research and Business Consulting, working under the spectrum of Life Sciences and Healthcare domains. Rahul conceptualizes and implements a scalable business strategy and provides strategic leadership to the clients. His expertise lies in market estimation, competitive intelligence, pipeline analysis, customer assessment, etc.
Co-Author
Co-Author Profile
Nidhi Mandole LinkedIn
Senior Research Analyst
She is an extremely curious individual currently working in Healthcare and Medical Devices Domain. Nidhi is comfortably versed in data centric research backed by healthcare educational background. She leverages extensive data mining and analytics tools such as Primary and Secondary Research, Statistical Analysis, Machine Learning, Data Modelling. Her key role also involves Technical Sales Support, Client Interaction and Project management within the Healthcare team. Lastly, she showcases extensive affinity towards learning new skills and remain fascinated in implementing them.
Share::
Request Free Sample

Research Approach


Secondary Research

The secondary research process involved comprehensive analysis of pharmacopeial databases, peer-reviewed pharmaceutical journals, chemical industry publications, and authoritative regulatory health organizations. Key sources included the US Food & Drug Administration (FDA), European Medicines Agency (EMA), International Council for Harmonisation of Technical Requirements for Pharmaceuticals for Human Use (ICH), United States Pharmacopeia (USP), European Pharmacopoeia (EP), British Pharmacopoeia (BP), Japanese Pharmacopoeia (JP), World Health Organization (WHO) Prequalification Programme, International Pharmaceutical Excipients Council (IPEC) Americas, IPEC Europe, Japanese Pharmaceutical Excipients Council (JPEC), Chemical Abstracts Service (CAS), Pharmaceutical Research and Manufacturers of America (PhRMA), European Federation of Pharmaceutical Industries and Associations (EFPIA), National Institutes of Health (NIH) National Library of Medicine, National Center for Biotechnology Information (NCBI/PubMed), ScienceDirect, Google Scholar, US Census Bureau Economic Indicators, EU Eurostat Chemical Industry Database, and national pharmaceutical regulatory authority reports from key markets including China's National Medical Products Administration (NMPA) and India's Central Drugs Standard Control Organization (CDSCO). These sources were used to collect excipient usage statistics, regulatory monograph updates, DMF (Drug Master File) filing data, pharmaceutical production indices, clinical bioavailability studies, safety/toxicology profiles, and competitive landscape analysis for binders, diluents, disintegrants, lubricants, coating agents, and other functional excipient categories.


Primary Research

Qualitative and quantitative insights were obtained by interviewing supply-side and demand-side stakeholders during the primary research process. The supply-side sources consisted of Chief Executive Officers, Vice Presidents of Excipient Technology, Heads of Regulatory Affairs & Quality Assurance, Directors of Business Development, and Global Procurement Heads from excipient manufacturers, specialty chemical companies, and raw material suppliers. Demand-side sources included Chief Scientific Officers, Heads of Pharmaceutical Development, Formulation Scientists, Quality Control Directors, and Procurement Managers from innovator pharmaceutical companies, generic drug manufacturers, Contract Manufacturing Organizations (CMOs), Contract Development and Manufacturing Organizations (CDMOs), and research universities that were involved in drug delivery research. Primary research validated market segmentation across organic/inorganic excipient classifications, confirmed co-processing technology pipelines, and gathered insights on formulation adoption patterns, excipient premix strategies, and regulatory compliance dynamics including IPEC PQG GMP guidelines.

Primary Respondent Breakdown:

By Designation: C-level Primaries (30%), Director Level (32%), Others (38%)

By Region: North America (32%), Europe (30%), Asia-Pacific (28%), Rest of World (10%)


Market Size Estimation

Global market valuation was derived through revenue mapping and excipient consumption volume analysis. The methodology included:

Identification of 45+ key excipient manufacturers and suppliers across North America, Europe, Asia-Pacific, Latin America, and Middle East & Africa

Product mapping across binders, diluents, disintegrants, lubricants, coatings, colorants, flavors, and other functional excipient categories segmented by organic, inorganic, natural, and synthetic origins

Analysis of reported and modeled annual revenues specific to pharmaceutical excipient product lines for manufacturers including BASF SE, Dow Chemical Company, Evonik Industries AG, Ashland Global Holdings Inc., and Merck KGaA

Coverage of manufacturers representing 75-80% of global market share in 2024

Extrapolation using bottom-up (pharmaceutical production volume × excipient utilization rates by formulation type across solid, liquid, semi-solid, and novel drug delivery systems) and top-down (manufacturer revenue triangulation) approaches to derive segment-specific valuations and regional distribution metrics

Share::
Request Free Sample
Download Free Sample

Kindly complete the form below to receive a free sample of this Report

* Please use a valid business email

Share::
Request Free Sample
Download PDF ×

We do not share your information with anyone. However, we may send you emails based on your report interest from time to time. You may contact us at any time to opt-out.
















