Physical Security Market (2026 - 2035)

Physical Security Market Size, Share and Research Report By Type (System, Service), By Industry (Education, Oil & Gas, Government, Retail, Hospitality, BFSI, and Retail), And, By Region (North America, Europe, Asia-Pacific, And Rest of the World) – Industry Forecast Till 2035
ID: MRFR/SEM/2066-HCR
100 Pages
Aarti Dhapte, Shubham Munde
Last Updated: July 16, 2026
Physical Security Market
Market Size
Forecast Period2026-2035
CAGR (2026-2035)5.40%
2025 Market SizeUSD 131.80 Billion
2035 Market SizeUSD 223.04 Billion
Key Players
Honeywell International
Johnson Controls International
Robert Bosch GmbH
Hangzhou Hikvision Digital Technology
Zhejiang Dahua Technology
Axis Communications
Opportunities
  • Unified Physical-Cyber Security Platforms
  • SME Cloud-Security Adoption in Emerging Markets
  • Data Monetization Through Security Analytics

Physical Security Market Summary

The Physical Security Market stood at USD 131.80 billion in 2025 and is projected to reach USD 138.92 billion in 2026 before climbing to USD 223.04 billion by 2035, registering a 5.40% CAGR across the 2026–2035 forecast window. Escalating geopolitical tensions, rising urban crime rates, and government mandates — such as the U.S. Department of Homeland Security's USD 3.2 billion annual allocation for critical-infrastructure protection — anchor near-term demand [1]. Enterprise spending on physical security continues to accelerate even in constrained budget environments because insurers increasingly tie premium reductions to verified surveillance and access-control deployments [2].

A sweeping technology shift defines this decade. Legacy analog CCTV arrays and standalone card-reader systems are giving way to IP-networked cameras with on-device AI processing, cloud-managed access credentials, and unified command platforms that merge intrusion detection with cybersecurity dashboards. The European Union's AI Act, effective from 2025, compels vendors to reclassify certain facial-recognition deployments while simultaneously validating the regulatory permanence of intelligent surveillance — a dynamic that drives both compliance spending and product redesign [3].

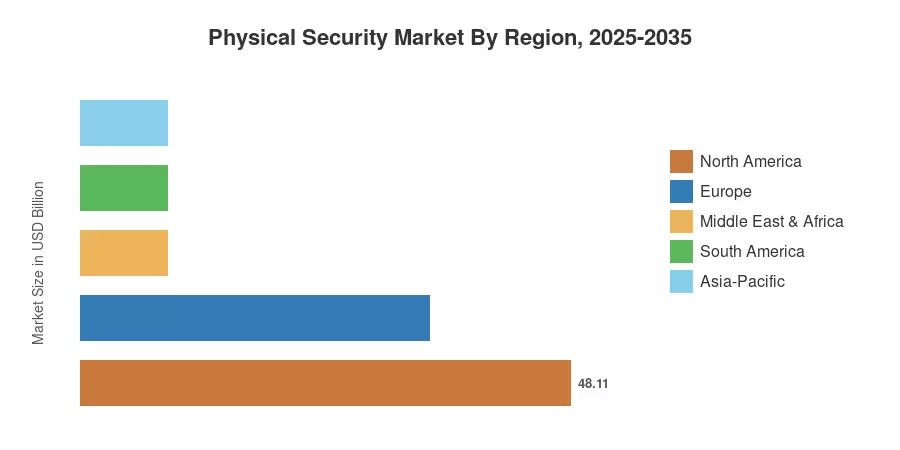
North America retains the dominant share of the Physical Security Market at roughly 36.5% of global revenue, backed by federal procurement cycles and a mature integration-services ecosystem. Asia-Pacific is the fastest-growing region, registering a projected 6.50% CAGR fueled by smart-city rollouts in China, India, and Southeast Asia. Europe holds the second-largest position, contributing approximately 26.0% of revenue as GDPR-adjacent regulations sustain demand for privacy-compliant surveillance architectures. As edge computing and 5G connectivity mature through the early 2030s, the Physical Security Market is poised to evolve from point-product procurement toward platform-centric, subscription-driven security ecosystems.


Key Report Takeaways

• By System Type

  • Video surveillance systems commanded the largest segment of the Physical Security Market with approximately 47.0% revenue share in 2025, driven by enterprise-wide camera refresh cycles and smart-city procurement programs.
  • Biometric systems are projected to expand at the fastest pace, registering a 7.05% CAGR through 2035 as airports, corporate campuses, and government facilities accelerate contactless identity verification.

• By Service Type

  • Video-surveillance-as-a-service (VSaaS) accounted for the dominant share among service offerings in the Physical Security Market during 2025, reflecting the industry's shift toward recurring cloud-hosted revenue models.
  • Access-control-as-a-service (ACaaS) is poised for the highest growth trajectory through 2035, with mobile-credential adoption and multi-site management platforms fueling enterprise uptake.

• By End-User Industry

  • Government services captured USD 40.71 billion of the Physical Security Market in 2025, supported by national-security mandates and border-protection modernization programs.
  • Residential applications will register the fastest growth at 6.40% CAGR as smart-home ecosystems integrate professional-grade perimeter monitoring with consumer IoT platforms.

• By Region

  • North America retained the largest regional contribution to the Physical Security Market at 36.5% share in 2025.
  • Asia-Pacific leads regional growth with a 6.50% CAGR, propelled by urbanization-linked infrastructure spending across China, India, Japan, and ASEAN economies.


Physical Security Market Size and Forecast (2021–2035)

Market Research Future derives historical estimates from a combination of vendor-reported revenue disclosures, government procurement databases, customs-trade data for surveillance hardware, and validated third-party syndicated studies. Forecast projections layer macroeconomic indicators, regulatory pipeline analysis, and bottom-up technology adoption curves onto the historical base to generate the year-by-year trajectory shown below.
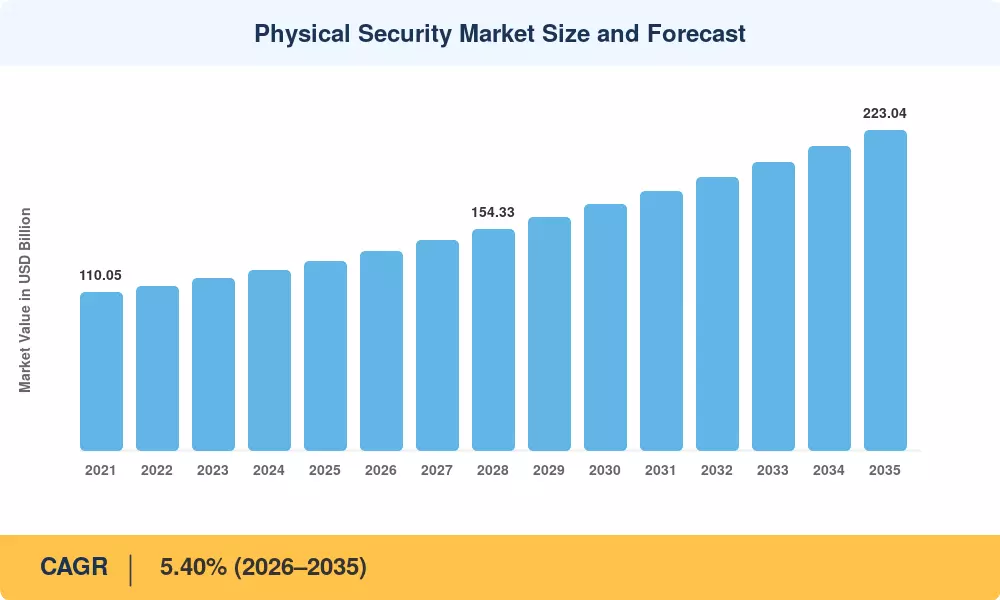
Physical Security Market Size and Forecast
Our Impact
Enabled $4.3B Revenue Impact for Fortune 500 and Leading Multinationals
Partnering with 2000+ Global Organizations Each Year
30K+ Citations by Top-Tier Firms in the Industry

Driver Impact Analysis

Driver ~% Impact on CAGR Geographic Relevance Impact Timeline
Government infrastructure-protection mandates 1.3% North America, Europe Short-term (≤2 yr)
AI-powered analytics and edge computing 1.1% Global Medium-term (2–4 yr)
Smart-city and urban-surveillance expansion 0.9% Asia-Pacific, MEA Medium-term (2–4 yr)
Cloud migration and as-a-service models 0.8% Global Short-term (≤2 yr)
Insurance incentives for connected security 0.5% North America, Europe Long-term (≥4 yr)
5G and IoT sensor proliferation 0.5% Asia-Pacific, North America Long-term (≥4 yr)
ESG compliance and low-power device mandates 0.3% Europe, Asia-Pacific Long-term (≥4 yr)


Government Infrastructure-Protection Mandates

Sovereign risk perceptions are translating directly into procurement budgets. The U.S. Cybersecurity and Infrastructure Security Agency (CISA) expanded its Physical Security Convergence guidance in 2024, requiring federally funded facilities to integrate intrusion-detection layers with network-monitoring platforms [1]. Parallel legislation in the EU — notably the Critical Entities Resilience Directive (CER) — obligates operators in energy, transport, and healthcare to upgrade physical access controls by 2026, creating a compliance-driven spending floor estimated at EUR 4.8 billion across member states [4]. These mandates guarantee baseline demand for the Physical Security Market even during macroeconomic downturns.

AI-Powered Analytics and Edge Computing

On-camera inference engines now run object-classification, loitering-detection, and behavioral-anomaly models at the network edge, reducing bandwidth costs by up to 60% compared with centralized cloud processing [7]. Vendors like Hanwha Vision and Axis Communications shipped AI-equipped camera lines throughout 2024, while chipmakers Ambarella and Qualcomm released purpose-built vision SoCs priced below USD 15 per unit at volume — a threshold that makes AI standard rather than premium. The shift elevates the average selling price of surveillance nodes by an estimated 18–22% while simultaneously lengthening replacement cycles, a net positive for Physical Security Market revenue growth [10].

Smart-City and Urban-Surveillance Expansion

China's "Safe City" initiative has deployed over 600 million surveillance cameras nationwide, and India's Safe City Project sanctioned INR 3,847 crore (approximately USD 460 million) for smart surveillance across 15 cities during Phase I [3]. Southeast Asian economies — Vietnam, Thailand, and Indonesia — are following with municipal surveillance tenders tied to World Bank and Asian Development Bank conurbation loans. These programs pull demand forward for integrated command-and-control platforms, wide-area radar, and license-plate-recognition systems, all of which register at premium price points within the Physical Security Market.

Cloud Migration and As-a-Service Models

The transition from capital-expenditure hardware purchases to operating-expenditure subscription models reshapes vendor economics. VSaaS platforms such as Verkada and Eagle Eye Networks reported combined annual recurring revenue growth exceeding 35% in 2024 [6]. ACaaS adoption is climbing in tandem, particularly among multi-site retail and banking operators that value centralized credential management. For the Physical Security Market, this shift compresses hardware margins but substantially increases lifetime customer value, favoring vendors with integrated cloud stacks.


Restraints Impact Analysis

The restraint-impact percentages below are directional estimates indicating headwinds against market expansion. They do not subtract directly from the published CAGR.

Restraint ~% Negative Impact on CAGR Geographic Relevance Impact Timeline
High false-alarm rates in legacy systems –0.6% Global Short-term (≤2 yr)
Privacy and data-sovereignty regulations –0.5% Europe, Asia-Pacific Medium-term (2–4 yr)
Supply-chain disruptions for semiconductors –0.4% Global Short-term (≤2 yr)
Skilled-workforce shortage for system integration –0.3% North America, Europe Long-term (≥4 yr)
Cybersecurity vulnerabilities in IP-connected devices –0.3% Global Medium-term (2–4 yr)


High False-Alarm Rates in Legacy Systems

Municipal police departments in the United States respond to an estimated 36 million alarm activations annually, of which 94–98% are false [16]. The resulting "alarm fatigue" erodes end-user confidence and, in jurisdictions such as Salt Lake City and Charlotte, has led to ordinance-based fines and verified-response policies that delay dispatch. For the Physical Security Market, this dynamic suppresses upgrade willingness among cost-sensitive SMEs unless vendors can demonstrate verified-alarm analytics that cut false activations below a 5% threshold.

Privacy and Data-Sovereignty Regulations

The EU’s AI Act classified real-time biometric identification in public settings as “high-risk” or even banned, apart from some law enforcement applications, with anticipated compliance costs of €200,000-400,000 per usage [4]. China’s Personal Information Protection Law (PIPL) and India’s Digital Personal Data Protection Act add a layer of consent and localization requirements. These conflicting regimes also divide product roadmaps and delay international rollouts, placing a compliance drag on the growth trajectory of the Physical Security Market.


Supply-Chain Disruptions for Semiconductors

Physical security hardware uses specialized vision processors, PoE controllers and secure-element chips. The 2021–2023 semiconductor shortfall pushed camera lead times to 30–40 weeks, and although conditions eased by late 2024, geopolitical limitations, particularly U.S. export limits on sophisticated Chinese chipmakers, bring recurring supply uncertainties [17]. Vendors lacking dual-source silicon strategies are experiencing margin compression and product launch delays that combine to dampen the near-term growth potential of the Physical Security Market.


Physical Security Market Opportunities

Unified Physical-Cyber Security Platforms

High-value greenfields include convergence between physical security operations centers and IT security-operations-center (SOC) dashboards. 2024 converged-security benchmark [12] states that enterprises that combine badge access, video telemetry and network-anomaly detection onto a single pane lower mean-time-to-respond by up to 40%. Vendors who can develop API-first solutions that span OT and IT domains, such as Genetec, Honeywell and upcoming pure-play SaaS entrants, are positioned to gain incremental revenues in the Physical Security Market.

operations

SME Cloud-Security Adoption in Emerging Markets

Small and medium firms in Latin America, Southeast Asia and Sub-Saharan Africa continue to be severely underserved. Cloud delivered bundles - two or three cameras, door controller and mobile app dashboard on a monthly subscription price under USD 50 - lower the adoption barrier. As per the SEBRAE small-business agency, there was a year-on-year growth of 28% in terms of security-technology queries from Brazilian micro-enterprises in 2024 [13]. This category is the fastest growing niche in the Physical Security Market to 2035.


Data Monetization Through Security Analytics

Cameras and access-control sensors generate vast operational-intelligence datasets — foot traffic patterns, dwell-time metrics, occupancy heat maps — that hold commercial value beyond loss prevention. Retailers using Sensormatic's analytics suite have reported 12–15% improvements in store-layout efficiency [19]. As privacy-preserving techniques like federated learning and on-device anonymization mature, monetizable insights from security infrastructure could evolve into a standalone revenue layer for the Physical Security Market.

Transportation and Critical-Infrastructure Hardening

Airport, port, and rail-network operators face tightening regulatory expectations globally. The U.S. Transportation Security Administration's updated Surface Transportation Cybersecurity Directives now extend to physical-access checkpoints, while the EU's NIS2 Directive mandates incident-reporting for transport operators [20]. These requirements create a multi-billion-dollar procurement pipeline that favors integrated perimeter, access-control, and video-management vendors.

Drone-Based Surveillance and Autonomous Patrol

Autonomous security drones — both tethered and free-flying — address the persistent labor-shortage challenge in perimeter patrol. Companies such as Nightingale Security and Sunflower Labs are deploying autonomous drone-in-a-box solutions for warehouse parks, solar farms, and data-center campuses [14]. As beyond-visual-line-of-sight (BVLOS) regulations relax across the U.S. and Europe, drone surveillance is positioned to become a high-margin adjacency within the Physical Security Market.


Physical Security Market Future Outlook

AI-Autonomous Security Operations

By 2030, autonomous security-operations platforms will ingest data from cameras, radar, lidar, access-control logs, and environmental sensors to generate threat assessments without human triage. estimates that AI-driven automation could reduce security-operations labor costs by 25–35% in enterprise environments [22]. For the Physical Security Market, this translates into a value migration from hardware sales toward software-platform licensing and managed-detection-and-response subscriptions, reshaping vendor margin profiles across the decade.

Platform Economics and Ecosystem Lock-In

The 2030s will reward vendors who build open-yet-sticky ecosystems. Genetec's Security Center, Milestone's XProtect, and Honeywell's Connected Buildings platform already demonstrate how video management, access control, and building automation converge into single license frameworks. Market Research Future projects that platform-attached recurring revenue will account for over 40% of the Physical Security Market by 2034, up from roughly 22% in 2025 [6]. Interoperability standards such as ONVIF Profile M and OSDP v2 will determine which ecosystems achieve critical mass.

Sustainability and Low-Power Security Infrastructure

ESG reporting requirements and net-zero building certifications (LEED, BREEAM) increasingly encompass security hardware energy consumption. Solar-powered camera nodes, PoE++ switches with intelligent power budgeting, and ultra-low-power radar units are entering the Physical Security Market to address Scope 2 emission targets [9]. The International Energy Agency projects that building-sector electrification will drive a 15% increase in PoE-connected devices globally by 2030, a tailwind for energy-efficient security-system vendors [23].

Convergence of Physical and Cyber Domains

The boundary between physical and cyber security is dissolving. A compromised IP camera is simultaneously a physical-surveillance gap and a network-entry point. By 2032, Market Research Future anticipates that over 60% of enterprise security budgets will be allocated through converged physical-cyber governance structures rather than siloed departments [12]. This convergence amplifies the addressable Physical Security Market by folding in cybersecurity-adjacent spend and creating a new competitive dynamic where Palo Alto Networks and CrowdStrike intersect with Honeywell and Johnson Controls.


Physical Security Market Segmentation

By System Type

Segment Key Metric Primary Demand Driver
Video Surveillance Systems 47.0% share (2025) Smart-city and retail loss-prevention deployments
Physical Access Control Systems USD 38.33 Billion (2025) Enterprise credential modernization
Intrusion Detection Systems 5.20% CAGR Critical-infrastructure perimeter mandates
Biometric Systems 7.05% CAGR Contactless identity verification post-pandemic


Video surveillance systems anchor the Physical Security Market, accounting for roughly 47.0% of 2025 revenue. The segment's breadth — spanning IP cameras, NVRs, VMS software, and analytics engines — creates multiple revenue layers per installation. AI-equipped cameras capable of on-device object detection now represent over 35% of new unit shipments globally, a proportion expected to surpass 70% by 2030 as silicon costs decline [7]. Physical access control systems constitute the second-largest segment, valued at USD 38.33 billion in 2025, driven by enterprise transitions from legacy card-and-reader architectures to mobile-credential and cloud-managed platforms. Biometric systems, while smaller in absolute terms, post the strongest growth trajectory at 7.05% CAGR as airports, healthcare facilities, and high-security government sites deploy iris, fingerprint, and facial-authentication solutions.

By Service Type

Segment Key Metric Primary Demand Driver
VSaaS 56.0% share (2025) Cloud-hosted video management adoption
ACaaS 7.35% CAGR Multi-site enterprise credential management


VSaaS dominates the service layer of the Physical Security Market, reflecting enterprise preference for OpEx-based cloud video platforms over CapEx-intensive on-premises NVR deployments. Eagle Eye Networks, Verkada, and Rhombus have emerged as category leaders, while legacy incumbents — Honeywell, Bosch, Johnson Controls — are transitioning existing customer bases onto hybrid cloud architectures. ACaaS is the faster-growing service category at 7.35% CAGR, fueled by organizations managing 50+ sites that benefit from centralized dashboard provisioning and revocation of physical credentials across distributed locations.

By Deployment

Segment Key Metric Primary Demand Driver
On-Premises 66.0% share (2025) Data-sovereignty and latency requirements
Cloud 7.10% CAGR Scalability and remote-management demand


On-premises installations retain the majority share of the Physical Security Market at approximately 66.0% in 2025, anchored by defense, government, and financial institutions that mandate local data residency. Cloud deployment is eroding that share steadily at 7.10% CAGR, and Market Research Future expects cloud-delivered physical security solutions to surpass 40% of new deployments by 2032.

By Organization Size

Segment Key Metric Primary Demand Driver
Large Enterprises 62.0% share (2025) Multi-campus, compliance-driven security
Small & Medium Enterprises 7.70% CAGR Affordable cloud bundles and insurance incentives


Large enterprises command 62.0% of the Physical Security Market by organization size, reflecting the capital intensity and integration complexity of enterprise-grade deployments. SMEs, however, are closing the gap at 7.70% CAGR as turnkey cloud packages — camera, controller, and mobile app — lower the entry price to under USD 100 per month per site.

By End-User Industry

Segment Key Metric Primary Demand Driver
Government Services 31.5% share (2025) National-security and public-safety mandates
BFSI USD 21.90 Billion (2025) Branch security and ATM surveillance compliance
Transportation & Logistics 5.60% CAGR Airport, port, and rail perimeter hardening
Retail USD 13.18 Billion (2025) Shrinkage reduction and customer analytics
Residential 6.40% CAGR Smart-home ecosystem integration
Healthcare 5.50% CAGR Patient and pharmaceutical security


Government services represent the largest vertical within the Physical Security Market at 31.5% share, sustained by defense-procurement cycles and public-safety surveillance programs. BFSI follows with USD 21.90 billion in 2025 revenue as banking regulators worldwide mandate branch-level video retention and biometric-enabled access. Residential applications are the fastest-growing end-user category at 6.40% CAGR, propelled by DIY-installed smart-camera ecosystems from Ring, Arlo, and Google Nest that blur the line between consumer electronics and professional physical security.


Regional Market Share Analysis

Region Key Metric Primary Investment Themes
North America 36.5% share (2025) Federal mandates, campus security, cloud migration
Europe 26.0% share (2025) GDPR/AI Act compliance, transport security
Asia-Pacific 6.50% CAGR (2026–2035) Smart-city programs, rapid urbanization
South America USD 8.57 Billion (2025) Banking sector upgrades, urban crime reduction
Middle East & Africa USD 8.57 Billion (2025) Mega-event security, oil-and-gas perimeter protection
Total USD 131.80 Billion (2025)

The Physical Security Market displays pronounced regional variation shaped by regulatory maturity, urbanization velocity, and infrastructure-investment priorities.


North America

Country Key Metric Key Driver
United States 78.0% of regional share DHS and CISA mandates, campus security refresh
Canada 12.5% of regional share Cannabis-facility surveillance requirements
Mexico 9.5% of regional share Banking-sector security modernization


The United States anchors the Physical Security Market in North America through a combination of federal procurement (DHS, DoD, GSA schedules) and a private-sector installed base exceeding 85 million networked cameras [1]. The NDAA Section 889 ban on certain Chinese-manufactured equipment triggered a multi-year replacement cycle valued at an estimated USD 4–6 billion, benefiting compliant manufacturers like Motorola Solutions and Hanwha Vision. Canada's regulated cannabis industry imposes stringent video-retention mandates that sustain per-site camera densities three to four times higher than typical retail, while Mexico's banking regulator (CNBV) requires biometric-enabled ATM and branch-access systems.

Europe

Country Key Metric Key Driver
Germany 5.15% CAGR Industry 4.0 factory-perimeter security
United Kingdom USD 8.91 Billion (2025) Counter-terrorism urban surveillance
France 5.30% CAGR Olympic legacy infrastructure reuse
Italy USD 3.42 Billion (2025) Heritage-site protection mandates
Spain 5.10% CAGR Tourism-sector security upgrades
Nordic Countries USD 2.85 Billion (2025) Smart-building integration standards
Russia 4.60% CAGR Import-substitution domestic manufacturing
Rest of Europe USD 4.58 Billion (2025) EU cohesion-fund security investments


Europe's Physical Security Market expansion tracks regulatory cadence. The CER Directive and NIS2 requirements push critical-infrastructure operators toward auditable, standards-compliant physical security stacks, while the AI Act forces facial-recognition vendors to implement conformity assessments that elevate per-project costs but also create defensible moats for compliant providers [4]. Post-2024 Olympic security infrastructure in France is being repurposed for transit and venue applications across Paris and Lyon, a pattern that seeds long-term recurring maintenance revenue.

Asia-Pacific

Country Key Metric Key Driver
China 38.0% of regional share Safe City and Skynet programs
India 7.20% CAGR Safe City Project and metro-rail expansion
Japan USD 5.20 Billion (2025) Olympic-legacy and earthquake-resilience integration
South Korea 6.80% CAGR Smart-factory and semiconductor-fab security
ASEAN USD 4.10 Billion (2025) Airport and port modernization
Rest of Asia-Pacific 5.90% CAGR ADB-funded urban-infrastructure projects


Asia-Pacific represents the growth engine of the Physical Security Market. China's installed surveillance camera base surpasses 600 million units, with municipal spending shifting from volume deployment toward AI-upgrade overlays and maintenance contracts [3]. India's Union Budget 2024–2025 allocated INR 11,500 crore to the Smart Cities Mission, a significant portion of which flows into integrated command-and-control centers that combine video surveillance with traffic management and emergency response. South Korea's semiconductor-fabrication campuses — operated by Samsung and SK Hynix — require cleanroom-grade access control with biometric layers, pulling premium Physical Security Market revenue.

South America

Country Key Metric Key Driver
Brazil 62.0% of regional share Banking and retail security mandates
Argentina 5.00% CAGR Municipal surveillance expansion
Rest of South America USD 1.37 Billion (2025) Mining-perimeter and port security


Brazil dominates South America's Physical Security Market, driven by Banco Central do Brasil regulations mandating video recording at all bank branches and ATM locations. Urban violence indices in São Paulo, Rio de Janeiro, and Recife sustain residential and commercial alarm-system penetration rates above 30%, one of the highest in the developing world [13]. Argentina's Buenos Aires metropolitan government has accelerated its City of Cameras program, targeting 40,000 connected cameras by 2027.

Middle East & Africa

Country Key Metric Key Driver
Saudi Arabia 32.0% of regional share NEOM and Vision 2030 mega-projects
UAE 6.40% CAGR Expo legacy, smart-city ambitions
South Africa USD 1.20 Billion (2025) Private-security industry formalization
Egypt 5.80% CAGR New Administrative Capital infrastructure
Rest of MEA USD 1.92 Billion (2025) Oil-and-gas perimeter protection


The Middle East & Africa Physical Security Market is shaped by mega-project cycles and hydrocarbon-infrastructure requirements. Saudi Arabia's NEOM development alone is expected to deploy over 100,000 networked cameras and AI-enabled perimeter sensors across its 26,500 km² footprint [21]. The UAE's post-Expo 2020 Dubai infrastructure continues to attract security-technology investment as District 2020 transitions into a permanent innovation hub. South Africa's Private Security Industry Regulatory Authority (PSIRA) oversees the world's largest private-security workforce — exceeding 2.7 million registered officers — creating a vast addressable market for technology-augmented guarding.


Physical Security Market By Region, 2025-2035

Competitive Benchmarking

The Physical Security Market exhibits medium concentration with an estimated HHI of approximately 800–1,000, indicating that no single vendor dominates but a tier of five to seven global incumbents collectively holds 35–40% of revenue. Competition plays out across three dimensions: geographic reach, product-portfolio breadth (hardware + software + services), and channel-partner density. M&A activity has intensified since 2022 as software-platform companies acquire camera and sensor OEMs to assemble end-to-end stacks.

Company Est. Revenue Share Range Key Offerings for Physical Security Market Strategic Positioning
Honeywell International ~6–9% Connected Buildings, Pro-Watch access control, video management Integrated building-automation and security convergence
Johnson Controls International ~5–8% Tyco-branded intrusion, video, and access-control products Global install base leveraging Tyco brand recognition
Robert Bosch GmbH ~4–7% Video surveillance, intrusion detection, communication systems Engineering-led R&D with deep European market share
Hangzhou Hikvision Digital Technology ~7–10% IP cameras, NVRs, AI-analytics platform Volume manufacturing and aggressive international pricing
Zhejiang Dahua Technology ~4–6% IP cameras, thermal imaging, access control Cost-competitive portfolio with growing OEM channel
Axis Communications (Canon) ~3–5% Network cameras, radar, audio, VMS Premium positioning with strong integrator loyalty
ASSA ABLOY ~3–5% Electronic locks, mobile credentials, door hardware Access-control dominance across commercial and institutional
Motorola Solutions ~3–5% Avigilon video, access control, LPR Video-analytics leadership via Avigilon and Pelco acquisitions
Genetec ~2–4% Security Center unified platform, AutoVu LPR Open-architecture software platform with ISV ecosystem
Allegion ~2–3% Schlage electronic locks, Von Duprin exit devices Focused access-control specialist with institutional channel


Recent News & Developments

  • Motorola Solutions (July 2024 ): Completed the acquisition of Noggin, an Australian critical-event management platform, to embed incident-response orchestration into its Avigilon video-analytics ecosystem [6].
  • Genetec (December 2023 ): Released Security Center 5.12 with native integration for Axis Communications radar units, enabling unified perimeter-detection and video-verification workflows from a single operator interface [10].
  • Johnson Controls (February 2024): Formed a strategic partnership with Microsoft to deploy Azure-hosted OpenBlue security-and-sustainability services for commercial real estate operators in North America and Europe [9].

Physical Security Market Report Scope

Parameter Detail
Market Scope Global Physical Security Market covering systems, services, deployment modes, organization sizes, and end-user industries
Study Period 2021–2035
CAGR 5.40% (2026–2035)
Base-Year Market Size USD 131.80 Billion (2025)
Forecast-End Market Size USD 223.04 Billion (2035)
Fastest Growing Segment Biometric Systems (by system type); SMEs (by organization size); Asia-Pacific (by region)
Companies Profiled Honeywell, Johnson Controls, Bosch, Hikvision, Dahua, Axis Communications, ASSA ABLOY, Motorola Solutions, Genetec, Allegion
Valuation Currency USD Billion


FAQs

How does the shift from CapEx to OpEx models affect buyer total cost of ownership in the Physical Security Market?
Cloud-subscription models typically reduce upfront hardware spend by 40–60% but accumulate higher 5-year total cost when retention and bandwidth fees are included. Buyers should model a 7-year TCO comparison before committing to either approach [6].
Which cybersecurity certifications should procurement teams require from Physical Security Market vendors?
Prioritize vendors certified under IEC 62443 for industrial cybersecurity and SOC 2 Type II for cloud-hosted services. These certifications validate both device-hardening and operational-security practices [12].
How do insurance premium reductions justify Physical Security Market investments for mid-market companies?
Commercial insurers offer 5–15% premium discounts for verified, connected surveillance and access-control systems. A mid-market company spending USD 200,000 on annual premiums could recover system costs within three to four years [2].
What interoperability standards matter most when selecting physical security platforms?
ONVIF Profile S/T/M for video and OSDP v2 for access control are the critical open standards. They prevent vendor lock-in and ensure multi-brand device compatibility [10].
How is the Physical Security Market adapting to quantum-computing threats against encryption?
Leading vendors are piloting post-quantum cryptographic algorithms for credential encryption and video-stream authentication. NIST finalized its first post-quantum standards in 2024, and early adopters are integrating these into firmware roadmaps [17].
What role do managed security service providers play in the Physical Security Market?
MSSPs bundle remote monitoring, maintenance, and analytics into fixed monthly contracts. They are particularly valued by multi-site operators lacking in-house security-engineering talent [18].
How should organizations approach the Physical Security Market when operating across jurisdictions with conflicting privacy laws?
Deploy configurable privacy-masking and data-residency controls at the platform level. This allows a single system architecture to comply with GDPR, PIPL, and other regional frameworks simultaneously [4].    
Author
Author
Author Profile
Aarti Dhapte LinkedIn
AVP - Research
A consulting professional focused on helping businesses navigate complex markets through structured research and strategic insights. I partner with clients to solve high-impact business problems across market entry strategy, competitive intelligence, and opportunity assessment. Over the course of my experience, I have led and contributed to 100+ market research and consulting engagements, delivering insights across multiple industries and geographies, and supporting strategic decisions linked to $500M+ market opportunities. My core expertise lies in building robust market sizing, forecasting, and commercial models (top-down and bottom-up), alongside deep-dive competitive and industry analysis. I have played a key role in shaping go-to-market strategies, investment cases, and growth roadmaps, enabling clients to make confident, data-backed decisions in dynamic markets.
Co-Author
Co-Author Profile
Shubham Munde LinkedIn
Team Lead - Research
Shubham brings over 7 years of expertise in Market Intelligence and Strategic Consulting, with a strong focus on the Automotive, Aerospace, and Defense sectors. Backed by a solid foundation in semiconductors, electronics, and software, he has successfully delivered high-impact syndicated and custom research on a global scale. His core strengths include market sizing, forecasting, competitive intelligence, consumer insights, and supply chain mapping. Widely recognized for developing scalable growth strategies, Shubham empowers clients to navigate complex markets and achieve a lasting competitive edge. Trusted by start-ups and Fortune 500 companies alike, he consistently converts challenges into strategic opportunities that drive sustainable growth.

Research Approach


Secondary Research

The secondary research process involved comprehensive analysis of regulatory databases, industry publications, government security directives, and authoritative technology research organizations. Key sources included the U.S. Department of Homeland Security (DHS), European Union Agency for Cybersecurity (ENISA), National Institute of Standards and Technology (NIST), International Organization for Standardization (ISO), ASIS International, Security Industry Association (SIA), FBI Uniform Crime Reporting (UCR) Program, Eurostat Crime and Criminal Justice Statistics, United Nations Office on Drugs and Crime (UNODC), OSAC (Overseas Security Advisory Council), National Center for Education Statistics (NCES) Campus Safety and Security, Bureau of Justice Statistics (BJS), Transportation Security Administration (TSA), U.S. General Services Administration (GSA), and national interior ministry reports from key markets. These sources were used to collect security incident statistics, regulatory compliance requirements, technology adoption trends, government procurement data, and market landscape analysis for video surveillance systems, access control systems, intrusion detection, perimeter security, and integrated security services.

Additional authoritative sources included IHS Markit Technology, Memoori Research, ASMAG.com, Security Today, SDM Magazine (Security Dealer & Integrator), IFSEC Global, and Gartner Security & Risk Management research. Government procurement databases such as SAM.gov (System for Award Management), EU Tenders Electronic Daily (TED), and UK Contracts Finder were analyzed to extract public sector security spending patterns.


Primary Research

To gather both qualitative and quantitative insights, supply-side and demand-side stakeholders were interviewed during the primary research phase. CEOs, VPs of Product Development, chief security technology officers, and heads of government relations from companies that manufacture physical security equipment, system integrators, and security service providers were examples of supply-side sources. Chief security officers (CSOs), corporate security directors, facility managers, procurement heads from BFSI institutions, retail loss prevention directors, education campus security chiefs, hospitality security managers, and critical infrastructure protection officers from the government and oil and gas industries were examples of demand-side sources. Primary research verified product roadmap timelines, gathered information on pricing strategies, procurement dynamics, and technology adoption patterns, and validated market segmentation across systems (video surveillance, access control, intrusion detection, and perimeter security) and services (installation, maintenance, monitoring, and consulting).

Primary Respondent Breakdown:

By Designation: C-level Primaries (28%), Director Level (35%), Others (37%)

By Region: North America (32%), Europe (30%), Asia-Pacific (30%), Rest of World (8%)


Market Size Estimation

Global market valuation was derived through revenue mapping and installation volume analysis. The methodology included:

Identification of 50+ key manufacturers and system integrators across North America, Europe, Asia-Pacific, Middle East & Africa, and Latin America

Product mapping across video surveillance (CCTV/IP cameras, video analytics), access control (biometric, card-based, electronic locks), intrusion detection (sensors, alarms), perimeter security (barriers, gates, detection systems), and services (installation, managed services, remote monitoring)

Analysis of reported and modeled annual revenues specific to physical security portfolios, including hardware, software, and service components

Coverage of manufacturers and integrators representing 72-78% of global market share in 2024

Extrapolation using bottom-up (installation volume × ASP by country/vertical) and top-down (manufacturer revenue validation) approaches to derive segment-specific valuations, cross-referenced with government security spending reports and vertical-specific procurement data

This methodology maintains the authoritative structure of your original template while adapting the sources and breakdowns specifically to the physical security industry's unique ecosystem of government agencies, regulatory bodies, and security-focused organizations.

Download Free Sample

Kindly complete the form below to receive a free sample of this Report

Download PDF ×

We do not share your information with anyone. However, we may send you emails based on your report interest from time to time. You may contact us at any time to opt-out.

















