Download Free Sample
Kindly complete the form below to receive a free sample of this Report
Point of Sale (POS) System Maintenance Services Market Research Report: Size, Share, Trend Analysis By End User Outlook (Small Businesses, Medium Enterprises, Large Corporations, Franchises, E-commerce) By Application Outlook (Retail, Hospitality, Healthcare, Entertainment, Transportation) By Service Type Outlook (Hardware Maintenance, Software Support, System Upgrades, Technical Support, Training Services) By Region (North America, Europe, APAC, South America, MEA) - Growth Outlook & Industry Forecast To 2035
As per MRFR analysis, the Point-of-Sale (POS) System Maintenance Services Market was estimated at 4.5 USD Billion in 2024. The POS System Maintenance Services industry is projected to grow from 4.7 in 2025 to 7.2 by 2035, exhibiting a compound annual growth rate (CAGR) of 4.37% during the forecast period 2025 - 2035.
The Point-of-Sale (POS) System Maintenance Services Market is experiencing a dynamic evolution driven by technological advancements and changing consumer expectations.
| 2024 Market Size | 4.5 (USD Billion) |
| 2035 Market Size | 7.2 (USD Billion) |
| CAGR (2025 - 2035) | 4.37% |
Verifone (US), Ingenico (FR), NCR Corporation (US), Diebold Nixdorf (US), Square (US), Toast (US), Lightspeed (CA), ShopKeep (US), Clover (US)
Our Impact
Enabled $4.3B Revenue Impact for Fortune 500 and Leading Multinationals
Partnering with 2000+ Global Organizations Each Year
30K+ Citations by Top-Tier Firms in the Industry
The Point-of-Sale (POS) System Maintenance Services Market is currently experiencing a notable evolution, driven by the increasing reliance on technology in retail and hospitality sectors. Businesses are recognizing the necessity of maintaining their POS systems to ensure seamless operations and enhance customer experiences. As digital transactions become more prevalent, the demand for reliable maintenance services is likely to grow. This trend suggests that companies are prioritizing the longevity and efficiency of their POS systems, which could lead to a more competitive landscape among service providers. Furthermore, the integration of advanced technologies, such as artificial intelligence and machine learning, appears to be influencing the market dynamics. These innovations may facilitate predictive maintenance, allowing businesses to address potential issues before they escalate, thereby minimizing downtime and operational disruptions. In addition, the increasing complexity of POS systems, which now often include various hardware and software components, necessitates specialized maintenance services. This complexity may drive businesses to seek out expert providers who can offer tailored solutions. As the market continues to evolve, it seems that the emphasis on customer support and service quality will become paramount. Companies that can deliver comprehensive maintenance solutions, including remote support and on-site assistance, are likely to gain a competitive edge. Overall, the Point-of-Sale (POS) System Maintenance Services Market is poised for growth, with trends indicating a shift towards more sophisticated and customer-centric service offerings.
The incorporation of advanced technologies, such as artificial intelligence and machine learning, is transforming the Point-of-Sale (POS) System Maintenance Services Market. These innovations enable predictive maintenance, allowing businesses to identify and resolve potential issues proactively, thus reducing downtime.
As businesses increasingly rely on complex POS systems, there is a growing demand for customized maintenance solutions. Service providers that can tailor their offerings to meet specific business needs are likely to stand out in a competitive market.
The emphasis on exceptional customer support is becoming a critical factor in the Point-of-Sale (POS) System Maintenance Services Market. Companies that prioritize responsive service and comprehensive support options are expected to enhance customer satisfaction and loyalty.
Data security concerns are becoming increasingly prominent, driving the Point-of-Sale (POS) System Maintenance Services Market. With the rise in cyber threats, businesses are compelled to prioritize the security of their POS systems. The implementation of stringent data protection regulations has further intensified this focus. In fact, a significant percentage of businesses report that they have increased their investment in security measures for their POS systems. This trend indicates a growing recognition of the potential financial and reputational risks associated with data breaches. As a result, maintenance services that ensure compliance with security standards and protect sensitive customer information are in high demand.
Technological advancements are significantly influencing the Point-of-Sale (POS) System Maintenance Services Market. Innovations such as cloud-based solutions, artificial intelligence, and machine learning are transforming the capabilities of POS systems. These advancements not only improve transaction efficiency but also enhance data analytics and customer insights. As businesses adopt these cutting-edge technologies, the complexity of maintaining these systems increases. Consequently, there is a growing demand for specialized maintenance services that can address the unique challenges posed by these advanced systems. This trend indicates a shift towards more sophisticated maintenance solutions that can keep pace with rapid technological changes.
The expansion of the retail and hospitality sectors serves as a crucial driver for the Point-of-Sale (POS) System Maintenance Services Market. As these sectors continue to grow, the demand for efficient and reliable POS systems increases correspondingly. Recent data suggests that the retail sector alone has experienced a growth rate of approximately 5 percent annually, leading to a heightened need for maintenance services to support these systems. Businesses in these sectors are increasingly recognizing the importance of maintaining their POS systems to enhance operational efficiency and customer satisfaction. This trend underscores the necessity for dedicated maintenance services to ensure that POS systems remain functional and up-to-date.
The rise in digital payment solutions is a pivotal driver for the Point-of-Sale (POS) System Maintenance Services Market. As businesses increasingly adopt contactless and mobile payment options, the demand for reliable POS systems escalates. This trend is evidenced by a notable increase in digital transactions, which have surged by over 30 percent in recent years. Consequently, the need for ongoing maintenance services to ensure these systems operate seamlessly becomes paramount. Businesses recognize that efficient POS systems not only enhance customer experience but also streamline operations. Therefore, the maintenance of these systems is critical to sustaining competitive advantage in a rapidly evolving marketplace.
Rising consumer expectations for service quality are driving the Point-of-Sale (POS) System Maintenance Services Market. Customers today demand seamless and efficient transactions, which places pressure on businesses to ensure their POS systems are functioning optimally. As a result, companies are increasingly investing in maintenance services to enhance system reliability and minimize downtime. Recent surveys indicate that a significant number of consumers are willing to switch brands if their service experience is subpar. This shift in consumer behavior highlights the critical role of effective POS system maintenance in meeting customer expectations and retaining loyalty. Businesses are thus recognizing that investing in maintenance services is essential for sustaining high service quality.
In the Point-of-Sale (POS) System Maintenance Services Market, the retail sector dominates the application segment, capturing the largest share as it continues to invest in advanced POS solutions to enhance customer experience and operational efficiency. Retailers are increasingly adopting integrated POS systems that allow for seamless transactions and real-time inventory management, establishing a significant presence in the maintenance services domain.
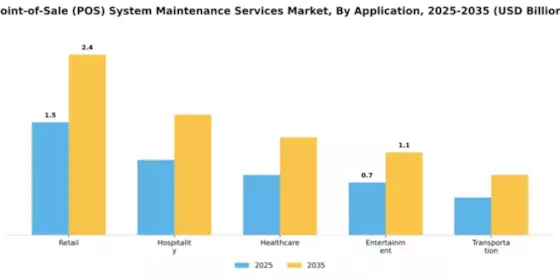
Retail (Dominant) vs. Hospitality (Emerging)
Retail represents the dominant force in the POS system maintenance services market, driven by a strong reliance on technology to manage sales transactions and customer relationships effectively. The demand for reliable maintenance services in retail is essential to minimize downtime and ensure smooth operations. In contrast, the hospitality sector is emerging as a growing segment, fueled by the increasing need for customer-centric services and contactless payment options. As hospitality venues look to enhance the guest experience through technology, they are investing in POS systems that can adapt to fluctuating service demands, positioning this segment for rapid growth as it embraces innovative maintenance solutions.
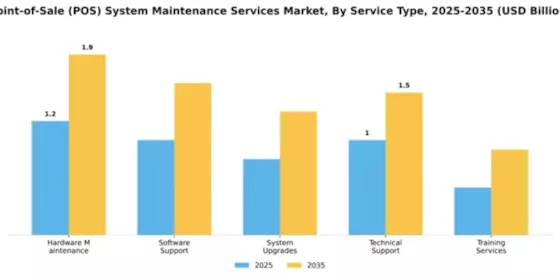
In the Point-of-Sale (POS) System Maintenance Services Market, Technical Support holds the largest market share, heavily relied upon by businesses to ensure seamless operations. This segment leads as organizations prioritize consistent technical assistance to minimize downtime and enhance customer satisfaction. Meanwhile, Software Support is rapidly gaining traction, marking itself as the fastest-growing segment as businesses increasingly depend on software solutions to drive their operations, reflecting a broader trend towards digital transformation. The growth dynamics within the service type segment are primarily driven by the digital advancements in POS systems and the rising complexity of software solutions. As businesses integrate sophisticated POS software, the demand for specialized Software Support escalates, fostering a robust market environment. Concurrently, Technical Support continues to evolve, adapting to new technologies, thereby maintaining its dominant position amidst changing market demands. Overall, evolving consumer habits and the accelerating pace of technology adoption catalyze growth across both segments.
Technical Support (Dominant) vs. Software Support (Emerging)
Technical Support remains a dominant player in the Point-of-Sale (POS) System Maintenance Services Market, characterized by its critical role in ensuring uninterrupted service delivery. This segment encompasses a wide range of services, from troubleshooting issues to providing urgent fixes, which are essential for retail, hospitality, and other sectors where downtime can lead to significant financial losses. Technical Support is usually customized, offering businesses tailored solutions that cater to specific operational needs. In contrast, Software Support is emerging rapidly as a significant complement, driven by the increasing reliance on advanced software systems. With businesses upgrading their software packages frequently and the introduction of cloud-based systems, Software Support evolves to include regular updates, maintenance, and user training that are becoming indispensable.
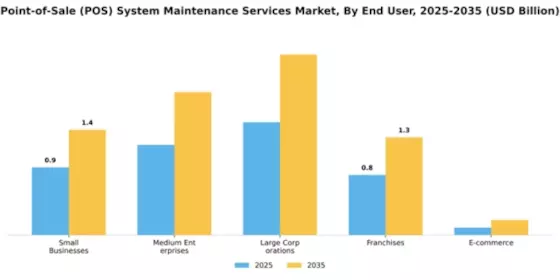
In the Point-of-Sale (POS) System Maintenance Services Market, the distribution of market share among various end-user segments showcases distinct characteristics. Small businesses represent the largest segment, as they rely heavily on efficient POS systems to streamline operations. Following closely are medium enterprises and franchises, each contributing significantly to the market. E-commerce, while a smaller segment, is gaining momentum rapidly, led by the growing emphasis on online retail solutions and integrated payment systems.
Small Businesses: Dominant vs. E-commerce: Emerging
Small businesses dominate the POS system maintenance services market due to their wide adoption of streamlined solutions for sales processing and inventory management. These businesses often prioritize cost-effective maintenance services to enhance operational efficiency. In contrast, the e-commerce sector is emerging rapidly, fueled by the digital transformation of retail. Online businesses increasingly require sophisticated POS systems and maintenance services to handle various transaction methods and improve customer experience. This dual focus on efficiency in small businesses and innovation in the e-commerce sector highlights a significant shift in the market dynamics.
Get more detailed insights about Point-of-Sale (POS) System Maintenance Services Market Request Free Sample
North America leads the POS System Maintenance Services market, holding a significant share of 2.25B in 2024. The growth is driven by the increasing adoption of advanced payment technologies and the rising demand for seamless customer experiences. Regulatory support for digital transactions and cybersecurity measures further catalyze market expansion. The region's focus on innovation and technology integration is pivotal in maintaining its leadership position. The competitive landscape in North America is robust, featuring key players like Verifone, NCR Corporation, and Square. The U.S. is the primary market, driven by a high density of retail and hospitality sectors. Companies are investing in service enhancements and customer support to differentiate themselves. The presence of established firms and startups alike fosters a dynamic environment, ensuring continuous growth and adaptation to market needs.
Europe's POS System Maintenance Services market is valued at 1.5B, reflecting a growing trend towards digital payment solutions. The region is witnessing increased demand for integrated systems that enhance operational efficiency. Regulatory frameworks promoting digital transactions and consumer protection are significant growth drivers. The shift towards e-commerce and contactless payments is also contributing to market expansion, making it a key player in the global landscape. Leading countries in Europe include France, Germany, and the UK, where major players like Ingenico and Diebold Nixdorf are prominent. The competitive landscape is characterized by a mix of established companies and innovative startups. The focus on customer-centric solutions and technological advancements is driving competition, ensuring that the market remains dynamic and responsive to consumer needs. The European market is poised for further growth as businesses adapt to evolving payment technologies.
The Asia-Pacific region, with a market size of 0.9B, is rapidly emerging in the POS System Maintenance Services sector. The growth is fueled by increasing smartphone penetration and the rise of e-commerce platforms. Governments are also promoting digital payment solutions, which act as a catalyst for market development. The region's diverse consumer base and varying payment preferences create unique opportunities for service providers to innovate and cater to local demands. Countries like China, India, and Japan are leading the charge, with a mix of local and international players competing for market share. Companies such as Toast and Lightspeed are expanding their presence, focusing on tailored solutions for different sectors. The competitive landscape is vibrant, with a strong emphasis on technology integration and customer service, ensuring that the region remains a focal point for growth in the POS services market.
The Middle East and Africa region, valued at 0.35B, presents significant growth opportunities in the POS System Maintenance Services market. The increasing adoption of digital payment solutions and mobile wallets is driving demand. Regulatory initiatives aimed at enhancing financial inclusion and promoting e-commerce are pivotal in shaping the market landscape. The region's young population and rising smartphone usage further contribute to the growth potential of POS services. Leading countries include South Africa and the UAE, where the market is witnessing a surge in digital transactions. The competitive landscape is evolving, with both local and international players vying for market share. Companies are focusing on innovative solutions and customer engagement strategies to capture the growing demand. As the region continues to develop its digital infrastructure, the POS services market is expected to expand significantly.
The Point-of-Sale (POS) System Maintenance Services Market is characterized by a dynamic competitive landscape, driven by technological advancements and the increasing demand for efficient transaction processing. Key players such as Verifone (US), Ingenico (FR), and NCR Corporation (US) are at the forefront, each adopting distinct strategies to enhance their market positioning. Verifone (US) focuses on innovation through the development of advanced payment solutions, while Ingenico (FR) emphasizes regional expansion, particularly in emerging markets. NCR Corporation (US) is leveraging digital transformation to streamline operations and improve customer engagement. Collectively, these strategies contribute to a competitive environment that is increasingly shaped by technological integration and customer-centric solutions.In terms of business tactics, companies are increasingly localizing manufacturing and optimizing supply chains to enhance service delivery and reduce operational costs. The market appears moderately fragmented, with several players vying for market share. However, the influence of major companies is significant, as they set industry standards and drive innovation. This competitive structure allows for a diverse range of service offerings, catering to various customer needs across different regions.In November Square (US) announced a strategic partnership with a leading cloud service provider to enhance its POS system capabilities. This collaboration aims to integrate advanced analytics and machine learning into their maintenance services, thereby improving system reliability and customer insights. The strategic importance of this partnership lies in Square's commitment to leveraging technology to provide superior service, which could potentially set a new benchmark in the industry.In October Toast (US) launched a new suite of maintenance services designed specifically for the restaurant sector, incorporating AI-driven predictive maintenance features. This initiative reflects Toast's focus on niche market segments and its understanding of the unique challenges faced by food service businesses. By addressing these specific needs, Toast positions itself as a leader in tailored solutions, which may enhance customer loyalty and retention.In September Lightspeed (CA) expanded its service offerings by acquiring a local POS maintenance firm, thereby strengthening its presence in the North American market. This acquisition not only broadens Lightspeed's service portfolio but also enhances its operational capabilities, allowing for quicker response times and improved customer service. Such strategic moves indicate a trend towards consolidation in the market, as companies seek to enhance their competitive edge through expanded service capabilities.As of December the competitive trends in the POS System Maintenance Services Market are increasingly defined by digitalization, sustainability, and AI integration. Strategic alliances are becoming more prevalent, as companies recognize the value of collaboration in enhancing service offerings and operational efficiency. Looking ahead, competitive differentiation is likely to evolve from traditional price-based competition to a focus on innovation, technology integration, and supply chain reliability. This shift underscores the importance of adaptability and forward-thinking strategies in maintaining a competitive advantage in a rapidly changing market.





The Point-of-Sale (POS) System Maintenance Services Market is projected to grow at a 4.37% CAGR from 2025 to 2035, driven by technological advancements and increasing demand for efficient transaction systems.
New opportunities lie in:
By 2035, the market is expected to be robust, reflecting sustained growth and innovation.
| MARKET SIZE 2024 | 4.5(USD Billion) |
| MARKET SIZE 2025 | 4.7(USD Billion) |
| MARKET SIZE 2035 | 7.2(USD Billion) |
| COMPOUND ANNUAL GROWTH RATE (CAGR) | 4.37% (2025 - 2035) |
| REPORT COVERAGE | Revenue Forecast, Competitive Landscape, Growth Factors, and Trends |
| BASE YEAR | 2024 |
| Market Forecast Period | 2025 - 2035 |
| Historical Data | 2019 - 2024 |
| Market Forecast Units | USD Billion |
| Key Companies Profiled | Verifone (US), Ingenico (FR), NCR Corporation (US), Diebold Nixdorf (US), Square (US), Toast (US), Lightspeed (CA), ShopKeep (US), Clover (US) |
| Segments Covered | Application, Service Type, End User |
| Key Market Opportunities | Integration of artificial intelligence in Point-of-Sale (POS) System Maintenance Services enhances operational efficiency and customer support. |
| Key Market Dynamics | Rising demand for seamless integration and support drives competition in the Point-of-Sale System Maintenance Services market. |
| Countries Covered | North America, Europe, APAC, South America, MEA |
The market is projected to reach a valuation of 7.2 USD Billion by 2035.
The overall market valuation was 4.5 USD Billion in 2024.
The expected CAGR for the market during this period is 4.37%.
The segments include Retail, Hospitality, Healthcare, Entertainment, and Transportation.
The Retail segment was valued at 1.5 USD Billion in 2024.
Key players include Verifone, Ingenico, NCR Corporation, Diebold Nixdorf, Square, Toast, Lightspeed, ShopKeep, and Clover.
The Hardware Maintenance segment is projected to reach 1.9 USD Billion by 2035.
In 2024, Medium Enterprises were valued at 1.2 USD Billion, while Large Corporations were valued at 1.5 USD Billion.
Technical Support services are expected to grow from 1.0 USD Billion in 2024 to 1.5 USD Billion by 2035.
The E-commerce segment is projected to reach a valuation of 0.2 USD Billion by 2035.


Kindly complete the form below to receive a free sample of this Report

“This is really good guys. Excellent work on a tight deadline. I will continue to use you going forward and recommend you to others. Nice job”


“Thanks. It’s been a pleasure working with you, please use me as reference with any other Intel employees.”


“Thanks for sending the report it gives us a good global view of the Betaïne market.”


“Thank you, this will be very helpful for OQS.”


“We found the report very insightful! we found your research firm very helpful. I'm sending this email to secure our future business.”


“I am very pleased with how market segments have been defined in a relevant way for my purposes (such as "Portable Freezers & refrigerators" and "last-mile"). In general the report is well structured. Thanks very much for your efforts.”


“I have been reading the first document or the study, ,the Global HVAC and FP market report 2021 till 2026. Must say, good info! I have not gone in depth at all parts, but got a good indication of the data inside!”


“We got the report in time, we really thank you for your support in this process. I also thank to all of your team as they did a great job.”


“The Automotive 48V ECU Components Procurement Intelligence Study” was a complex project, but the Market Research Future (MRFR) team handled it with quality, agility, and customer-centricity. They delivered all requested data on time and within the agreed scope. The team, including Shubhendra Anand and Rahul Gotadki, was always readily available to clarify questions and swiftly implement necessary adjustments, driving the project to a successful conclusion within a very demanding timeframe.
I would also like to specifically commend Akshay Agarwal for his responsiveness and support at every stage—from our initial inquiry on May 6th through to final delivery on June 18th. His dedication made the entire process seamless.”



