Polymer Filler Market (2026 - 2035)

Polymer Fillers Market Research Report Information By Type (Organic Filler {Natural Fibers, Carbon, and Others}, and Inorganic Filler {Oxides, Silicates, Salts, Hydro-Oxides, Metals, and Others}), By Application (Automotive, Building & Construction, Electrical & Electronics, Packaging, Industrial, and Others) And By Region (North America, Europe, Asia-Pacific, And Rest Of The World) –Market Forecast Till 2035
ID: MRFR/CnM/1029-HCR
140 Pages
Priya Nagrale
Last Updated: July 12, 2026
Polymer Filler Market
Market Size
Forecast Period2026-2035
CAGR (2026-2035)4.38%
2025 Market SizeUSD 60.32 Billion
2035 Market SizeUSD 91.48 Billion
Key Players
Imerys S.A.
Omya AG
Minerals Technologies Inc.
BASF SE
Huber Engineered Materials
Quarzwerke GmbH
Opportunities
  • Nano-Engineered Functional Fillers for Electronics Miniaturization
  • Recycled-Content Calcium Carbonate in Circular Packaging
  • Emerging-Market Construction Demand in Sub-Saharan Africa

Polymer Filler Market Summary

The Polymer Fillers Market reached an estimated USD 60.32 billion in 2025 and is projected to grow from USD 62.89 billion in 2026 to USD 91.48 billion by 2035, registering a CAGR of 4.38% during the forecast period. Two catalysts are reshaping demand: tightening lightweight-vehicle mandates under Euro 7 emission norms and an infrastructure spending surge anchored by the U.S. Bipartisan Infrastructure Law, which earmarks over USD 550 billion for roads, bridges, and utilities that consume large volumes of calcium carbonate fillers and thermoplastic compounds [2][3].

A generational shift is underway in how formulators select plastic filler materials. Legacy single-function extenders—primarily ground calcium carbonate used to cut resin costs—are giving way to engineered mineral fillers that simultaneously reinforce stiffness, improve flame retardancy, and lower carbon footprint. Global investment in surface-treated and nano-grade functional fillers exceeded USD 4.2 billion in 2024, signaling that compounders now treat talc fillers, precipitated silica, and bio-based organic grades as performance-critical polymer additives rather than commodity dilutants [4][5].

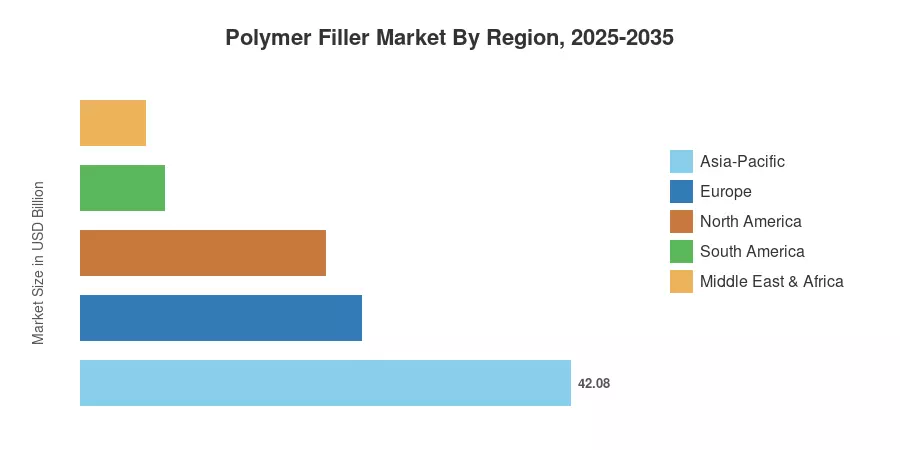
Asia-Pacific commands approximately 42% of the Polymer Fillers Market, driven by capacity expansions across China and India. The region is also the fastest-growing, with a projected CAGR of 5.68% through 2035. Europe holds the second-largest share at roughly 24%, buoyed by circular-economy regulations that favor recycled-content reinforcing fillers. North America contributes a steady demand through EV battery-housing applications and residential construction recovery. As composite filler materials penetrate new end uses—from 3D-printed building panels to flexible electronics substrates—the Polymer Fillers Market is poised for sustained expansion well into the next decade [6][7].


Key Report Takeaways

• By Product Type

  • Inorganic fillers—including calcium carbonate fillers, silica, and talc fillers—held a 72.46% revenue share of the Polymer Fillers Market in 2025, reflecting their cost-performance advantage in high-volume thermoplastic compounds
  • Organic filler grades are forecast to expand at a 5.48% CAGR through 2035, propelled by demand for bio-based and natural-fiber reinforcing fillers in automotive interiors

• By Polymer Matrix

  • Thermoplastic fillers accounted for 57.16% of the Polymer Fillers Market in 2025, with polypropylene and polyethylene remaining the largest resin platforms for mineral fillers
  • Elastomer-based applications are advancing at a 5.27% CAGR, fueled by EV vibration-damping components that rely on functional fillers for noise reduction

• By End-User Industry

  • Building and construction held USD 23.38 billion of the Polymer Fillers Market value in 2025, anchored by PVC pipe, roofing membranes, and insulation panels loaded with calcium carbonate fillers
  • Automotive and transportation segments are projected to grow at a 5.84% CAGR to 2035 as lightweighting targets accelerate the adoption of composite filler materials

• By Region

  • Asia-Pacific captured 42.08% of the Polymer Fillers Market in 2025 and is expected to register a 5.68% CAGR through 2035
  • North America's share stood at approximately 21% in 2025, supported by EV incentives and infrastructure renewal programs


Market Size and Forecast (2021–2035)

The historical and forecast data below draw on MRFR's proprietary bottom-up model, triangulated against trade association shipment data, customs records, and annual reports from leading mineral fillers producers. Base-year 2025 figures reflect actual production volumes, while 2026–2035 projections apply a compound growth framework calibrated to macroeconomic indicators and regional capacity pipelines.
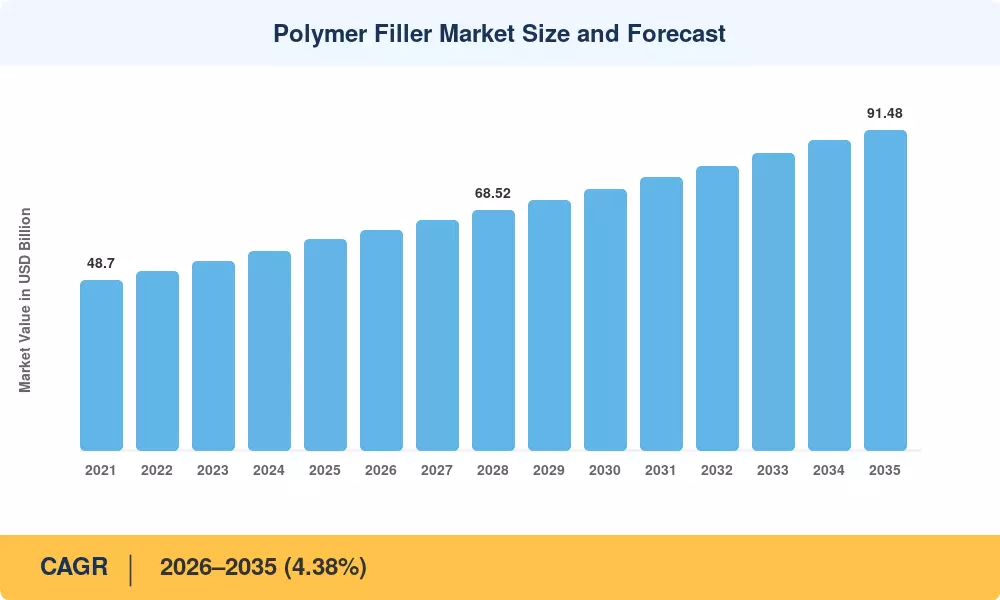
Polymer Filler Market Size and Forecast
Our Impact
Enabled $4.3B Revenue Impact for Fortune 500 and Leading Multinationals
Partnering with 2000+ Global Organizations Each Year
30K+ Citations by Top-Tier Firms in the Industry

Driver Impact Analysis

Driver ~% Impact on CAGR Geographic Relevance Impact Timeline
Lightweight-vehicle mandates (Euro 7, CAFE) 18–22% Europe, North America Medium-term (2–4 yr)
Infrastructure spending programs 15–18% North America, Asia-Pacific Short-term (≤2 yr)
EV battery housing & thermal management 12–15% Global Medium-term (2–4 yr)
Bio-based and recycled filler adoption 10–13% Europe, Asia-Pacific Long-term (≥4 yr)
Nano-filler and surface-treatment innovation 8–11% Global Long-term (≥4 yr)
Packaging sustainability regulations 8–10% Europe, North America Short-term (≤2 yr)
Construction boom in ASEAN and India 10–14% Asia-Pacific Short-term (≤2 yr)


Lightweight-Vehicle Mandates Accelerate Reinforcing Filler Uptake

The European Commission's Euro 7 standards, finalized in late 2024, impose stricter particulate limits that compel automakers to shed vehicle mass. Talc fillers and short-glass-fiber mineral fillers in polypropylene compounds reduce component weight by 15–20% versus steel equivalents. CAFE standards in the United States similarly target 50 mpg fleet-wide by 2031, channeling procurement budgets toward polymer additives that deliver stiffness-to-weight ratios competitive with aluminum [2][12].

Infrastructure Spending Drives Construction-Grade Calcium Carbonate Demand

The U.S. Bipartisan Infrastructure Law and India's National Infrastructure Pipeline (USD 1.4 trillion through 2030) are generating unprecedented demand for PVC pipes, geomembranes, and roofing membranes loaded with calcium carbonate fillers. Ground calcium carbonate alone accounts for over 40% of all plastic filler materials consumed in building applications, and capacity utilization at major grinding plants in Gujarat and Guangdong exceeded 90% in 2024 [3][11].

EV Thermal Management Creates New Functional Filler Niches

Battery enclosures for electric vehicles require compounds that combine flame retardancy, thermal conductivity, and dimensional stability. Alumina trihydrate and magnesium hydroxide functional fillers meet UL 94 V-0 ratings while maintaining processability in injection-molding operations. Global EV production is expected to surpass 40 million units by 2030, translating into an incremental USD 3.8 billion opportunity for thermoplastic fillers designed for high-voltage applications [4][13].

Bio-Based Fillers Gain Traction Under Circular-Economy Mandates

The EU's revised Packaging and Packaging Waste Regulation (PPWR), effective 2025, mandates minimum recycled-content thresholds that encourage blending of bio-based mineral fillers into post-consumer resin streams. Natural-fiber reinforcing fillers derived from hemp, flax, and rice-husk ash are now commercially available at scale, and life-cycle assessments show a 30–35% reduction in embodied carbon versus conventional calcium carbonate fillers [8][14].


Restraints Impact Analysis

Restraint ~% Negative Impact on CAGR Geographic Relevance Impact Timeline
Raw-material price volatility (limestone, talc) –8 to –12% Global Short-term (≤2 yr)
Regulatory restrictions on nano-particle fillers –5 to –8% Europe, North America Medium-term (2–4 yr)
Competition from unfilled engineering resins –4 to –7% North America, Europe Long-term (≥4 yr)
Supply-chain disruptions in mineral mining –6 to –9% Asia-Pacific, MEA Short-term (≤2 yr)
Environmental scrutiny of mining operations –3 to –5% Global Long-term (≥4 yr)


Raw-Material Price Volatility Squeezes Compounder Margins

Limestone and talc prices surged 18% and 14%, respectively, between 2022 and 2024, driven by energy-cost pass-throughs and export restrictions in China's Guangxi province. Compounders operating on thin margins—typically 5–8% EBITDA—struggle to absorb these swings, occasionally reverting to unfilled resin grades when filler economics turn unfavorable [15].

Nano-Filler Regulations Create Compliance Uncertainty

ECHA's nano-material registration requirements under REACH Annex VI impose testing costs of EUR 200,000–500,000 per substance, discouraging small and mid-sized producers of nano-calcium carbonate and nano-silica from entering European channels. Similar scrutiny is emerging in the U.S. under EPA's TSCA new-chemicals program, creating a two-speed regulatory environment that fragments the composite filler materials supply chain [16][19].

Unfilled Engineering Resins Compete in High-Performance Niches

Advances in polyamide and polyetherimide synthesis have narrowed the stiffness gap with filled grades, tempting designers of electronics housings and medical devices to specify unfilled resins that simplify recycling and eliminate filler-related surface defects. This trend erodes roughly 2–3% of addressable volume in premium industrial polymer compounds annually.


Polymer Filler Market Opportunities

Nano-Engineered Functional Fillers for Electronics Miniaturization

The trend in 2.5D and 3D semiconductor packaging demands nano-silica functional fillers with particle sizes below 100 nm for underfill and encapsulant chemicals. The global advanced-packaging market is expected to surpass USD 65 billion by 2030, offering a high-margin channel for specialty mineral fillers producers. [9]


Recycled-Content Calcium Carbonate in Circular Packaging

PPWR recycled content standards provide a demand for calcium carbonate fillers from post consumer PET and HDPE waste streams. Inline filler dosing in mechanical recyclers, a twofold incentive that is sparking pilot projects in Germany, France and the Netherlands [14], delivers 20-25% cost reductions while meeting minimum recycled-content standards.


Emerging-Market Construction Demand in Sub-Saharan Africa

Sub-Saharan Africa is predicted to urbanize at an annual pace of 4.1% through 2035, generating demand for affordable PVC building materials loaded with locally available calcium carbonate fillers. Countries such as Nigeria, Kenya and Tanzania have no local grinding capacity, representing a greenfield opportunity for vertically integrated plastic filler materials producers [20].


Digital Compounding Platforms and Data-Driven Filler Selection

Machine-learning algorithms are being applied in cloud-based formulation platforms to improve filler loading, particle-size distribution and surface treatment, which are shortening development cycles from months to weeks. Licensing these platforms as a service generates recurring-revenue streams for polymer additives providers, while reducing trial-and-error costs for compounders.


Hydrogen-Economy Infrastructure Creates Demand for Specialty Thermoset Fillers

Hydrogen pipelines, storage tanks, and fuel-cell bipolar plates require thermoset composites reinforced with specialty mineral fillers that resist hydrogen embrittlement. With global hydrogen infrastructure investment expected to reach USD 300 billion by 2035, this niche represents a fast-growing frontier for composite filler materials [22].


Polymer Filler Market Future Outlook

AI-Driven Formulation and Smart Compounding

Machine-learning platforms are compressing filler-selection cycles from months to days by predicting optimal particle-size distributions and surface-treatment chemistries for target mechanical properties. By 2030, an estimated 35% of new thermoplastic filler formulations will originate from AI-assisted design, reducing scrap rates and accelerating time-to-market for the Polymer Fillers Market.

Electrification Supercycle and Thermal-Management Compounds

Global EV production is projected to reach 60 million units annually by 2035, creating sustained pull for alumina, boron nitride, and magnesium hydroxide functional fillers that manage heat dissipation in battery packs and power electronics. This supercycle will reshape the competitive landscape of the Polymer Fillers Market, rewarding suppliers that invest in high-purity, thermally conductive mineral fillers [4][13].

Circular-Economy Integration and Post-Consumer Filler Recycling

The EU Green Deal's circular-economy action plan targets 65% municipal-waste recycling by 2035, incentivizing closed-loop systems that recover calcium carbonate fillers from end-of-life PVC products. Mechanical recyclers capable of separating and re-grading mineral fillers will become critical infrastructure nodes, and pilot plants in the Netherlands and Germany are already demonstrating commercial viability [8][14].

Sustainability Reporting and ESG-Linked Procurement

CSRD and ISSB disclosure frameworks are compelling downstream OEMs to audit the embodied carbon of every input material, including polymer additives and reinforcing fillers. Suppliers that publish verified Environmental Product Declarations (EPDs) and achieve EcoVadis Platinum ratings will capture procurement preference, tilting the Polymer Fillers Market toward transparency-driven competition [19][22].


Polymer Filler Market Segmentation

By Product Type

Segment Key Metric Primary Demand Driver
Inorganic Fillers 72.46% share (2025) Cost reduction and stiffness improvement in thermoplastics
Organic Fillers 5.48% CAGR (2026–2035) Bio-based mandates and natural-fiber reinforcement


Inorganic grades dominate the Polymer Fillers Market because calcium carbonate fillers, talc fillers, and precipitated silica deliver a rare combination of low cost, high availability, and measurable property enhancement. Ground calcium carbonate alone commands over 55% of inorganic filler volumes, serving as the default extender-reinforcer in PVC, polyethylene, and polypropylene compounds. Surface-coated grades—treated with stearic acid or titanate coupling agents—improve dispersion and reduce die wear, making them preferred plastic filler materials for high-speed extrusion lines.

Organic fillers, while smaller in absolute volume, are the fastest-growing segment. Natural fibers such as wood flour, hemp, and flax combine low density with favorable life-cycle profiles, positioning them as sustainable reinforcing fillers for automotive door panels, furniture boards, and consumer-goods packaging. Regulatory tailwinds in Europe and growing consumer preference for bio-based products are accelerating the adoption of organic composite filler materials across the Polymer Fillers Market [8][14].

By Polymer Matrix

Segment Key Metric Primary Demand Driver
Thermoplastics 57.16% share (2025) High-volume extrusion and injection-molding applications
Thermosets USD 16.82 billion (2025) Electrical insulation and construction adhesives
Elastomers 5.27% CAGR (2026–2035) EV vibration damping and tire-compound reinforcement


Thermoplastic fillers consumption reflects the sheer scale of polyolefin processing worldwide—polypropylene and polyethylene together consume more mineral fillers than all thermoset and elastomer applications combined. Talc fillers remain the preferred reinforcement for automotive polypropylene, improving heat-deflection temperature by 15–25°C while maintaining impact strength. The Polymer Fillers Market for elastomers is expanding rapidly as EV platforms adopt silicone- and EPDM-based mounts filled with silica and carbon black for vibration isolation [4][13].

By End-User Industry

Segment Key Metric Primary Demand Driver
Building & Construction USD 23.38 billion (2025) PVC pipes, roofing, insulation panels
Automotive & Transportation 5.84% CAGR (2026–2035) Lightweighting, EV components
Packaging 18% share (2025) Film clarity, stiffness, cost reduction
Electrical & Electronics 4.68% CAGR (2026–2035) Encapsulants, thermal-management compounds
Others (Consumer Goods, Medical) USD 4.86 billion (2025) Diverse functional filler applications


Building and construction is the largest end-use channel for the Polymer Fillers Market, driven by global demand for PVC pressure pipes, drainage systems, and vinyl flooring loaded with calcium carbonate fillers. Automotive and transportation applications represent the fastest-growing end-use vertical, as lightweighting imperatives push OEMs to specify talc fillers, glass-fiber mineral fillers, and nano-clay polymer additives in under-hood and structural components [2][3][11].


Regional Market Share Analysis

Region Key Metric Primary Investment Themes
Asia-Pacific 42.08% share (2025) Construction boom, EV supply chains, capacity additions
Europe 24.12% share (2025) Circular economy, automotive lightweighting, REACH compliance
North America 21.04% share (2025) EV incentives, infrastructure renewal, reshoring
South America 7.18% share (2025) Mining integration, packaging growth
Middle East & Africa 5.58% share (2025) Urbanization, pipe infrastructure, import substitution
Total 100%

The Polymer Fillers Market exhibits a clear Asia-Pacific leadership position, with the region's dominance rooted in abundant mineral reserves, low-cost labor, and proximity to fast-growing end-use industries. Europe and North America follow, shaped by regulatory rigor and high-value application portfolios that favor premium reinforcing fillers and functional fillers over commodity extenders.


North America

Country Key Metric Key Driver
US 78% of regional share EV battery housings, infrastructure law spending
Canada 12% of regional share Oil-sands pipeline coatings, residential construction
Mexico 10% of regional share Nearshoring of automotive compounding plants


North America's Polymer Fillers Market benefits from the Inflation Reduction Act's EV tax credits, which channel demand toward lightweight thermoplastic fillers in battery enclosures and structural components. U.S. PVC pipe consumption alone absorbed over 2.8 million metric tons of calcium carbonate fillers in 2024, and reshoring trends are bringing compounding operations closer to OEM assembly plants in the Midwest and Southeast [3][12].

Europe

Country Key Metric Key Driver
Germany 4.48% CAGR (2026–2035) Automotive OEM demand for talc fillers
UK USD 2.14 billion (2025) Construction composites, packaging transition
France 3.92% CAGR (2026–2035) Aerospace thermoset compounds
Italy USD 1.68 billion (2025) Ceramic-tile and packaging filler demand
Spain 3.78% CAGR (2026–2035) Renewable-energy infrastructure
Nordic Countries USD 0.92 billion (2025) Sustainable bio-based fillers
Russia 3.41% CAGR (2026–2035) Domestic import substitution
Rest of Europe USD 2.86 billion (2025) Diversified industrial demand


European regulators are pushing compounders toward recycled-content and bio-based polymer additives, creating premium pricing for surface-treated mineral fillers that maintain performance in post-consumer resin blends. Germany's automotive sector remains the single largest consumer of talc fillers on the continent [8][14].

Asia-Pacific

Country Key Metric Key Driver
China 46% of regional share Largest producer and consumer of calcium carbonate fillers
India 5.92% CAGR (2026–2035) Infrastructure pipeline, affordable housing
Japan USD 3.18 billion (2025) Electronics encapsulants, automotive composites
South Korea 4.82% CAGR (2026–2035) Semiconductor packaging, EV components
ASEAN USD 4.24 billion (2025) Construction, packaging, and consumer goods
Rest of Asia-Pacific 4.14% CAGR (2026–2035) Emerging manufacturing hubs


The Polymer Fillers Market in Asia-Pacific is underpinned by China's dominance in ground calcium carbonate production—Guangxi and Guizhou provinces alone supply roughly 60% of global GCC output. India's National Infrastructure Pipeline is channeling over USD 1.4 trillion into roads, railways, and affordable housing through 2030, pulling massive volumes of plastic filler materials into PVC and HDPE compound applications [11][20].

South America

Country Key Metric Key Driver
Brazil 62% of regional share Packaging, agricultural pipes
Argentina 4.02% CAGR (2026–2035) Mining-sector polymer compounds
Rest of South America USD 1.22 billion (2025) General industrial demand


Brazil's position as the region's largest consumer of industrial polymer compounds reflects its diversified packaging and agribusiness sectors, both heavy users of calcium carbonate fillers in film and pipe applications [20].

Middle East & Africa

Country Key Metric Key Driver
Saudi Arabia 34% of regional share Vision 2030 construction projects
UAE 3.88% CAGR (2026–2035) Real-estate and infrastructure buildout
South Africa USD 0.48 billion (2025) Mining-equipment compounds, packaging
Egypt 4.12% CAGR (2026–2035) New Administrative Capital construction
Rest of MEA USD 0.72 billion (2025) Urbanization-driven pipe demand


Saudi Arabia's Vision 2030 mega-projects—NEOM, the Red Sea Project, and Jeddah Tower—are consuming unprecedented volumes of PVC and polyethylene compounds loaded with mineral fillers for piping, cladding, and insulation applications [20][22].


Polymer Filler Market By Region, 2025-2035

Competitive Benchmarking

The Polymer Fillers Market exhibits medium concentration, with the top five producers collectively holding an estimated 28–34% revenue share. The competitive field includes global mining-to-compounding conglomerates alongside regional specialists that dominate local supply chains. An estimated Herfindahl-Hirschman Index (HHI) of 600–800 confirms a moderately fragmented structure where scale advantages in mineral extraction coexist with niche differentiation in surface treatment and nano-engineering.

Company Est. Revenue Share Range Key Offerings for Polymer Fillers Market Strategic Positioning
Imerys S.A. ~7–10% GCC, talc, kaolin, specialty mineral fillers Vertically integrated mining-to-formulation
Omya AG ~6–9% Calcium carbonate fillers, distribution Global distribution network, technical service
Minerals Technologies Inc. ~4–6% PCC, specialty mineral fillers, talc Satellite PCC plants co-located with paper mills
BASF SE ~3–5% Polymer additives, functional fillers, masterbatches Broad chemical portfolio, R&D depth
Huber Engineered Materials ~3–5% ATH, magnesium hydroxide, specialty fillers Flame-retardant functional fillers leader
Quarzwerke GmbH ~2–4% Silica, quartz, nepheline syenite fillers European specialty-minerals focus
20 Microns Limited ~2–3% Talc, calcium carbonate, kaolin India-focused cost leader
Sibelco NV ~2–4% Silica, nepheline syenite, olivine Diversified industrial minerals portfolio
Calcit d.o.o. ~1–3% GCC, coated calcium carbonate Central European supply chain
Mondo Minerals (Elementis) ~1–3% Talc concentrates, chlorite-free grades Premium talc for automotive and food-contact


Recent News & Developments

  • Imerys S.A. (March 2025): Opened a new 200,000 MT/year surface-treated GCC plant in Telangana, India, targeting the Polymer Fillers Market for PVC pipes and automotive compounds [23].


  • BASF SE (November 2024): Launched a bio-based masterbatch line incorporating rice-husk-ash reinforcing fillers for food-packaging applications in Europe [8].


  • Huber Engineered Materials (June 2024): Introduced a low-smoke magnesium hydroxide filler for EV battery-enclosure compounds, meeting UL 94 V-0 at 55% loading [13].
  • European Commission (April 2024): Published final PPWR text requiring 30% recycled content in plastic packaging by 2030, accelerating demand for recycled-compatible mineral fillers across the Polymer Fillers Market [14].


  • Sibelco NV (December 2023): Signed a joint-venture agreement with a Vietnamese silica producer to supply functional fillers for ASEAN electronics manufacturers [9].


Polymer Filler Market Report Scope

Parameter Detail
Market Scope Global Polymer Fillers Market across product type, polymer matrix, end-user industry, and geography
Study Period 2021–2035
CAGR Window 2026–2035 (4.38%)
Market Size (2025) USD 60.32 Billion
Market Size (2035) USD 91.48 Billion
Fastest Growing Segment Organic fillers (by product type); Elastomers (by polymer matrix); Automotive & Transportation (by end user)
Companies Profiled 10 (Imerys, Omya, Minerals Technologies, BASF, Huber, Quarzwerke, 20 Microns, Sibelco, Calcit, Mondo Minerals)
Valuation Currency USD Billion


FAQs

How do surface-treated calcium carbonate fillers differ from uncoated grades in processing performance?
Surface-treated grades use stearic acid or titanate coatings that reduce moisture absorption and improve dispersion in polyolefin melts. This lowers extruder torque by 10–15% and reduces die-lip buildup, extending run times between maintenance cycles [15].
What testing protocols should buyers specify when sourcing mineral fillers for food-contact packaging?
Buyers should require FDA 21 CFR 177/178 compliance and EU Regulation 10/2011 migration-limit certificates. Third-party extractables testing at 40°C/10 days ensures heavy-metal and organotin levels stay below regulatory thresholds [16].
How does talc particle morphology influence impact strength in polypropylene automotive parts?
Platy talc with a high aspect ratio (>15:1) maximizes flexural modulus but can reduce Charpy impact values. Micro-lamellar grades balance stiffness and toughness by limiting stress-concentrating platelet edges [12].
What are the key cost trade-offs between precipitated and ground calcium carbonate for the Polymer Fillers Market?
Precipitated calcium carbonate (PCC) costs 2–3× more than GCC but delivers finer particle sizes and higher brightness. GCC remains dominant where cost control outweighs surface-finish requirements [15].
Which flame-retardant functional fillers are replacing halogenated additives in the Polymer Fillers Market?
Alumina trihydrate and magnesium hydroxide are the primary halogen-free alternatives, effective at 55–65% loading. They release water vapor endothermically, suppressing flame spread without toxic smoke generation [13].
How should compounders evaluate nano-silica versus conventional silica for the Polymer Fillers Market?
Nano-silica offers 3–5× higher specific surface area, improving tensile strength at lower loadings. However, REACH nano-registration costs and handling complexity limit adoption to high-value applications like electronics encapsulants [9][16].
What supply-chain risks should procurement teams monitor when sourcing talc fillers from Asia-Pacific?
China's Guangxi province supplies over 50% of global talc, exposing buyers to export-quota changes and logistics disruptions. Dual-sourcing from India or Pakistan mitigates concentration risk [18].    
Author
Author
Author Profile
Priya Nagrale LinkedIn
Senior Research Analyst
With an experience of over five years in market research industry (Chemicals & Materials domain), I gather and analyze market data from diverse sources to produce results, which are then presented back to a client. Also, provide recommendations based on the findings. As a Senior Research Analyst, I perform quality checks (QC) for market estimations, QC for reports, and handle queries and work extensively on client customizations. Also, handle the responsibilities of client proposals, report planning, report finalization, and execution

Research Approach

Research Methodology on Polymer Filler Market

The research undertaken to produce this report has made use of both primary and secondary data collection methods. To ensure the accuracy of the information found both methods have been used.

Primary Research

The primary research for this research report has been conducted through in-depth interviews and discussions held with key participants. It has been conducted with top executives in the polymer filler industry. It explored the challenges, opportunities and growth opportunities in the market. It was further used to validate the information gathered during secondary research.

Secondary Research

Secondary research was also conducted to gather further information and data regarding the global polymer filler market. This includes comprehensive research on the product and current market players. This research was used to gain additional insights into the crystalline market. Reports such as annual reports, investor Presentations, press releases, journals, and regional and global databases were the primary focus of the secondary research study.

Study Design

A thorough research methodology was used for this study. The research was conducted by keeping into consideration the main factors such as market size, market share, market growth and competitive landscape. To gain maximum accuracy and to ensure an in-depth analysis of the polymer filler market, the research was conducted on a comprehensive scale.

Analysis Tools

Various analysis tools such as Porter's Five Forces Model were used to analyse the polymer filler market. The data obtained from the primary and secondary sources were then analysed to provide insights into the market through various models.

Data Validation

After the data was collected and analysed, further triangulation methods were used to validate the market figures. This was done by considering the regional figures and cross-referencing them with the overall market figures. This helped in determining the accuracy of the data collected.

Assumptions

The following assumptions have been taken into consideration while performing the research work:

- All the major players in the polymer filler market have been considered

- The assumptions regarding the market size and growth rate of the polymer filler market have been made on the basis of information obtained from secondary sources

- The exchange rate used in this research is the US Dollar/ Euro exchange rate

- The research is based on the assumption that technology will continue to advance and no major disruptive changes will occur in the polymer filler market in the near future

- The research is based on the assumption that demand for polymer fillers in new and emerging applications will remain steady

Scope of the Report

The scope of this report covers the currently known applications of the polymer filler market, including automotive, medical, electronics, and other industrial segments. It also provides an in-depth understanding of the market's drivers, trends, and opportunities in the near future. Additionally, this studies competitive pricing and other key parameters.

Download Free Sample

Kindly complete the form below to receive a free sample of this Report

Download PDF ×

We do not share your information with anyone. However, we may send you emails based on your report interest from time to time. You may contact us at any time to opt-out.
















