Precipitated Silica Market (2026 - 2035)

ID: MRFR/CnM/1468-CR
200 Pages
Chitranshi Jaiswal
Last Updated: July 24, 2026
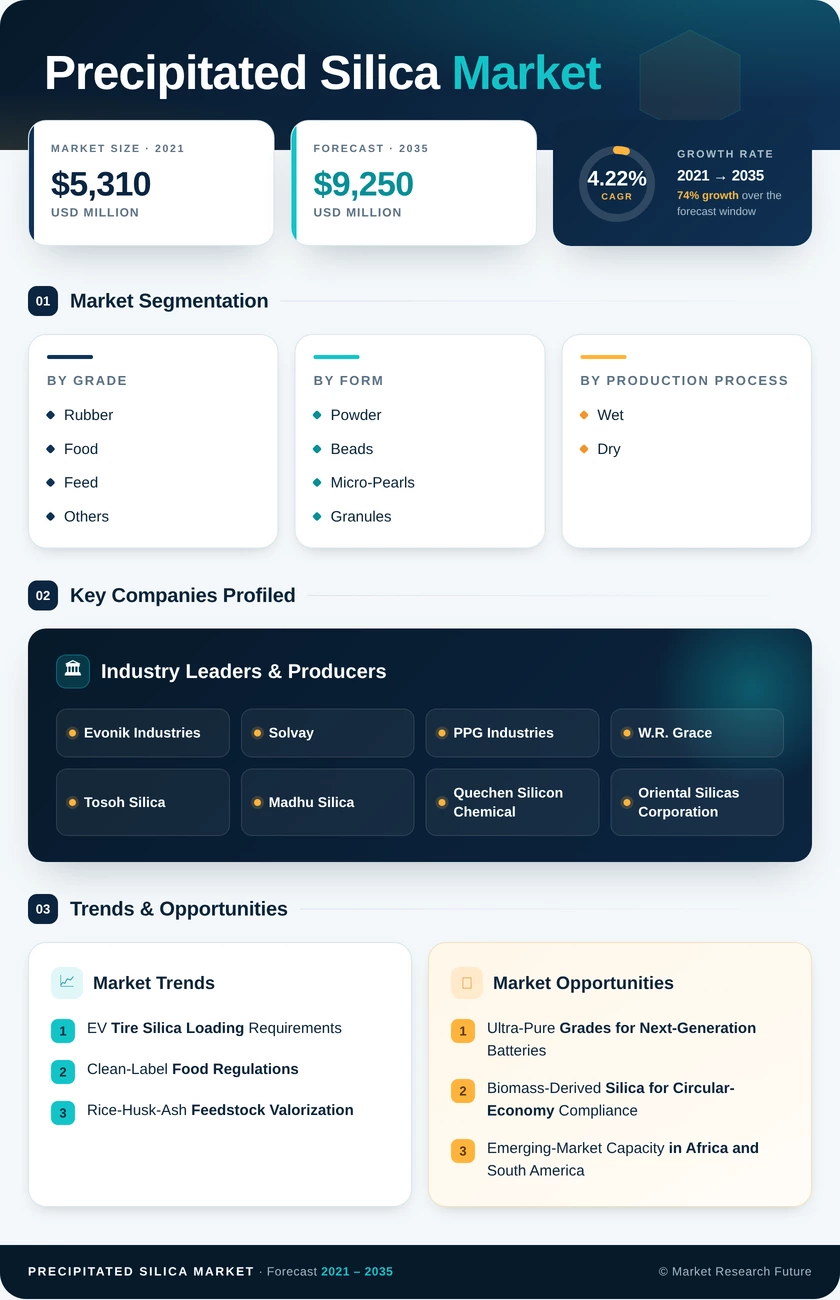
Precipitated Silica Market Research Report Information By Grade (Rubber, Food, Feed, and Others), By Form (Powder, Beads, Micro-Pearls, and Granules), By Production Process (Wet Process and Dry Process), By End-Use Industry (Tires, Oral Care & Cosmetics, Agriculture, Electronics, and Others) – Forecast Till 2035
Precipitated Silica Market
Market Size
Forecast Period2026-2035
CAGR (2026-2035)4.22%
2025 Market SizeUSD 6,120 Million
2035 Market SizeUSD 9,250 Million
Key Players
Evonik Industries
Solvay
PPG Industries
W.R. Grace
Tosoh Silica
Madhu Silica
Opportunities
  • Ultra-Pure Grades for Next-Generation Batteries
  • Biomass-Derived Silica for Circular-Economy Compliance
  • Emerging-Market Capacity in Africa and South America
  1. 1 Market Overview |
    1. 1.1 Study Assumptions & Market Definition |
    2. 1.2 Scope of the Study |
    3. 1.3 Research Methodology
  2. 2 Market Summary & Key Takeaways
  3. 3 Market Dynamics |
    1. 3.1 Market Drivers Analysis | |
      1. 3.1.1 EV Tire Silica Loading Requirements | |
      2. 3.1.2 Clean-Label Food Regulations | |
      3. 3.1.3 Rice-Husk-Ash Feedstock Valorization | |
      4. 3.1.4 Battery-Separator Silica Demand | |
      5. 3.1.5 Oral-Care Premiumization Trends | |
      6. 3.1.6 Green-Chemistry Mandates (REACH, TSCA) | |
      7. 3.1.7 Animal-Feed Silica Supplementation Growth |
    2. 3.2 Market Restraints Analysis | |
      1. 3.2.1 Energy-Intensive Production Economics | |
      2. 3.2.2 Substitution by Fumed Silica and Silica Fume | |
      3. 3.2.3 Sodium-Silicate Feedstock Price Volatility | |
      4. 3.2.4 Tightening Nano-Silica Regulatory Scrutiny | |
      5. 3.2.5 Water-Intensive Wet-Process Waste Streams |
    3. 3.3 Market Opportunity Analysis | |
      1. 3.3.1 Ultra-Pure Grades for Next-Generation Batteries | |
      2. 3.3.2 Biomass-Derived Silica for Circular-Economy Compliance | |
      3. 3.3.3 Emerging-Market Capacity in Africa and South America | |
      4. 3.3.4 Digital Platforms for Silica Procurement | |
      5. 3.3.5 Oral-Care and Personal-Care Premiumization |
    4. 3.4 Industry Value Chain Analysis |
    5. 3.5 Porter's Five Forces Analysis
  4. 4 Global Precipitated Silica Market Size & Forecast (2021–2035) |
    1. 4.1 Historical Market Size (2021–2025) |
    2. 4.2 Current & Forecast Market Size (2026–2035) |
    3. 4.3 Market Size by Revenue (USD Million) |
    4. 4.4 Year-over-Year Growth Analysis
  5. 5 Segmentation Analysis |
    1. 5.1 By Grade | |
      1. 5.1.1 Rubber | |
      2. 5.1.2 Food | |
      3. 5.1.3 Feed | |
      4. 5.1.4 Others |
    2. 5.2 By Form | |
      1. 5.2.1 Powder | |
      2. 5.2.2 Beads | |
      3. 5.2.3 Micro-Pearls | |
      4. 5.2.4 Granules |
    3. 5.3 By Production Process | |
      1. 5.3.1 Wet Process | |
      2. 5.3.2 Dry Process |
    4. 5.4 By End-Use Industry | |
      1. 5.4.1 Tires | |
      2. 5.4.2 Oral Care & Cosmetics | |
      3. 5.4.3 Agriculture | |
      4. 5.4.4 Electronics | |
      5. 5.4.5 Others
  6. 6 Regional Analysis |
    1. 6.1 North America | |
      1. 6.1.1 United States | |
      2. 6.1.2 Canada | |
      3. 6.1.3 Mexico |
    2. 6.2 Europe | |
      1. 6.2.1 Germany | |
      2. 6.2.2 United Kingdom | |
      3. 6.2.3 France | |
      4. 6.2.4 Italy | |
      5. 6.2.5 Spain | |
      6. 6.2.6 Nordic Countries | |
      7. 6.2.7 Russia | |
      8. 6.2.8 Rest of Europe |
    3. 6.3 Asia-Pacific | |
      1. 6.3.1 China | |
      2. 6.3.2 India | |
      3. 6.3.3 Japan | |
      4. 6.3.4 South Korea | |
      5. 6.3.5 ASEAN | |
      6. 6.3.6 Rest of Asia-Pacific |
    4. 6.4 South America | |
      1. 6.4.1 Brazil | |
      2. 6.4.2 Argentina | |
      3. 6.4.3 Rest of South America |
    5. 6.5 Middle East & Africa | |
      1. 6.5.1 Saudi Arabia | |
      2. 6.5.2 UAE | |
      3. 6.5.3 South Africa | |
      4. 6.5.4 Egypt | |
      5. 6.5.5 Rest of MEA
  7. 7 Competitive Landscape |
    1. 7.1 Market Share Analysis (2025) |
    2. 7.2 Competitive Benchmarking Matrix |
    3. 7.3 Company Profiles | |
      1. 7.3.1 Evonik Industries | |
      2. 7.3.2 Solvay | |
      3. 7.3.3 PPG Industries | |
      4. 7.3.4 W.R. Grace | |
      5. 7.3.5 Tosoh Silica | |
      6. 7.3.6 Madhu Silica | |
      7. 7.3.7 Quechen Silicon Chemical | |
      8. 7.3.8 Oriental Silicas Corporation | |
      9. 7.3.9 Wacker Chemie | |
      10. 7.3.10 Huber Engineered Materials
  8. 8 Future Outlook & Strategic Recommendations (2026–2035) |
    1. 8.1 Electrification Supercycle and Tire Reformulation |
    2. 8.2 Sustainability Reporting and Scope 3 Procurement |
    3. 8.3 AI-Driven Process Optimization |
    4. 8.4 Platform Consolidation and M&A Activity
  9. 9 Recent Developments & News
  10. 10 Frequently Asked Questions (FAQs)
  11. 11 Report Scope & Methodology |
    1. 11.1 Study Period & Base Year |
    2. 11.2 Data Sources & Citations |
    3. 11.3 Abbreviations
  12. 12 LIST OF TABLES |
  13. TABLE 1 Global Precipitated Silica Market Size & Forecast, by Revenue (USD Million), 2021–2035 |
  14. TABLE 2 Global Precipitated Silica Market — Year-over-Year Growth Analysis, 2021–2035 |
  15. TABLE 3 Global Precipitated Silica Market — Driver Impact Analysis |
  16. TABLE 4 Global Precipitated Silica Market — Restraint Impact Analysis |
  17. TABLE 5 Global Precipitated Silica Market Size, by Grade, 2021–2035 (USD Million) |
  18. TABLE 6 Global Precipitated Silica Market Size, by Form, 2021–2035 (USD Million) |
  19. TABLE 7 Global Precipitated Silica Market Size, by Production Process, 2021–2035 (USD Million) |
  20. TABLE 8 Global Precipitated Silica Market Size, by End-Use Industry, 2021–2035 (USD Million) |
  21. TABLE 9 Global Precipitated Silica Market Size, by Region, 2021–2035 (USD Million) |
  22. TABLE 10 North America Precipitated Silica Market Size, by Country, 2021–2035 (USD Million) |
  23. TABLE 11 Europe Precipitated Silica Market Size, by Country, 2021–2035 (USD Million) |
  24. TABLE 12 Asia-Pacific Precipitated Silica Market Size, by Country, 2021–2035 (USD Million) |
  25. TABLE 13 South America Precipitated Silica Market Size, by Country, 2021–2035 (USD Million) |
  26. TABLE 14 Middle East & Africa Precipitated Silica Market Size, by Country, 2021–2035 (USD Million) |
  27. TABLE 15 Competitive Benchmarking Matrix — Global Precipitated Silica Market, 2025 |
  28. TABLE 16 Company Profiles — Key Players, Global Precipitated Silica Market |
  29. TABLE 17 Recent Developments & Strategic Announcements, 2023–2025 |
  30. TABLE 18 Regional Summary — Precipitated Silica Market Share & Investment Themes |
  31. TABLE 19 Report Scope & Methodology Summary |
  32. TABLE 20 Detailed Sources and Citations
  33. 13 LIST OF FIGURES |
  34. FIGURE 1 Global Precipitated Silica Market Dynamics — Drivers, Restraints, and Opportunities |
  35. FIGURE 2 Industry Value Chain Analysis — Precipitated Silica Market |
  36. FIGURE 3 Porter's Five Forces Analysis — Precipitated Silica Market |
  37. FIGURE 4 Global Precipitated Silica Market Size Trend (USD Million), 2021–2035 |
  38. FIGURE 5 Precipitated Silica Market Share, by Grade, 2025 (%) |
  39. FIGURE 6 Precipitated Silica Market Share, by Form, 2025 (%) |
  40. FIGURE 7 Precipitated Silica Market Share, by Production Process, 2025 (%) |
  41. FIGURE 8 Precipitated Silica Market Share, by End-Use Industry, 2025 (%) |
  42. FIGURE 9 Precipitated Silica Market Share, by Region, 2025 (%) |
  43. FIGURE 10 North America Precipitated Silica Market Share, by Country, 2025 (%) |
  44. FIGURE 11 Europe Precipitated Silica Market Share, by Country, 2025 (%) |
  45. FIGURE 12 Asia-Pacific Precipitated Silica Market Share, by Country, 2025 (%) |
  46. FIGURE 13 South America Precipitated Silica Market Share, by Country, 2025 (%) |
  47. FIGURE 14 Middle East & Africa Precipitated Silica Market Share, by Country, 2025 (%) |
  48. FIGURE 15 Competitive Landscape — Market Concentration and Revenue Share, 2025

Segmentation Quick Reference

DimensionSub-SegmentsDominant SegmentFastest Growing Segment
By GradeRubber, Food, Feed, OthersRubber (58.2% share, 2025)Food (4.90% CAGR)
By FormPowder, Beads, Micro-Pearls, GranulesPowder (51.8% share, 2025)Beads (6.80% CAGR)
By Production ProcessWet, DryWet (70.4% share, 2025)Dry (5.25% CAGR)
By End-Use IndustryTires, Oral Care & Cosmetics, Agriculture, Electronics, OthersTires (33.2% share, 2025)Electronics (4.80% CAGR)


Market Segmentation Overview

By Grade

Sub-SegmentKey Trend
RubberEV tire programs driving demand for highly dispersible silica (HDS) grades
FoodEFSA and FDA regulatory clarity accelerating clean-label adoption
FeedLivestock-nutrition supplementation expanding in Asia-Pacific and South America
OthersSpecialty coatings and adhesive applications growing steadily


Rubber grade continues to anchor the Precipitated Silica Market, accounting for the majority of global volume. The transition from carbon-black-dominant to silica-dominant tire formulations — driven by green-tire mandates and EV platform requirements — ensures sustained demand growth through 2035.

By Form

Sub-SegmentKey Trend
PowderBroadest compatibility across rubber, food, and coatings end uses
BeadsControlled-release oral-care and cosmetics applications fueling rapid growth
Micro-PearlsDust-free handling preferred in coatings and sealant manufacturing
GranulesAnimal-feed carrier and agricultural applications expanding regionally


Powder form maintains its dominant position because existing mixing infrastructure at tire plants and food-processing facilities is optimized for powder inputs. Beads are gaining share as oral-care brands demand precise abrasivity profiles for premium whitening formulations.

By Production Process

Sub-SegmentKey Trend
Wet ProcessEstablished technology with scale advantages for high-volume rubber grades
Dry ProcessLower energy intensity and ultra-high purity enabling battery-separator applications


The wet process remains the industry standard for large-tonnage production, but dry-process technologies are gaining strategic importance as battery manufacturers specify silica coatings with SiO₂ purity exceeding 99.5%.

By End-Use Industry

Sub-SegmentKey Trend
TiresEV adoption and Euro 7 labeling driving silica loading above 80 phr
Oral Care & CosmeticsPremiumization and whitening trends supporting high-margin silica demand
AgricultureFeed-carrier and crop-protection uses expanding in emerging economies
ElectronicsBattery-separator and electronic-encapsulation demand accelerating
OthersPaints, paper, and industrial coatings contributing stable baseline demand


Tires represent the single largest end-use application, and the structural shift toward silica-loaded green-tire compounds ensures this segment will remain central to the Precipitated Silica Market throughout the forecast period.


 

Download PDF ×

We do not share your information with anyone. However, we may send you emails based on your report interest from time to time. You may contact us at any time to opt-out.