Segmentation Quick Reference
| Dimension | Sub-Segments | Dominant Segment | Fastest Growing Segment |
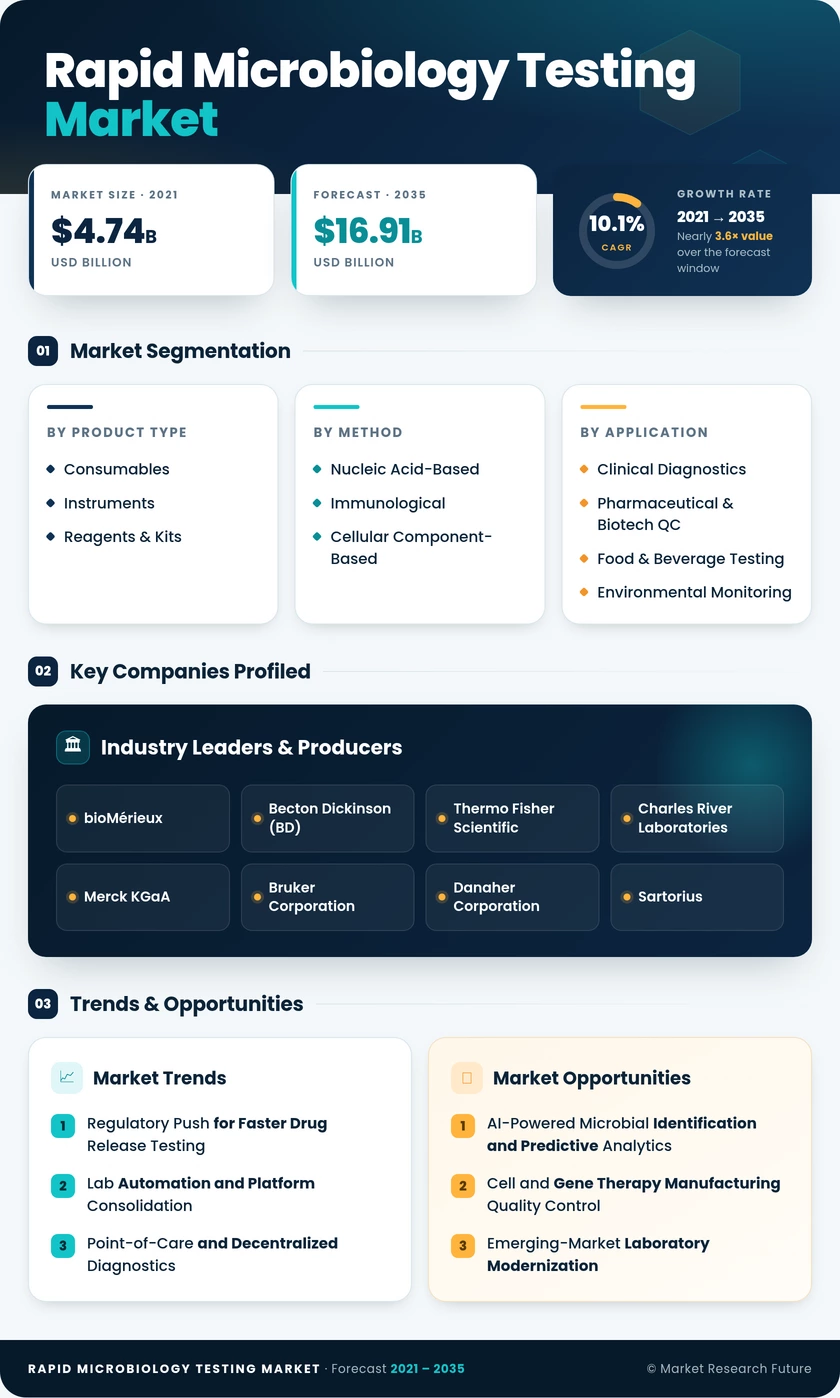
| Product Type | Consumables, Instruments, Reagents & Kits | Consumables (49.1% share, 2025) | Instruments (11.6% CAGR) |
| Method | Nucleic Acid-Based, Immunological, Cellular Component-Based | Nucleic Acid-Based (57.8% share, 2025) | Immunological (11.4% CAGR) |
| Application | Clinical Diagnostics, Pharmaceutical & Biotech QC, Food & Beverage Testing, Environmental Monitoring | Clinical Diagnostics (49.2% share, 2025) | Pharmaceutical & Biotech QC (12.9% CAGR) |
| End User | Clinical Laboratories, Pharmaceutical & Biotech Companies, Food & Beverage Processors, Academic & Research Institutions | Clinical Laboratories (52.5% share, 2025) | Pharmaceutical & Biotech Companies (12.8% CAGR) |
| Geography | North America, Europe, Asia-Pacific, South America, Middle East & Africa | North America (42.0% share, 2025) | Asia-Pacific (10.8% CAGR) |
Market Segmentation Overview
By Product Type
| Sub-Segment | Key Trend |
| Consumables | Closed-ecosystem reagent models drive recurring revenue and vendor retention. |
| Instruments | Automation capex cycle fueled by greenfield APAC labs and legacy replacements. |
| Reagents & Kits | Molecular assay proliferation expands kit volumes across clinical and industrial settings. |
Consumables remain the revenue foundation of the market due to the razor-and-blade model embedded in automated microbiology platforms. Instruments are gaining share as automation becomes a strategic priority for high-volume laboratories seeking to offset staffing shortages and improve turnaround times.
By Method
| Sub-Segment | Key Trend |
| Nucleic Acid-Based | PCR panel consolidation and falling sequencing costs expand addressable use cases |
| Immunological | Lateral-flow and ELISA formats enable decentralized, low-infrastructure deployment. |
| Cellular Component-Based | ATP bioluminescence and flow cytometry serve niche environmental and pharma applications |
Nucleic acid-based technologies lead because molecular diagnostics are the clinical standard for high-sensitivity pathogen identification. Immunological methods are closing the gap in settings where speed, portability, and cost-per-test matter more than multi-pathogen capability.
By Application
| Sub-Segment | Key Trend |
| Clinical Diagnostics | Blood-culture and respiratory-panel volumes anchor the largest application pool. |
| Pharmaceutical & Biotech QC | Annex 1 and USP <71> enforcement accelerates migration from compendial methods |
| Food & Beverage Testing | FSMA and international export standards mandate sub-2-hour pathogen detection |
| Environmental Monitoring | Drinking-water directives and cleanroom compliance expand regulatory scope. |
Clinical diagnostics generates the highest absolute revenue due to sheer test volume. At the same time, pharmaceutical QC is the fastest-growing application as manufacturers convert from legacy sterility methods to validated rapid alternatives.
By End User
| Sub-Segment | Key Trend |
| Clinical Laboratories | Centralized reference labs and hospital networks consolidate testing volume. |
| Pharmaceutical & Biotech Companies | In-house QC lab buildout reduces outsourcing dependency. |
| Food & Beverage Processors | Supply-chain liability drives investment in on-site rapid screening. |
| Academic & Research Institutions | Microbiome and AMR research grants fund instrument procurement |
Clinical laboratories dominate end-user spending because they aggregate demand across multiple clinical specialties. Pharmaceutical companies are the fastest-growing end-user segment as regulatory and competitive pressures incentivize in-house rapid-testing capabilities.