• Cat-intel
  • MedIntelliX
  • Resources
  • About Us
  • Hero Background
    English
    Chinese
    French
    Japanese
    Korean
    German
    Spanish

    Sand Screen Market Share

    ID: MRFR/E&P/1060-HCR
    120 Pages
    Anshula Mandaokar
    October 2025

    Sand Screen Market Research Report Information Report by Type (Stand Alone, Remedial or Artificial Lift Protection), by Well Type (Land and Offshore), By Application (Oil and Gas, Mining, Construction, Water Treatment, Others), By Mesh Size (Fine, Medium, Coarse), By Material (Steel, Polyurethane, Plastic, Others), By Installation (New Installation, Retrofit),and by Region - Forecast to 2035

    Share:
    Download PDF ×

    We do not share your information with anyone. However, we may send you emails based on your report interest from time to time. You may contact us at any time to opt-out.

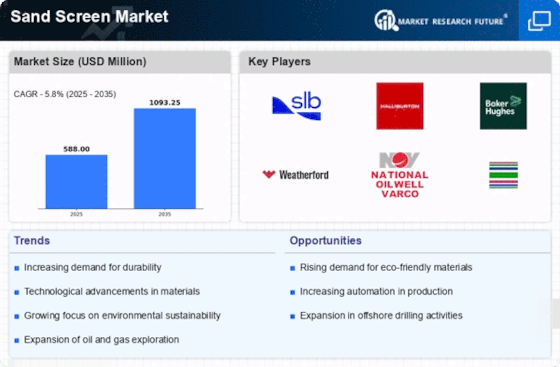
    Sand Screen Market Infographic
    $ 4,950.0
    $ 5,950.0
    $ 7,250.0

    Market Share

    Sand Screen Market Share Analysis

    The sand screen market has experienced noteworthy trends in recent times, reflecting the changing dynamics in the oil and gas industry and its associated activities. One key trend in this market is the increasing demand for advanced sand screens with enhanced capabilities. As oil and gas exploration ventures into more challenging environments, the need for effective sand control solutions has become paramount. Manufacturers are responding by developing innovative sand screens equipped with advanced technologies to optimize sand control in well completions. These screens are designed to withstand harsh conditions and provide efficient filtration, ensuring the smooth operation of oil and gas wells. Another notable trend in the sand screen market is the growing focus on environmental sustainability and cost-efficiency. As the industry faces increased scrutiny for its environmental impact, there is a shift towards sustainable practices. This trend is influencing the development of sand screens that not only offer effective sand control but also adhere to eco-friendly standards. Additionally, there is an emphasis on cost-effective solutions, prompting manufacturers to explore materials and designs that reduce overall installation and maintenance expenses. The increasing adoption of hydraulic fracturing, commonly known as fracking, has also impacted the sand screen market. Fracking is a technique used to extract oil and gas from unconventional reservoirs, and it involves the injection of proppants, including sand, into wells to enhance productivity. This has led to a surge in the demand for high-quality sand screens that can withstand the abrasive nature of proppants and ensure uninterrupted production. The sand screen market is witnessing innovations to meet the specific requirements of fracking operations, driving the development of durable and efficient screens. Furthermore, the market is experiencing a trend towards customization and tailored solutions. Each oil and gas reservoir presents unique challenges, and operators are increasingly seeking sand screens that can be customized to specific well conditions. This trend is pushing manufacturers to offer a variety of screen configurations, sizes, and materials to accommodate the diverse needs of well completions. The ability to provide tailored solutions enhances the overall efficiency of sand control systems and contributes to the success of oil and gas projects. Technological advancements play a crucial role in shaping the sand screen market. The integration of smart technologies and sensors into sand screens is gaining traction. Smart sand screens enable real-time monitoring of well conditions, allowing operators to make informed decisions and optimize production. This trend aligns with the broader industry shift towards digitalization and the Internet of Things (IoT), contributing to the development of more intelligent and connected sand control solutions. Market consolidation is also a discernible trend in the sand screen market. As the industry evolves, companies are engaging in mergers, acquisitions, and strategic partnerships to strengthen their market presence and offer comprehensive sand control solutions. This trend is driven by the need to provide end-to-end services and address the complete lifecycle of oil and gas wells. Market consolidation fosters collaboration and innovation, positioning companies to better meet the evolving needs of the oil and gas sector. In conclusion, the sand screen market is undergoing significant transformations driven by the demands of the oil and gas industry. The trends towards advanced technologies, sustainability, customization, and market consolidation are shaping the landscape of sand control solutions. As the industry continues to evolve, manufacturers are expected to focus on developing sand screens that not only address current challenges but also anticipate future needs in the dynamic world of oil and gas exploration and production.

    Market Summary

    The Global Sand Screens Market is projected to grow from 608.9 USD Million in 2024 to 1080.9 USD Million by 2035, reflecting a robust growth trajectory.

    Key Market Trends & Highlights

    Sand Screens Key Trends and Highlights

    • The market is expected to achieve a compound annual growth rate of 5.36 percent from 2025 to 2035.
    • By 2035, the market valuation is anticipated to reach 1080.9 USD Million, indicating substantial growth opportunities.
    • In 2024, the market is valued at 608.9 USD Million, highlighting its current economic significance.
    • Growing adoption of advanced filtration technologies due to increasing environmental regulations is a major market driver.

    Market Size & Forecast

    2024 Market Size 608.9 (USD Million)
    2035 Market Size 1080.9 (USD Million)
    CAGR (2025-2035) 5.36%
    Largest Regional Market Share in 2024 latin_america)

    Major Players

    SKF, Trelleborg, Freudenberg Sealing Technologies, Dana Holding, Federal-Mogul, Dichtungstechnik, Henniges Automotive, KACO GmbH + Co. KG

    Market Trends

    The demand for advanced sand screens is expected to rise as operators seek to enhance well productivity and reduce operational costs in increasingly complex reservoir environments.

    U.S. Energy Information Administration (EIA)

    Sand Screen Market Market Drivers

    Market Growth Projections

    Technological Advancements

    Technological innovations play a crucial role in shaping the Global Sand Screens Market Industry. The development of advanced materials and designs enhances the performance and durability of sand screens, making them more effective in various applications. For instance, the introduction of composite materials and improved manufacturing techniques allows for better filtration and resistance to harsh environments. These advancements not only improve the efficiency of sand screens but also contribute to cost savings for operators. As the industry embraces these technologies, the Global Sand Screens Market Industry is poised for growth, with a projected CAGR of 5.36% from 2025 to 2035, indicating a robust future.

    Rising Demand for Oil and Gas

    The Global Sand Screens Market Industry experiences a notable surge in demand driven by the oil and gas sector. As exploration and production activities intensify, the need for effective sand control solutions becomes paramount. In 2024, the market is projected to reach 608.9 USD Million, reflecting the industry's reliance on sand screens to enhance well productivity and prevent sand-related issues. This trend is likely to continue, with the market expected to grow significantly as oil prices stabilize and investments in upstream activities increase. The Global Sand Screens Market Industry thus stands to benefit from this heightened demand, which is essential for maintaining operational efficiency.

    Growth in Unconventional Resources

    The exploration and production of unconventional resources, such as shale gas and tight oil, significantly impact the Global Sand Screens Market Industry. These resources often require advanced sand control techniques due to their unique geological characteristics. As companies increasingly invest in unconventional resource development, the demand for effective sand screens rises correspondingly. This trend is expected to drive market growth, with projections indicating that the Global Sand Screens Market Industry could reach 1080.9 USD Million by 2035. The ability to manage sand production effectively in these challenging environments is crucial for maximizing recovery rates and ensuring operational success.

    Expansion of the Construction Sector

    The construction sector's expansion contributes to the growth of the Global Sand Screens Market Industry. As infrastructure projects increase globally, the demand for sand as a construction material rises, leading to a parallel need for sand control solutions in various applications. The integration of sand screens in construction processes helps manage sand flow and enhances the stability of structures. This trend is particularly evident in regions experiencing rapid urbanization and development. Consequently, the Global Sand Screens Market Industry is likely to benefit from this construction boom, as the need for effective sand management solutions becomes increasingly critical.

    Increasing Environmental Regulations

    The Global Sand Screens Market Industry is influenced by the tightening of environmental regulations aimed at minimizing the ecological impact of drilling activities. Governments worldwide are implementing stricter guidelines to ensure sustainable practices in oil and gas extraction. This regulatory landscape compels companies to adopt advanced sand control technologies that align with environmental standards. As a result, the demand for high-quality sand screens that meet these regulations is likely to rise. The Global Sand Screens Market Industry must adapt to these changes, positioning itself as a leader in providing environmentally friendly solutions that comply with emerging regulations.

    Market Segment Insights

    To provide insights about factors affecting the market growth

    To Analyze the Sand screen market based on various factors- price analysis, supply chain analysis, Porters five force analysis.

    To provide historical and forecast revenue of the market segments and sub-segments with respect to six main geographies and their countries- North America, Europe, Asia-Pacific, South America, Middle East, and Africa

    To provide country level analysis of the market with respect to the current market size and future prospective

    To provide country level analysis of the market for segment by Type, by Well Type, and by region as well as its sub segments

    Get more detailed insights about Sand Screen Market Research Report - Forecast to 2030

    Regional Insights

    Key Companies in the Sand Screen Market market include

    Industry Developments

    Future Outlook

    Sand Screen Market Future Outlook

    The Sand Screens Market is projected to grow at a 5.36% CAGR from 2024 to 2035, driven by increasing demand for efficient filtration solutions and advancements in material technology.

    New opportunities lie in:

    • Invest in R&D for advanced composite materials to enhance durability and performance.
    • Expand service offerings to include installation and maintenance for competitive differentiation.
    • Leverage digital technologies for predictive analytics in sand screen performance monitoring.

    By 2035, the Sand Screens Market is expected to exhibit robust growth, reflecting evolving industry needs and technological advancements.

    Market Segmentation

    Report Scope

    Attribute/Metric Details
    Market Size 2022 USD 525.3 Million
    Market Size 2030 USD 815.37 Million
    Compound Annual Growth Rate (CAGR)   5.8% (2024-2030)
    Base Year   2023
    Forecast Period   2024-2030
    Historical Data   2019 & 2020
    Forecast Units   Value (USD Million)
    Report Coverage   Revenue Forecast, Competitive Landscape, Growth Factors, and Trends
    Segments Covered  Type, Well Type, Application, Mesh Size, Material and Installation
     Geographies       Covered   North America, Europe, Asia-Pacific, and Rest of the World (RoW)
     Key Vendors   SKF, Trelleborg, Freudenberg Sealing Technologies, Dana Holding, Federal-Mogul, Dichtungstechnik, Henniges Automotive, and KACO GmbH + Co. KG
      Key Market Opportunities   stabilization of oil and gas industry
     Key Market Drivers   recent increase in onshore and offshore exploration activities
     

    Market Highlights

    Author

    Anshula Mandaokar
    Team Lead - Research

    She holds an experience of about 6+ years in market research and business consulting, working under the spectrum of information communication technology, telecommunications and semiconductor domains. aarti conceptualizes and implements a scalable business strategy and provides strategic leadership to the clients. her expertise lies in market estimation, competitive intelligence, pipeline analysis, customer assessment, etc.

    Leave a Comment

    Latest Comments

    John Doe
    john@example.com

    This is a great article! Really helped me understand the topic better.

    Posted on July 23, 2025, 10:15 AM
    Jane Smith
    jane@domain.com

    Thanks for sharing this. I’ve bookmarked it for later reference.

    Posted on July 22, 2025, 7:45 PM

    FAQs

    What are the key regions grossing the most of the market share?

    North America, Europe, Asia-Pacific, South America, Middle East, and Africa are the key regions grossing the most of the market share.

    What are the segments of the market?

    The type and well type are the segments of the market.

    What are the main reasons of market’s growth?

    The oil and gas industry witnessed stabilization and the prices are steadily rising which is one of the main reasons driving the sand screen market.

    What is the growth of the market recorded?

    2024-2030 is the growth period of the market recorded.

    Who are the key players of the market?

    Freudenberg Sealing Technologies, SKF, Trelleborg, Federal-Mogul, Dichtungstechnik, Henniges Automotive, Dana Holding, and KACO GmbH + Co. KG are the key drivers of the market.

    1. Table of Contents
    2. SECTION I: Executive Summary AND KEY HIGHLIGHTS
    3. EXECUTIVE’S HANDBOOK
      1. The Top Performing Segments
      2. Key Trends Summarized
      3. Strategic Insights
      4. Who are the Key Players in the Market?
    4. SECTION II: SCOPING, METHODOLOGY AND MARKET STRUCTURE
    5. Market Introduction
      1. Definition
      2. Report Segmentation & Scope
      3. Regional & Country Level Coverage
      4. Why you need this report?
    6. Research Methodology
      1. Research Process
      2. Secondary Research
        1. Data Mining & Condensation
        2. Sources (Associations, Organizations, Magazines, Paid Databases)
      3. Primary Research
        1. Sample Size (Demand-Supply, Company Type, Designations, Region)
        2. Sources
      4. Factorial Analysis & Approach Setting
      5. Estimation & Forecast Models
      6. Pricing Baskets
      7. Analyst Hours & Team
    7. SECTION III: QUALITATIVE ANALYSIS
    8. MARKET DYNAMICS
      1. Introduction
      2. Growth Parameters Mapped - Drivers
        1. Oil and Gas Industry recovery
        2. Growing onshore and offshore exploration activities
      3. What are the challenges faced by Industry Participants?
        1. Need to prevent contamination
      4. Opportunities
        1. Ongoing research and development efforts
      5. Regulatory Update
      6. Impact Analysis of COVID-19
        1. Impact on Supply Chain of Sand Screen
        2. Impact on Market Demand of Sand Screen
    9. MARKET FACTOR ANALYSIS
      1. Supply/Value Chain Analysis
        1. Participants
        2. Value Percolation Across the Chain
        3. Integration Levels
        4. Key Issues Addressed
      2. Porter’s Five Forces Model
        1. Bargaining Power of Suppliers
        2. Bargaining Power of Buyers
        3. Threat of New Entrants
        4. Threat of Substitutes
        5. Intensity of Rivalry
    10. SECTION IV: QUANTITATIVE ANALYSIS
    11. GLOBAL SAND SCREEN MARKET, BY TYPE (USD MILLION)
      1. Introduction
      2. Standalone
        1. Global Sand Screen Market Size: Market Estimates & Forecast, By Standalone, 2018-2032
      3. Remedial
        1. Global Sand Screen Market Size: Market Estimates & Forecast, By Remedial, 2018-2032
      4. Artificial Lift Protection
        1. Global Sand Screen Market Size: Market Estimates & Forecast, By Artificial Lift Protection, 2018-2032
    12. GLOBAL SAND SCREEN MARKET, BY WELL TYPE (USD MILLION)
      1. Introduction
      2. Land
        1. Global Sand Screen Market Size: Market Estimates & Forecast, By Land, 2018-2032
      3. Offshore
        1. Global Sand Screen Market Size: Market Estimates & Forecast, By Offshore, 2018-2032
    13. GLOBAL SAND SCREEN MARKET, BY REGION (USD MILLION)
      1. Introduction
      2. North America
        1. North America Sand Screen Market Size: Market Estimates & Forecast, By Country, 2018-2032
        2. North America Sand Screen Market Size: Market Estimates & Forecast, By Type, 2018-2032
        3. North America Sand Screen Market Size: Market Estimates & Forecast, By Well Type, 2018-2032
        4. US
        5. Canada
        6. Mexico
      3. Europe
        1. Europe Sand Screen Market Size: Market Estimates & Forecast, By Country, 2018-2032
        2. Europe Sand Screen Market Size: Market Estimates & Forecast, By Type, 2018-2032
        3. Europe Sand Screen Market Size: Market Estimates & Forecast, By Well Type, 2018-2032
        4. Germany
        5. France
        6. UK
        7. Spain
        8. Italy
        9. Rest of Europe
      4. Asia-Pacific
        1. Asia-Pacific Sand Screen Market Size: Market Estimates & Forecast, By Country, 2018-2032
        2. Asia-Pacific Sand Screen Market Size: Market Estimates & Forecast, By Type, 2018-2032
        3. Asia-Pacific Sand Screen Market Size: Market Estimates & Forecast, By Well Type, 2018-2032
        4. China
        5. India
        6. Japan
        7. South Korea
        8. Rest of Asia-Pacific
      5. Middle East & Africa
        1. Middle East & Africa Sand Screen Market Size: Market Estimates & Forecast, By Country, 2018-2032
        2. Middle East & Africa Sand Screen Market Size: Market Estimates & Forecast, By Type, 2018-2032
        3. Middle East & Africa Sand Screen Market Size: Market Estimates & Forecast, By Well Type, 2018-2032
        4. GCC Countries
        5. South Africa
        6. Rest of Middle East & Africa
      6. South America
        1. South America Sand Screen Market Size: Market Estimates & Forecast, By Country, 2018-2032
        2. South America Sand Screen Market Size: Market Estimates & Forecast, By Type, 2018-2032
        3. South America Sand Screen Market Size: Market Estimates & Forecast, By Well Type, 2018-2032
        4. Brazil
        5. Argentina
        6. Rest of South America
    14. SECTION V: COMPETITIVE ANALYSIS
    15. Competitive Landscape
      1. Introduction
      2. Competition Dashboard
      3. Company Market Share Analysis, 2023
      4. Who are the market disruptors & innovators?
      5. What strategies are being adopted by market leaders?
      6. Competitive Benchmarking
      7. The Leading Player in terms of Number of Developments in the Global Sand Screen Market
      8. List of Key Players, By Region
      9. Public Players Stock Summary
      10. Comparative Analysis: Key Players Financial
      11. Key Developments & Growth Strategies
        1. New Product Launch/Service Deployment
        2. Merger & Acquisition
        3. Joint Ventures
    16. COMPANY PROFILES
      1. SKF
        1. Company Overview
        2. Financial Overview
        3. Product Offered
        4. Key Developments
        5. SWOT Analysis
        6. Key Strategies
      2. Trelleborg
        1. Company Overview
        2. Financial Overview
        3. Product Offered
        4. Key Developments
        5. SWOT Analysis
        6. Key Strategies
      3. Freudenberg Sealing Technologies
        1. Company Overview
        2. Financial Overview
        3. Product Offered
        4. Key Developments
        5. SWOT Analysis
        6. Key Strategies
      4. Dana Holding
        1. Company Overview
        2. Financial Overview
        3. Product Offered
        4. Key Developments
        5. SWOT Analysis
        6. Key Strategies
      5. Federal-Mogul
        1. Company Overview
        2. Financial Overview
        3. Product Offered
        4. Key Developments
        5. SWOT Analysis
        6. Key Strategies
      6. GFD
        1. Company Overview
        2. Financial Overview
        3. Product Offered
        4. Key Developments
        5. SWOT Analysis
        6. Key Strategies
      7. Henniges Automotive
        1. Company Overview
        2. Financial Overview
        3. Product Offered
        4. Key Developments
        5. SWOT Analysis
        6. Key Strategies
      8. KACO GmbH + Co. KG
        1. Company Overview
        2. Financial Overview
        3. Product Offered
        4. Key Developments
        5. SWOT Analysis
        6. Key Strategies
      9. Halliburton
        1. Company Overview
        2. Financial Overview
        3. Product Offered
        4. Key Developments
        5. SWOT Analysis
        6. Key Strategies
      10. Weatherford
        1. Company Overview
        2. Financial Overview
        3. Product Offered
        4. Key Developments
        5. SWOT Analysis
        6. Key Strategies
    17. RECOMMENDATIONS & EXPERT INSIGHTS
      1. What is the short-term vs long-term outlook for Sand Screen Market?
      2. Who are the players to look out for?
      3. What will the product mix look in coming years?
    18. MRFR OFFERINGS & TEAM
      1. Citations & Media
      2. Our Regional Representatives
      3. Related Reports
      4. Our Domain Coverage
    19. NOTE:
    20. This table of content is tentative and subject to change as the research progresses.
    21.  In section 10, each company will be profiled based on the Market Overview, Financials, Product Portfolio, Business Strategies, and Recent Developments parameters.
    22.  Please note: The financial details of the company cannot be provided if the information is not available in the public domain and or from reliable sources.
    23. List of Tables and Figures
      1. LIST OF TABLES
      2. TABLE 1. LIST OF ASSUMPTIONS
      3. TABLE 2. GLOBAL SAND SCREEN MARKET ESTIMATES & FORECAST, BY TYPE, 2018-2032 (USD MILLION)
      4. TABLE 3. GLOBAL SAND SCREEN MARKET ESTIMATES & FORECAST, BY WELL TYPE, 2018-2032 (USD MILLION)
      5. TABLE 4. GLOBAL SAND SCREEN MARKET, BY REGION, 2018-2032 (USD MILLION)
      6. TABLE 5. NORTH AMERICA: SAND SCREEN MARKET, BY COUNTRY, 2018-2032 (USD MILLION)
      7. TABLE 6. NORTH AMERICA: SAND SCREEN MARKET, BY TYPE, 2018-2032 (USD MILLION)
      8. TABLE 7. NORTH AMERICA: SAND SCREEN MARKET, BY WELL TYPE, 2018-2032 (USD MILLION)
      9. TABLE 8. U.S.: SAND SCREEN MARKET, BY TYPE, 2018-2032 (USD MILLION)
      10. TABLE 9. U.S.: SAND SCREEN MARKET, BY WELL TYPE, 2018-2032 (USD MILLION)
      11. TABLE 10. CANADA: SAND SCREEN MARKET, BY TYPE, 2018-2032 (USD MILLION)
      12. TABLE 11. CANADA: SAND SCREEN MARKET, BY WELL TYPE, 2018-2032 (USD MILLION)
      13. TABLE 12. MEXICO: SAND SCREEN MARKET, BY TYPE, 2018-2032 (USD MILLION)
      14. TABLE 13. MEXICO: SAND SCREEN MARKET, BY WELL TYPE, 2018-2032 (USD MILLION)
      15. TABLE 14. EUROPE: SAND SCREEN MARKET, BY COUNTRY, 2018-2032 (USD MILLION)
      16. TABLE 15. EUROPE: SAND SCREEN MARKET, BY TYPE, 2018-2032 (USD MILLION)
      17. TABLE 16. EUROPE: SAND SCREEN MARKET, BY WELL TYPE, 2018-2032 (USD MILLION)
      18. TABLE 17. GERMANY: SAND SCREEN MARKET, BY TYPE, 2018-2032 (USD MILLION)
      19. TABLE 18. GERMANY: SAND SCREEN MARKET, BY WELL TYPE, 2018-2032 (USD MILLION)
      20. TABLE 19. FRANCE: SAND SCREEN MARKET, BY TYPE, 2018-2032 (USD MILLION)
      21. TABLE 20. FRANCE: SAND SCREEN MARKET, BY WELL TYPE, 2018-2032 (USD MILLION)
      22. TABLE 21. UK: SAND SCREEN MARKET, BY TYPE, 2018-2032 (USD MILLION)
      23. TABLE 22. UK: SAND SCREEN MARKET, BY WELL TYPE, 2018-2032 (USD MILLION)
      24. TABLE 23. SPAIN: SAND SCREEN MARKET, BY TYPE, 2018-2032 (USD MILLION)
      25. TABLE 24. SPAIN: SAND SCREEN MARKET, BY WELL TYPE, 2018-2032 (USD MILLION)
      26. TABLE 25. ITALY: SAND SCREEN MARKET, BY TYPE, 2018-2032 (USD MILLION)
      27. TABLE 26. ITALY: SAND SCREEN MARKET, BY WELL TYPE, 2018-2032 (USD MILLION)
      28. TABLE 27. REST OF EUROPE: SAND SCREEN MARKET, BY COUNTRY, 2018-2032 (USD MILLION)
      29. TABLE 28. REST OF EUROPE: SAND SCREEN MARKET, BY TYPE, 2018-2032 (USD MILLION)
      30. TABLE 29. REST OF EUROPE: SAND SCREEN MARKET, BY WELL TYPE, 2018-2032 (USD MILLION)
      31. TABLE 30. ASIA PACIFIC: SAND SCREEN MARKET, BY COUNTRY, 2018-2032 (USD MILLION)
      32. TABLE 31. ASIA PACIFIC: SAND SCREEN MARKET, BY TYPE, 2018-2032 (USD MILLION)
      33. TABLE 32. ASIA PACIFIC: SAND SCREEN MARKET, BY WELL TYPE, 2018-2032 (USD MILLION)
      34. TABLE 33. CHINA: SAND SCREEN MARKET, BY TYPE, 2018-2032 (USD MILLION)
      35. TABLE 34. CHINA: SAND SCREEN MARKET, BY WELL TYPE, 2018-2032 (USD MILLION)
      36. TABLE 35. INDIA: SAND SCREEN MARKET, BY TYPE, 2018-2032 (USD MILLION)
      37. TABLE 36. INDIA: SAND SCREEN MARKET, BY WELL TYPE, 2018-2032 (USD MILLION)
      38. TABLE 37. JAPAN: SAND SCREEN MARKET, BY TYPE, 2018-2032 (USD MILLION)
      39. TABLE 38. JAPAN: SAND SCREEN MARKET, BY WELL TYPE, 2018-2032 (USD MILLION)
      40. TABLE 39. SOUTH KOREA: SAND SCREEN MARKET, BY TYPE, 2018-2032 (USD MILLION)
      41. TABLE 40. SOUTH KOREA: SAND SCREEN MARKET, BY WELL TYPE, 2018-2032 (USD MILLION)
      42. TABLE 41. REST OF ASIA PACIFIC: SAND SCREEN MARKET, BY COUNTRY, 2018-2032 (USD MILLION)
      43. TABLE 42. REST OF ASIA PACIFIC: SAND SCREEN MARKET, BY TYPE, 2018-2032 (USD MILLION)
      44. TABLE 43. REST OF ASIA PACIFIC: SAND SCREEN MARKET, BY WELL TYPE, 2018-2032 (USD MILLION)
      45. TABLE 44. MIDDLE EAST & AFRICA: SAND SCREEN MARKET, BY COUNTRY, 2018-2032 (USD MILLION)
      46. TABLE 45. MIDDLE EAST & AFRICA: SAND SCREEN MARKET, BY TYPE, 2018-2032 (USD MILLION)
      47. TABLE 46. MIDDLE EAST & AFRICA: SAND SCREEN MARKET, BY WELL TYPE, 2018-2032 (USD MILLION)
      48. TABLE 47. GCC COUNTRIES: SAND SCREEN MARKET, BY TYPE, 2018-2032 (USD MILLION)
      49. TABLE 48. GCC COUNTRIES: SAND SCREEN MARKET, BY WELL TYPE, 2018-2032 (USD MILLION)
      50. TABLE 49. SOUTH AFRICA: SAND SCREEN MARKET, BY TYPE, 2018-2032 (USD MILLION)
      51. TABLE 50. SOUTH AFRICA: SAND SCREEN MARKET, BY WELL TYPE, 2018-2032 (USD MILLION)
      52. TABLE 51. REST OF MIDDLE EAST & AFRICA: SAND SCREEN MARKET, BY COUNTRY, 2018-2032 (USD MILLION)
      53. TABLE 52. REST OF MIDDLE EAST & AFRICA: SAND SCREEN MARKET, BY TYPE, 2018-2032 (USD MILLION)
      54. TABLE 53. REST OF MIDDLE EAST & AFRICA: SAND SCREEN MARKET, BY WELL TYPE, 2018-2032 (USD MILLION)
      55. TABLE 54. SOUTH AMERICA: SAND SCREEN MARKET, BY COUNTRY, 2018-2032 (USD MILLION)
      56. TABLE 55. SOUTH AMERICA: SAND SCREEN MARKET, BY TYPE, 2018-2032 (USD MILLION)
      57. TABLE 56. SOUTH AMERICA: SAND SCREEN MARKET, BY WELL TYPE, 2018-2032 (USD MILLION)
      58. TABLE 57. BRAZIL: SAND SCREEN MARKET, BY TYPE, 2018-2032 (USD MILLION)
      59. TABLE 58. BRAZIL: SAND SCREEN MARKET, BY WELL TYPE, 2018-2032 (USD MILLION)
      60. TABLE 59. ARGENTINA: SAND SCREEN MARKET, BY TYPE, 2018-2032 (USD MILLION)
      61. TABLE 60. ARGENTINA: SAND SCREEN MARKET, BY WELL TYPE, 2018-2032 (USD MILLION)
      62. TABLE 61. REST OF SOUTH AMERICA: SAND SCREEN MARKET, BY COUNTRY, 2018-2032 (USD MILLION)
      63. TABLE 62. REST OF SOUTH AMERICA: SAND SCREEN MARKET, BY TYPE, 2018-2032 (USD MILLION)
      64. TABLE 63. REST OF SOUTH AMERICA: SAND SCREEN MARKET, BY WELL TYPE, 2018-2032 (USD MILLION)   LIST OF FIGURES
      65. FIGURE 1. MARKET SYNOPSIS
      66. FIGURE 2. MARKET ATTRACTIVENESS ANALYSIS: GLOBAL SAND SCREEN MARKET
      67. FIGURE 3. GLOBAL SAND SCREEN MARKET ANALYSIS BY TYPE
      68. FIGURE 4. GLOBAL SAND SCREEN MARKET ANALYSIS BY WELL TYPE
      69. FIGURE 5. GLOBAL SAND SCREEN MARKET ANALYSIS BY REGION
      70. FIGURE 6. GLOBAL SAND SCREEN MARKET: MARKET STRUCTURE
      71. FIGURE 7. KEY BUYING CRITERIA OF SAND SCREEN
      72. FIGURE 8. RESEARCH PROCESS OF MRFR
      73. FIGURE 9. NORTH AMERICA MARKET SIZE & MARKET SHARE BY COUNTRY (2024 VS 2032)
      74. FIGURE 10. EUROPE MARKET SIZE & MARKET SHARE BY COUNTRY (2024 VS 2032)
      75. FIGURE 11. ASIA-PACIFIC & MARKET SHARE BY COUNTRY (2024 VS 2032)
      76. FIGURE 12. MIDDLE EAST & AFRICA MARKET SIZE & MARKET SHARE BY COUNTRY (2024 VS 2032)
      77. FIGURE 13. SOUTH AMERICA MARKET SIZE & MARKET SHARE BY COUNTRY (2024 VS 2032)
      78. FIGURE 14. DROC ANALYSIS OF GLOBAL SAND SCREEN MARKET
      79. FIGURE 15. DRIVERS IMPACT ANALYSIS: SAND SCREEN MARKET
      80. FIGURE 16. RESTRAINTS IMPACT ANALYSIS: SAND SCREEN MARKET
      81. FIGURE 17. SUPPLY / VALUE CHAIN: GLOBAL SAND SCREEN MARKET
      82. FIGURE 18. GLOBAL SAND SCREEN MARKET, BY TYPE, 2023 (% SHARE)
      83. FIGURE 19. GLOBAL SAND SCREEN MARKET, BY TYPE, 2024 TO 2032 (USD MILLION)
      84. FIGURE 20. GLOBAL SAND SCREEN MARKET, BY WELL TYPE, 2023 (% SHARE)
      85. FIGURE 21. GLOBAL SAND SCREEN MARKET, BY WELL TYPE, 2024 TO 2032 (USD MILLION)

    Sand Screen Market Segmentation

    Market Segmentation Overview

    • Detailed segmentation data will be available in the full report
    • Comprehensive analysis by multiple parameters
    • Regional and country-level breakdowns
    • Market size forecasts by segment
    Infographic

    Free Sample Request

    Kindly complete the form below to receive a free sample of this Report

    Get Free Sample

    Customer Strories

    “I am very pleased with how market segments have been defined in a relevant way for my purposes (such as "Portable Freezers & refrigerators" and "last-mile"). In general the report is well structured. Thanks very much for your efforts.”

    Victoria Milne

    Founder
    Case Study
    Chemicals and Materials