Silica Sand Market

Key Players: U.S. Silica Holdings, Covia Holdings, Sibelco, Hi-Crush Inc., Badger Mining Corporation, Quarzwerke GmbH, Emerge Energy Services, Source Energy Services

Silica Sand Market

Silica Sand Market Research Report Information by Mesh Size (< 70 Mesh, 70-120 Mesh, 120-200 Mesh, and >200 Mesh), By Grade (Glass, Foundry and Chemical), By Process (Wet Silica Sand, and Dry Silica Sand), By Application(Glass, Hydraulic Fracturing, Foundry, Construction, Chemicals, Water Filtration, Paints & Coatings, Ceramics, and Others) And By Region (North America, Europe, Asia-Pacific, Middle East & Africa and Latin America) - Forecast Till 2035
ID: MRFR/CnM/6744-CR
128 Pages
Anshula Mandaokar
Last Updated: June 16, 2026
ย 

Silica Sand Market Summary

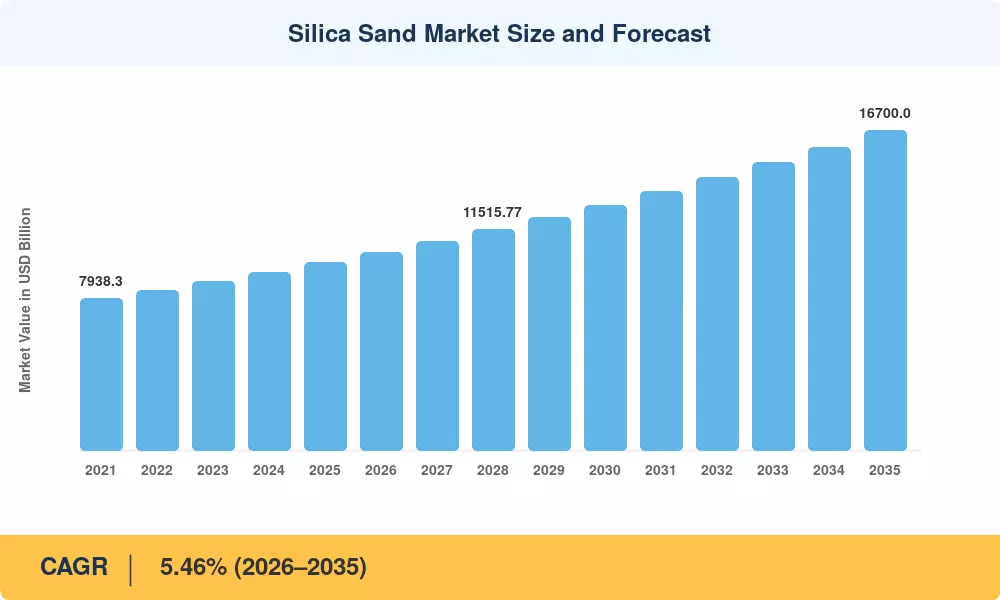
The Silica Sand Market reached an estimated USD 9,820 Million in 2025 and is projected to grow from USD 10,350 Million in 2026 to USD 16,700 Million by 2035, expanding at a CAGR of 5.46% during the forecast period. This sustained growth trajectory is anchored in surging demand for high-purity silica across solar photovoltaic glass production and the continued expansion of hydraulic fracturing operations in North American shale basins. Government-backed infrastructure investment programs โ€” including the U.S. Bipartisan Infrastructure Law and China's 14th Five-Year Plan for construction materials โ€” are channeling billions into projects that consume industrial silica at scale [1][2].

The supply chain of the Silica Sand Market is undergoing a modest but dramatic transition. Traditional open-pit extraction processes are being replaced by precision-processed quartz sand products that fulfill semiconductor-grade purity criteria. The worldwide semiconductor fabrication buildout, supported by more than USD 380 billion in announced fab investments through 2030 [3], is driving foundry sand materials and specialty sand products into all-new performance tiers. Dust-mitigation technology, automated sorting and real-time traceability systems are now baseline requirements for producers selling to electronics and solar glass buyers.

ย 

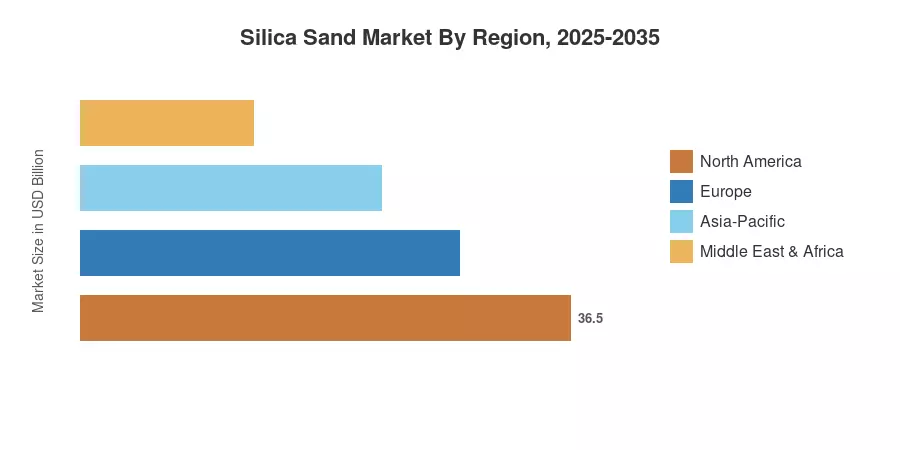
The Asia-Pacific holds the highest share of the Silica Sand Market at approximately 43.4% of 2025 revenue, due to the demand for sand in glass manufacture in China and the construction boom in India. The region also stands first in terms of fastest expanding geography with a predicted CAGR of 5.78% through 2035. North America is in the second position with around 28% share due to strong demand for frac sand materials in the Permian and Appalachian basins With decarbonization deadlines being drawn closer, silicon-intensive clean energy supply chains will keep the Silica Sand Market on a growth path well into the next decade.

ย 

Key Report Takeaways

โ€ข By Purity Level

  • Standard-grade silica (95โ€“99.5% SiOโ‚‚) accounted for approximately 51.3% of the Silica Sand Market share in 2025, reflecting broad use in construction silica sand and glass manufacturing sand applications
  • High-purity grades (>99.5% SiOโ‚‚) are advancing at a 6.74% CAGR through 2035, driven by semiconductor wafer and solar glass specifications

โ€ข By End-User Industry

  • Oil and gas represented roughly 38.8% of the Silica Sand Market in 2025, underscoring the importance of frac sand materials in unconventional well completions
  • Chemical production is projected to expand at a 5.76% CAGR to 2035, fueled by rising demand for industrial silica in specialty chemicals and catalysts
  • Glass manufacturing remains the second-largest end-user, consuming over 22% of total volume

โ€ข By Region

  • Asia-Pacific captured 43.4% of the Silica Sand Market revenue in 2025 and leads all regions in growth velocity
  • North America's share of roughly 28% is sustained by the shale oil ecosystem and in-basin mine expansions
  • Europe holds an estimated 18% share, with growth centered on solar glass facilities in Germany and Spain

ย 

Market Size and Forecast (2021โ€“2035)

Market Research Future (MRFR) projections are based on a combination of bottom-up producer shipment data and customs-level trade flow analysis, with top-down demand modeling calibrated to macroeconomic factors. Historical statistics (2021-2024) are reported actuals. 2025 is the base-year estimate. 2026-2035 figures are anticipated using the calibrated 5.46% CAGR with modifications for cyclical demand trends.

Silica Sand Market Size and Forecast
Our Impact
Enabled $4.3B Revenue Impact for Fortune 500 and Leading Multinationals
Partnering with 2000+ Global Organizations Each Year
30K+ Citations by Top-Tier Firms in the Industry
ย 

Driver Impact Analysis

Driver ~% Impact on CAGR Geographic Relevance Impact Timeline
Solar PV glass expansion +1.2% Asia-Pacific, Europe Medium-term (2โ€“4 yr)
Shale well completion volumes +1.0% North America Short-term (โ‰ค2 yr)
Semiconductor fab buildout +0.8% Asia-Pacific, North America Long-term (โ‰ฅ4 yr)
Urbanization and infrastructure programs +0.7% Asia-Pacific, MEA Long-term (โ‰ฅ4 yr)
Foundry lightweighting for EVs +0.5% Europe, North America Medium-term (2โ€“4 yr)
Water filtration regulatory mandates +0.3% Global Medium-term (2โ€“4 yr)
Specialty coatings demand growth +0.2% Europe, Asia-Pacific Short-term (โ‰ค2 yr)

ย 

Solar PV Glass Expansion

The International Energy Agency projects over 820 GW of new solar PV installations between 2026 and 2030, each gigawatt requiring roughly 4,500 tonnes of ultra-clear glass manufacturing sand [6]. China's solar glass capacity surpassed 120,000 tonnes per day in 2024, and India's Production-Linked Incentive scheme has earmarked USD 2.5 billion for domestic solar module manufacturing that will need reliable high-purity silica sourcing [12]. This dynamic is reshaping procurement away from spot purchases toward long-term off-take agreements with certified producers.

Shale Well Completion Volumes

North American horizontal well completions remain a primary driver for frac sand consumption. According to industry analysis, proppant intensity continues to rise as operators trend toward longer lateral lengths to improve well economics. This structural shift ensures sustained demand for high-quality proppant even during periods of fluctuating rig counts. Supply-chain localization has become a key strategic priority; the expansion of in-basin mining operations in regions like the Permian Basin and the Midwest has significantly optimized logistics and reduced transportation costs, strengthening the competitiveness of regional silica suppliers.

ย 

Semiconductor Fabrication Buildout

Over USD 380 billion in semiconductor fab investments have been announced globally through 2030, spanning facilities in Arizona, Ohio, Japan, and Germany [3]. Each advanced fab consumes high-grade quartz sand products for crucible linings, CMP slurries, and photomask substrates. The U.S. CHIPS Act alone has allocated USD 52.7 billion in subsidies and incentives, creating a durable demand floor for industrial silica refined to 99.99% purity levels [14].

Urbanization and Infrastructure Programs

Asia-Pacific urbanization rates are projected to reach 64% by 2035, adding over 400 million urban residents who will need housing, roads, and commercial infrastructure [8]. Construction silica sand consumption per capita in India and Southeast Asia remains well below developed-market averages, suggesting substantial runway for catch-up growth. Middle Eastern mega-projects โ€” including Saudi Arabia's NEOM initiative โ€” will absorb specialty sand products at unprecedented volumes through the early 2030s.

ย 

ย 

Restraints Impact Analysis

Restraint ~% Impact on CAGR Geographic Relevance Impact Timeline
Silicosis and occupational health regulations โ€“0.6% Global Short-term (โ‰ค2 yr)
Environmental permitting delays โ€“0.5% North America, Europe Medium-term (2โ€“4 yr)
Substitute proppant technologies โ€“0.4% North America Long-term (โ‰ฅ4 yr)
Logistics and transportation cost inflation โ€“0.3% Global Short-term (โ‰ค2 yr)
Water consumption scrutiny in mining โ€“0.2% Asia-Pacific, MEA Medium-term (2โ€“4 yr)

ย 

Silicosis and Occupational Health Regulations

OSHA's 2024 enforcement update reduced the permissible exposure limit for respirable crystalline silica to 25 ยตg/mยณ for construction settings, forcing producers and downstream users to invest in enclosed transfer systems, real-time dust monitoring, and wet-processing retrofits [15]. Compliance costs for mid-size industrial silica operations can exceed USD 3โ€“5 million per facility, compressing margins and slowing capacity additions. European REACH restrictions are similarly tightening, with proposed classification changes that could reclassify certain quartz sand products under more stringent handling protocols.

Environmental Permitting Delays

New mine permit timelines in the U.S. have stretched to 7โ€“10 years in some jurisdictions, and groundwater impact assessments now require multi-year monitoring baselines [16]. In Europe, Natura 2000 habitat overlap has blocked or delayed several proposed sand extraction sites in Germany and the Netherlands. These bottlenecks constrain supply elasticity and push producers toward brownfield expansions and acquisitions rather than greenfield development, limiting the Silica Sand Market's ability to respond quickly to demand surges.

Substitute Proppant Technologies

Ceramic proppants and resin-coated alternatives continue to gain share in high-pressure well completions where traditional frac sand materials suffer crush resistance limitations [17]. While ceramic proppants remain two to three times more expensive per tonne, their cost-per-barrel-of-oil-equivalent advantage in deep wells is narrowing. Adoption rates for ceramic alternatives have reached 12โ€“15% in the Haynesville Shale, signaling a slow but meaningful substitution trend.

ย 

ย 

Silica Sand Market Opportunities

Solar and Low-Iron Glass Premiums

Ultra-clear glass with iron content below 150 ppm commands a 25โ€“35% price premium over standard float glass, and solar module manufacturers are locking in multi-year supply agreements for certified high purity silica feedstock Producers who invest in advanced beneficiation โ€” magnetic separation, acid leaching, and optical sorting โ€” can capture this margin uplift.

Semiconductor-Grade Silica Localization

The CHIPS Act and similar programs in Japan and the EU are driving semiconductor supply chain reshoring, creating local demand for foundry sand materials and crucible-grade quartz sand products that were historically sourced from a handful of suppliers in Brazil and Norway Regional producers with proximity to new fabs hold a logistics and security-of-supply advantage.

Emerging Market Infrastructure Catch-Up

India's National Infrastructure Pipeline targets USD 1.4 trillion in investment by 2030, with road, rail, and housing projects consuming massive volumes of construction silica sand [8]. Southeast Asian economies โ€” Vietnam, Indonesia, the Philippines โ€” face similar build-out cycles. Early-mover foreign producers partnering with local operators can establish durable market positions in these high-growth corridors

Recycled and Circular Sand Business Models

Foundry sand reclamation technologies now recover 85โ€“90% of spent industrial silica for reuse, reducing virgin material consumption and landfill costs [20]. Companies offering sand-as-a-service โ€” leasing processed sand with take-back guarantees โ€” are creating recurring revenue streams that improve margin visibility. This model also aligns with tightening ESG disclosure requirements under the EU Corporate Sustainability Reporting Directive.

Water Filtration and Environmental Remediation

Drinking water quality standards are tightening globally, with the WHO's 2024 guideline updates expanding the list of regulated contaminants [10]. Silica filter media demand is growing 6โ€“8% annually in municipal and industrial treatment plants, and specialty sand products engineered for specific particle-size distributions command premium pricing

ย 

ย 

Silica Sand Market Future Outlook

Clean Energy Supply Chain Intensification

Solar PV and battery manufacturing continue to be the primary structural demand drivers for the high-purity silica sand market. Under the IEAโ€™s Net Zero Scenario, global annual solar installations are projected to scale significantly toward 1,200 GW by 2030, necessitating a consistent supply of ultra-clear, low-iron glass. Producers focusing on advanced beneficiation and optical sorting technologies are increasingly well-positioned to meet the stringent purity requirements of these high-growth sectors.

ย 

Digital Traceability and Quality Certification

Blockchain-based traceability systems and ISO 19001 quality certification frameworks are transforming procurement in the industrial silica supply chain. Buyers in the semiconductor and pharmaceutical glass segments increasingly require batch-level provenance data, creating a premium tier within the quartz sand products category. Companies that digitize their mine-to-customer chain will command 10โ€“15% price premiums over commodity suppliers [23].

Sustainability and ESG Reporting Mandates

The EU's Corporate Sustainability Reporting Directive and proposed SEC climate disclosure rules are pushing Silica Sand Market participants toward auditable environmental metrics. Water recycling, habitat restoration, and Scope 3 emissions tracking are becoming prerequisites for supplying multinational glass and foundry customers. Producers who achieve carbon-neutral certification by 2030 will have a measurable competitive advantage in specialty sand products procurement cycles [24].

Automation and Precision Processing

The deployment of autonomous haulage, AI-driven grain-size classification, and continuous real-time moisture monitoring is increasingly common in large-scale industrial silica operations. These technologies are vital for maintaining the strict particle-size distribution tolerances required in semiconductor and high-performance glass applications. While the specific economic return on capital expenditure (capex) varies by site and scale, the integration of these technologies is widely recognized in the mining industry as a primary method for reducing operational costs and ensuring consistent product quality.

ย 

ย 

Silica Sand Market Segmentation

By Purity Level

Segment Key Metric Primary Demand Driver
High-Purity (>99.5% SiOโ‚‚) 6.74% CAGR (2026โ€“2035) Semiconductor wafers and solar PV glass
Standard (95โ€“99.5% SiOโ‚‚) 51.3% share (2025) Glass manufacturing, sand and construction silica sand
Low-Purity (<95% SiOโ‚‚) USD 1,240 Million (2025) Foundry sand materials and general fill

ย 

The Silica Sand Market's standard-grade segment dominates in volume, supplying the bulk of construction silica sand and commodity glass manufacturing sand worldwide. This grade's ubiquity in ready-mix concrete, asphalt, and container glass ensures a stable demand floor even during cyclical downturns. High purity silica, meanwhile, is the segment to watch โ€” driven by semiconductor quartz sand products specifications and solar glass iron-content limits that push producers toward premium beneficiation processes. Margin per tonne for high-purity grades can be three to five times that of standard industrial silica.

By End-User Industry

Segment Key Metric Primary Demand Driver
Oil and Gas 38.8% share (2025) Frac sand materials for horizontal completions
Glass Manufacturing 5.52% CAGR (2026โ€“2035) Solar and architectural glass expansion
Foundry USD 1,310 Million (2025) Automotive lightweighting castings
Chemical Production 5.76% CAGR (2026โ€“2035) Catalysts and silicone feedstock
Construction USD 1,150 Million (2025) Infrastructure and residential building
Paints and Coatings 4.8% CAGR (2026โ€“2035) Industrial and architectural coatings
Ceramics and Refractories USD 520 Million (2025) Kiln linings and tile production
Filtration 5.9% CAGR (2026โ€“2035) Municipal and industrial water treatment
Other End-User Industries USD 340 Million (2025) Sports turf, recreation, specialty applications

ย 

Oil and gas remain the anchor end-user for the Silica Sand Market, with frac sand materials consumption closely tracking North American horizontal well completion counts. Glass manufacturing is the second-largest consumer and the fastest-growing among traditional end-users, propelled by solar PV glass demand and the premiumization of architectural glass in commercial construction. The foundry segment is experiencing a structural shift as automakers adopt large-format aluminum die castings โ€” so-called gigacastings โ€” that require precisely graded foundry sand materials with tight grain-size distributions [9].

ย 

ย 

Regional Market Share Analysis

Region Key Metric Primary Investment Themes
Asia-Pacific 43.4% share (2025) Solar glass, construction, semiconductor fabs
North America 28.0% share (2025) Frac sand materials, specialty sand products
Europe 18.0% share (2025) Automotive foundry sand materials, solar glass
South America 6.0% share (2025) High purity silica exports, mining services
Middle East & Africa 4.6% share (2025) Mega-project construction, glass manufacturing, sand
Total 100% โ€”

The Silica Sand Market exhibits a concentrated regional hierarchy, with Asia-Pacific and North America together accounting for over 71% of global revenue. Industrial silica trade flows are increasingly regionalized as producers build in-basin capacity to serve local demand centers.

ย 

North America

Country Key Metric Key Driver
US 5.62% CAGR (2026โ€“2035) Permian Basin frac sand materials demand
Canada USD 485 Million (2025) Oil sands and construction silica sand
Mexico 4.8% CAGR (2026โ€“2035) Glass manufacturing sand for the automotive sector

ย 

The United States dominates the North American Silica Sand Market, with Wisconsin, Texas, and Illinois serving as the primary production corridors. The Permian Basin alone absorbed over 45 million tonnes of proppant in 2024, and in-basin mine capacity continues to expand as operators seek to minimize last-mile trucking costs [7]. Canada's Alberta oil sands and British Columbia's construction pipeline sustain mid-single-digit demand growth. At the same time, Mexico's automotive glass sector benefits from nearshoring trends that are pulling foundry sand materials demand southward.

Europe

Country Key Metric Key Driver
Germany USD 540 Million (2025) Automotive castings and solar glass
UK 4.3% CAGR (2026โ€“2035) Construction and filtration
France USD 310 Million (2025) Glass manufacturing sand for luxury packaging
Italy 4.1% CAGR (2026โ€“2035) Ceramics and refractories
Spain USD 195 Million (2025) Solar PV glass expansion
Nordic Countries 4.5% CAGR (2026โ€“2035) High-purity silica for electronics
Russia USD 165 Million (2025) Industrial mineral sand for construction
Rest of Europe 4.0% CAGR (2026โ€“2035) Diversified industrial demand

ย 

Europe's Silica Sand Market is shaped by the automotive sector's shift toward large-format EV castings and the EU's solar energy buildout targets under REPowerEU. Germany's foundry industry โ€” the continent's largest โ€” is retooling for aluminum and magnesium castings that require precision-graded quartz sand products [9]. Spain's solar glass capacity has doubled since 2021, with new facilities near Zaragoza and Andalusia drawing on domestic silica deposits.

Asia-Pacific

Country Key Metric Key Driver
China USD 2,180 Million (2025) Solar glass and semiconductor quartz sand products
India 7.1% CAGR (2026โ€“2035) Infrastructure and construction silica sand
Japan USD 420 Million (2025) Electronics-grade high-purity silica
South Korea 5.9% CAGR (2026โ€“2035) Semiconductor and display glass
ASEAN USD 385 Million (2025) Construction and industrial silica
Rest of Asia-Pacific 5.5% CAGR (2026โ€“2035) Diversified industrial mineral sand

ย 

The Silica Sand Market in Asia-Pacific benefits from a unique convergence of construction-driven volume and technology-driven premiums. China's solar glass producers โ€” led by Xinyi Glass and Flat Glass Group โ€” consumed over 80 million tonnes of silica in 2024, and capacity expansion announcements suggest continued 8โ€“10% annual demand growth [6]. India's National Infrastructure Pipeline and Smart Cities Mission are creating unprecedented pull for construction silica sand, while Japan and South Korea anchor the region's high-value electronics segment.

South America

Country Key Metric Key Driver
Brazil USD 380 Million (2025) High-purity silica exports and glass manufacturing
Argentina 5.0% CAGR (2026โ€“2035) Vaca Muerta shale frac sand materials
Rest of South America USD 110 Million (2025) Construction and industrial silica

ย 

Brazil's Minas Gerais and Paranรก states host some of the world's highest-quality silica deposits, supplying semiconductor-grade quartz sand products to global buyers. Argentina's Vaca Muerta formation is driving a nascent frac sand materials industry, with three new in-basin processing plants commissioned since 2023 [21].

Middle East & Africa

Country Key Metric Key Driver
Saudi Arabia USD 145 Million (2025) NEOM and Vision 2030 construction
UAE 5.3% CAGR (2026โ€“2035) Glass manufacturing sand for real estate
South Africa USD 65 Million (2025) Foundry sand materials for mining equipment
Egypt 5.6% CAGR (2026โ€“2035) New Administrative Capital construction
Rest of MEA USD 95 Million (2025) General construction and industrial mineral sand

ย 

Saudi Arabia's Vision 2030 mega-projects are absorbing specialty sand products at a pace that outstrips local supply, requiring imports from Australia and India. Egypt's New Administrative Capital project and expanding glass industry are pulling the Silica Sand Market's MEA segment toward higher growth rates [22].

ย 

Silica Sand Market By Region, 2025-2035
ย 

Competitive Benchmarking

The Silica Sand Market is moderately concentrated, with the top five companies accounting for 35-42% of the worldwide revenue market share. The Herfindahl-Hirschman Index is 800 to 1,200, indicating a competitive landscape with regional experts and international industrial mineral sand businesses. Differentiation rests on deposit quality, beneficiation capacity, logistical infrastructure and, growing in importance, ESG certification.

Company Est. Revenue Share Range Key Offerings Strategic Positioning
U.S. Silica Holdings ~7โ€“10% Frac sand materials, industrial silica, specialty sand products Vertically integrated with in-basin logistics
Covia Holdings ~6โ€“9% Foundry sand materials, glass manufacturing sand Broad product portfolio across purity grades
Sibelco ~5โ€“8% High-purity silica, quartz sand products Global deposit network, premium positioning
Hi-Crush Inc. ~4โ€“7% Frac sand materials, last-mile logistics Permian Basinโ€“focused supply chain
Badger Mining Corporation ~3โ€“5% Industrial silica, construction silica sand Midwest U.S. deposits, sustainability focus
Quarzwerke GmbH ~3โ€“5% Specialty sand products, glass manufacturing sand European market leader with diversified minerals
Emerge Energy Services ~2โ€“4% Frac sand materials, in-basin processing Cost-competitive Texas operations
Source Energy Services ~2โ€“4% Frac sand materials, terminal network Canadian oil sands supply chain
Fairmount Santrol (Covia subsidiary) ~2โ€“3% Foundry sand materials, coated quartz sand products Resin-coated specialty products
Minerali Industriali ~1โ€“3% Glass manufacturing sand, high-purity silica Mediterranean basin sourcing

ย 

ย 

ย 

Recent News & Developments

ย 

ย 

  • Covia Holdings (October 2024): Launched a carbon-neutral certification program for its industrial silica product line, targeting European glass manufacturing sand buyers [24].
  • OSHA (August 2024): Published updated enforcement guidance lowering the respirable crystalline silica exposure limit for construction operations, increasing compliance costs across the Silica Sand Market [15].

ย 

ย 

ย 

ย 

ย 

ย 

Silica Sand Market Report Scope

Parameter Detail
Market Scope Global Silica Sand Market by Purity Level, End-User Industry, and Geography
Study Period 2021โ€“2035
CAGR 5.46% (2026โ€“2035)
Base Year Market Size USD 9,820 Million (2025)
Forecast Endpoint USD 16,700 Million (2035)
Fastest Growing Segment High-Purity (>99.5% SiOโ‚‚) at 6.74% CAGR
Fastest Growing Region Asia-Pacific at 5.78% CAGR
Companies Profiled 10 (U.S. Silica, Covia, Sibelco, Hi-Crush, Badger Mining, Quarzwerke, Emerge Energy, Source Energy, Fairmount Santrol, Minerali Industriali)
Valuation Currency USD Million

ย 

ย 

ย 

FAQs

What grain-size specifications should procurement teams prioritize when sourcing silica for solar glass?

Solar-grade glass manufacturing sand typically requires 99.5%+ SiOโ‚‚ content with Feโ‚‚Oโ‚ƒ below 150 ppm and a 20โ€“40 mesh grain-size distribution. Confirming batch-level certificates from ISO 17025โ€“accredited labs reduces reject rates at the furnace [6].

How do in-basin frac sand mines compare to Northern White sand on a total-cost-of-ownership basis?

In-basin Texas operations cut delivered cost by USD 25โ€“40 per tonne versus Wisconsin-origin Northern White by eliminating rail freight. However, Northern White's superior crush strength retains advantages in wells exceeding 10,000 psi closure stress.

What ESG disclosure frameworks apply specifically to industrial silica producers?

The EU Corporate Sustainability Reporting Directive and GRI 306 (Waste) are the most relevant, requiring site-level water withdrawal, dust emissions, and land rehabilitation metrics. Producers supplying European glass buyers face near-term audit requirements [24].

How does crystalline silica dust regulation differ between OSHA and EU REACH?

OSHA sets a permissible exposure limit of 25 ยตg/mยณ for construction; EU REACH is considering reclassifying quartz as a Category 1A carcinogen. The EU pathway could trigger stricter labeling and handling protocols than current U.S. requirements [15].

What role does silica play in emerging solid-state battery manufacturing?

Silicon-oxide anodes use nano-grade high-purity silica as a precursor, with pilot production lines in Japan and South Korea consuming 500โ€“800 tonnes annually. Commercial-scale adoption could materially increase demand by 2030 [3].

Are resin-coated sands gaining share over raw frac sand in well completions?

Resin-coated proppants hold roughly 8โ€“10% of completion volumes and are gaining in deep, high-pressure formations. Their cost premium of 2โ€“3ร— limits broader adoption in standard wells [17].

What due diligence steps should investors evaluate before entering the Silica Sand Market?

Key diligence areas include deposit SiOโ‚‚ purity certification, remaining permitted reserves in years, proximity to demand centers, and exposure to pending environmental permit renewals. Water rights and reclamation bond adequacy are often underweighted [16].

ย 

ย 

FAQs

What is the current valuation of the Silica Sand Market as of 2024?

The Silica Sand Market was valued at 44.79 USD Billion in 2024.

What is the projected market valuation for the Silica Sand Market in 2035?

The market is projected to reach a valuation of 86.19 USD Billion by 2035.

What is the expected CAGR for the Silica Sand Market during the forecast period 2025 - 2035?

The expected CAGR for the Silica Sand Market during the forecast period 2025 - 2035 is 6.13%.

Which companies are considered key players in the Silica Sand Market?

Key players in the market include U.S. Silica Holdings, Covia Holdings, Sibelco, and Badger Mining Corporation.

What are the main applications of silica sand in various industries?

Silica sand is primarily used in applications such as glass, hydraulic fracturing, foundry, and construction.

How does the mesh size segment impact the valuation of the Silica Sand Market?

The mesh size segment shows valuations ranging from 8.95 to 25.44 USD Billion, indicating diverse market demand.

What is the valuation range for wet and dry silica sand in the market?

The valuation for wet silica sand ranges from 18.0 to 35.0 USD Billion, while dry silica sand ranges from 26.79 to 51.19 USD Billion.

How does the grade of silica sand affect its market performance?

The grade segment indicates valuations from 12.0 to 32.19 USD Billion, reflecting its importance in various applications.

What are the projected growth trends for the Silica Sand Market by 2035?

The market is expected to grow significantly, with a projected valuation of 86.19 USD Billion by 2035.

What factors contribute to the growth of the Silica Sand Market?

Factors such as increasing demand in construction and glass manufacturing are likely to drive market growth.
Author
Author
Author Profile
Anshula Mandaokar LinkedIn
Team Lead - Research
Anshula Mandaokar holds an academic degree in Chemical Engineering and has been contributing to the field for more than 5 years. She has expertise in Market Research and Business Consulting and serves as a Team Lead for a reputed Market Research firm under the Chemicals and Materials domain spectrum. She has worked on multiple projects, generating explicit results in a quick turnaround time. Her understanding of data interpretation justifies her role as a leader.

Research Approach

ย 

Secondary Research

The secondary research process involved comprehensive analysis of mining regulatory databases, geological surveys, industrial mineral publications, and authoritative industry associations. Key sources included the US Geological Survey (USGS) Minerals Yearbook, US Mine Safety and Health Administration (MSHA), US Environmental Protection Agency (EPA), Occupational Safety and Health Administration (OSHA) Silica Standards, European Association of Industrial Silica Producers (EUROSIL), British Geological Survey (BGS), Industrial Minerals Association โ€“ North America (IMA-NA), National Industrial Sand Association (NISA), US Energy Information Administration (EIA), International Energy Agency (IEA), World Steel Association, Glass Manufacturing Industry Council (GMIC), American Foundry Society (AFS), China Ministry of Natural Resources, Geological Survey of Japan (GSJ), Australian Bureau of Statistics (ABS) Mining Data, Indian Bureau of Mines, Brazilian Mining Association (Ibram), World Bank Commodity Price Data, United Nations Industrial Development Organization (UNIDO), and national mining ministry reports from key producing regions.

These sources were used to collect production statistics, reserve estimates, regulatory compliance data, trade flow analysis, and market landscape assessment for wet and dry silica sand across glass grade, foundry grade, and chemical grade categories, as well as mesh size segments (<70 mesh, 70-120 mesh, 120-200 mesh, and >200 mesh).

ย 

Primary Research

In order to gather both qualitative and quantitative insights, supply-side and demand-side stakeholders were interviewed during the primary research phase. Supply-side sources included CEOs, VPs of Operations, quarry managers, regulatory compliance officers, and commercial directors from silica sand mining businesses, processing facilities, and industrial mineral distributors.

Demand-side sources include procurement directors from glass manufacturers, foundry operations managers, oilfield services procurement leaders, building materials purchasers, and R&D heads from ceramics, paints & coatings, and water filtration industries. Primary research validated market segmentation across mesh sizes and grades, confirmed capacity growth timetables, and gathered information on extraction technologies, pricing dynamics, transportation logistics, and environmental compliance costs.

Primary Respondent Breakdown:

By Designation: C-level Primaries (32%), Director Level (31%), Others (37%)

By Region: North America (38%), Europe (25%), Asia-Pacific (28%), Rest of World (9%)

ย 

Market Size Estimation

Production volume mapping and revenue analysis along the value chain were used to get the global market valuation. The methods included: Identification of 50+ important silica sand producers and processors across North America, Europe, Asia-Pacific, Latin America, and Middle East & AfricaProduct mapping with grade-specific analysis for both wet and dry silica sand processes (glass, foundry, chemical) Mesh size segmentation analysis including <70 mesh, 70-120 mesh, 120-200 mesh, and >200 mesh categories

Examination of annual revenues for silica sand businesses and associated industrial mineral portfolios, both reported and modeled

Coverage of manufacturers accounting for 75โ€“80% of the world market in 2024

Extrapolation using bottom-up (production volume ร— ASP by region and grade) and top-down (producer revenue validation) approaches to derive segment-specific valuations, incorporating trade data and regional consumption patterns across glass manufacturing, hydraulic fracturing, foundry, construction, chemicals, water filtration, paints & coatings, ceramics, and other specialty applications

Download Free Sample

Kindly complete the form below to receive a free sample of this Report

Download PDF ×

We do not share your information with anyone. However, we may send you emails based on your report interest from time to time. You may contact us at any time to opt-out.