Segmentation Quick Reference
| Dimension | Sub-Segments | Dominant Segment | Fastest Growing Segment |
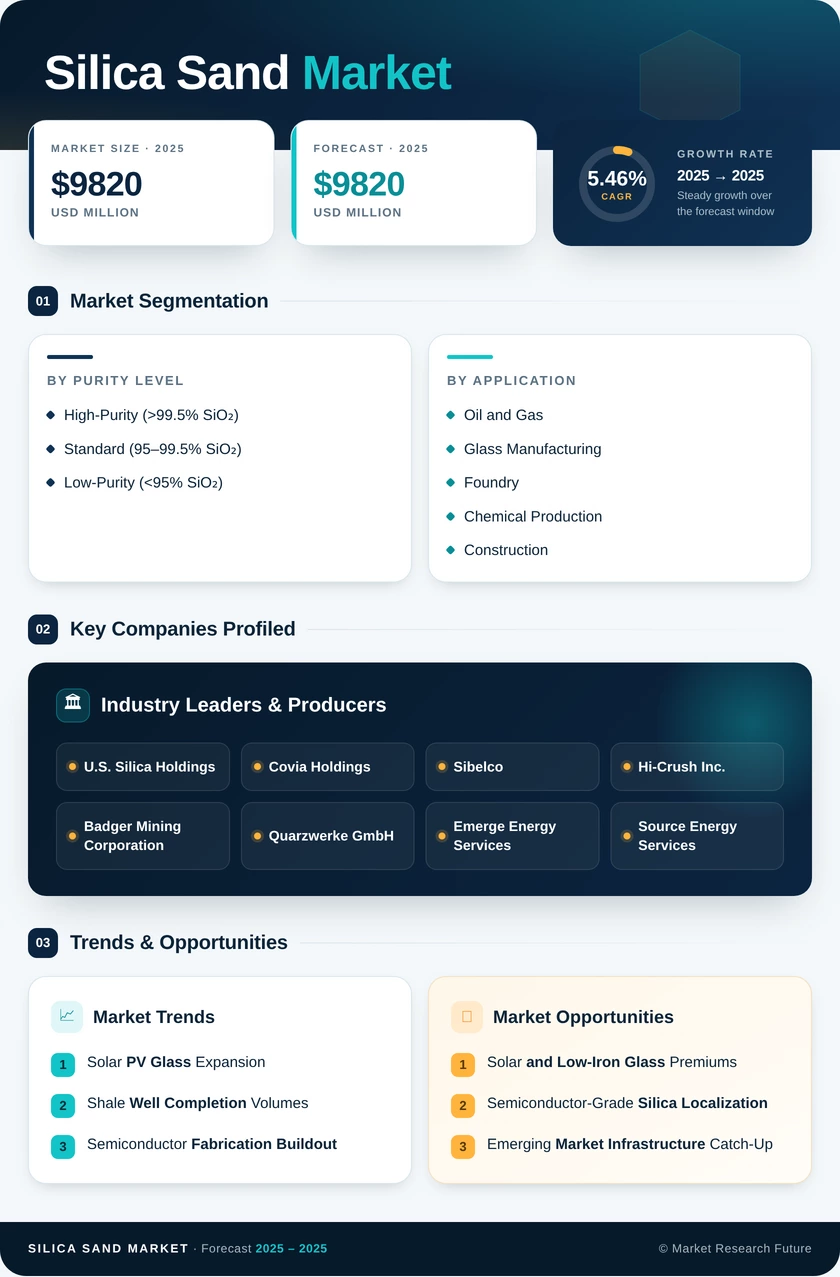
| Purity Level | High-Purity (>99.5% SiO₂), Standard (95–99.5%), Low-Purity (<95%) | Standard (95–99.5%) | High-Purity (>99.5% SiO₂) |
| End-User Industry | Glass Manufacturing, Foundry, Chemical Production, Silica Sand Market, Paints and Coatings, Ceramics and Refractories, Filtration, Oil and Gas, Other | Oil and Gas | Filtration |
| Geography | Asia-Pacific, North America, Europe, South America, the Middle East & Africa | Asia-Pacific | Asia-Pacific |
Market Segmentation Overview
By Purity Level
| Sub-Segment | Key Trend |
| High-Purity (>99.5% SiO₂) | Semiconductor and solar glass demand are driving premium pricing and beneficiation investment |
| Standard (95–99.5% SiO₂) | Stable volume base underpinned by glass manufacturing and construction applications |
| Low-Purity (<95% SiO₂) | Commoditized segment serving foundry and general fill applications with thin margins |
The purity level dimension captures the fundamental quality gradient in the silica sand industry. Standard-grade material accounts for the majority of tonnage shipped globally, but high-purity grades are growing at a faster rate as semiconductor, solar, and specialty chemical buyers tighten their feedstock specifications. Low-purity material remains volume-significant in foundry and construction contexts where chemical composition tolerances are wider.
By End-User Industry
| Sub-Segment | Key Trend |
| Glass Manufacturing | Solar PV glass expansion and architectural glass premiumization |
| Foundry | EV gigacasting adoption increasing demand for precision-graded mold sand |
| Chemical Production | Growing use as feedstock for silicones, sodium silicate, and catalysts |
| Silica Sand Market | Infrastructure mega-projects in Asia-Pacific and the Middle East |
| Paints and Coatings | Functional filler demand in anti-corrosion and textured coatings |
| Ceramics and Refractories | Kiln lining replacements and tile production in Southern Europe and Asia |
| Filtration | Tightening municipal water quality standards, expanding filter media demand |
| Oil and Gas | Horizontal well proppant intensity rising with longer lateral lengths |
| Other End-User Industries | Sports turf, recreation surfaces, and specialty industrial applications |
The end-user dimension reflects the extraordinary breadth of silica sand consumption across the global economy. Oil and gas dominates on share, but the growth center is shifting toward glass manufacturing and filtration as clean energy and water quality regulations intensify. Foundry applications are evolving rapidly with the automotive industry's transition to lightweight aluminum castings.
By Geography
| Sub-Segment | Key Trend |
| Asia-Pacific | Largest and fastest-growing region driven by solar glass, construction, and semiconductor demand |
| North America | Frac sand demand and specialty product premiums anchoring the second-largest position |
| Europe | Automotive foundry transition and solar glass capacity additions |
| South America | High-purity export deposits and emerging shale proppant demand |
| Middle East & Africa | Mega-project construction and nascent glass manufacturing capacity |
Geographic segmentation reveals a market where Asia-Pacific's dominance is structural — rooted in both massive construction volumes and the region's concentration of solar glass and semiconductor manufacturing capacity. North America's position is uniquely shaped by the shale energy ecosystem, while Europe's growth increasingly reflects the continent's clean energy transition. South America and MEA represent smaller but faster-evolving segments where greenfield investment is creating new supply and demand nodes.