Saudi Arabia Bottled Water Market (2026 - 2035)

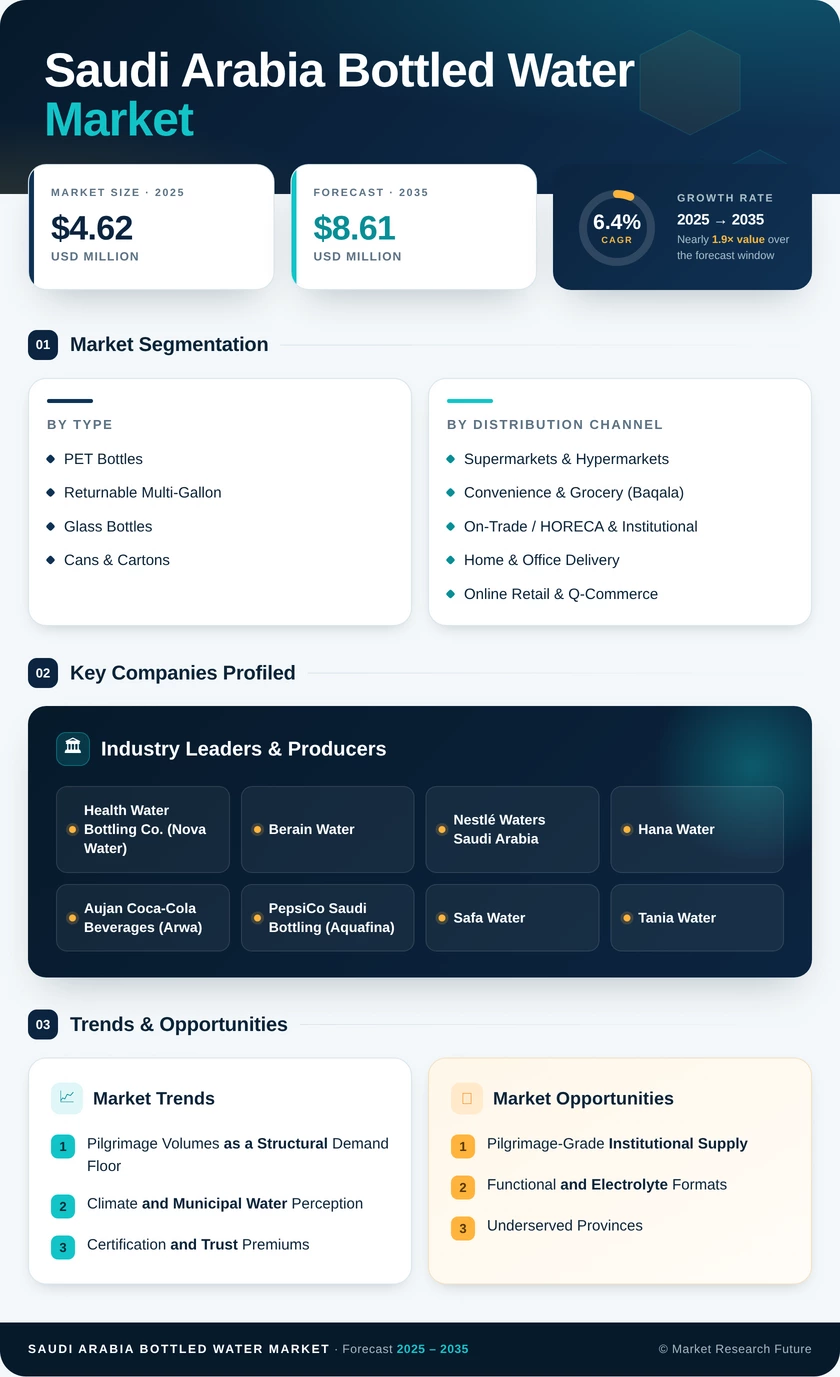
Saudi Arabia Bottled Water Market Size, Share, Industry Trend & Analysis Research Report Information By Product Type (Still Water, Sparkling / Carbonated Water, Flavoured Water, Functional & Enhanced Water), By Packaging Type (PET Bottles, Returnable Multi-Gallon, Glass Bottles, Cans & Cartons), By Distribution Channel (Supermarkets & Hypermarkets, Convenience & Grocery (Baqala), On-Trade / HORECA & Institutional, Home & Office Delivery, Online Retail & Q-Commerce), By Region (Central Region, Western Region, Eastern Province, Southern Region, Northern & Border Regions) - Forecast Till 2035

Forecast Period
2026-2035
CAGR
6.4%
2025 Market Size
USD 4.62 Billion
2035 Market Size
USD 8.61 Billion
Consumer and Retail ● Updated August 2026 Report ID: MRFR/CG/21744-CR | Pages: 186 | Author: Varsha More
  1. 1 Market Overview |
    1. 1.1 Study Assumptions & Market Definition |
    2. 1.2 Scope of the Study |
    3. 1.3 Research Methodology
  2. 2 Market Summary & Key Takeaways |
    1. 2.1 Key Takeaways by Product Type |
    2. 2.2 Key Takeaways by Distribution Channel |
    3. 2.3 Key Takeaways by Region
  3. 3 Market Size & Forecast (2021–2035) |
    1. 3.1 Historical Market Size (2021–2025) |
    2. 3.2 Current & Forecast Market Size (2026–2035) |
    3. 3.3 Market Size by Revenue (USD Billion) |
    4. 3.4 Year-over-Year Growth Analysis
  4. 4 Market Dynamics — Drivers |
    1. 4.1 Religious Tourism Expansion Under Vision 2030 |
    2. 4.2 Climate Conditions & Municipal Water Perception |
    3. 4.3 Certification, Labelling & Trust Premiums |
    4. 4.4 Modern Trade & Quick-Commerce Channel Modernisation |
    5. 4.5 Giga-Project & Industrial Site Consumption
  5. 5 Market Dynamics — Restraints |
    1. 5.1 PET Resin & Packaging Cost Volatility |
    2. 5.2 Single-Use Plastic Regulation & Recycling Obligations |
    3. 5.3 Groundwater Abstraction Licensing & Aquifer Stress |
    4. 5.4 Private-Label Price Compression |
    5. 5.5 Distribution Cost in Low-Density Provinces
  6. 6 Market Opportunity Analysis |
    1. 6.1 Pilgrimage-Grade Institutional Supply |
    2. 6.2 Functional & Electrolyte Formats |
    3. 6.3 Underserved Provincial Distribution |
    4. 6.4 Consumption Data Monetisation |
    5. 6.5 GCC Export Positioning |
    6. 6.6 Industry Value Chain Analysis |
    7. 6.7 Porter's Five Forces Analysis
  7. 7 Regional Analysis |
    1. 7.1 Central Region | |
      1. 7.1.1 Riyadh City | |
      2. 7.1.2 Al Kharj | |
      3. 7.1.3 Al Qassim |
    2. 7.2 Western Region | |
      1. 7.2.1 Makkah | |
      2. 7.2.2 Jeddah | |
      3. 7.2.3 Madinah |
    3. 7.3 Eastern Province | |
      1. 7.3.1 Dammam–Khobar | |
      2. 7.3.2 Jubail | |
      3. 7.3.3 Al Ahsa |
    4. 7.4 Southern Region | |
      1. 7.4.1 Asir | |
      2. 7.4.2 Jazan | |
      3. 7.4.3 Najran |
    5. 7.5 Northern & Border Regions | |
      1. 7.5.1 Tabuk | |
      2. 7.5.2 Al Jouf | |
      3. 7.5.3 Northern Borders
  8. 8 Future Outlook (2026–2035) |
    1. 8.1 Automation & Predictive Quality Control |
    2. 8.2 Circular Packaging Economics |
    3. 8.3 Desalination Cost Curve |
    4. 8.4 Consumption Analytics & Health Positioning
  9. 9 Segmentation Analysis |
    1. 9.1 By Product Type | |
      1. 9.1.1 Still Water | |
      2. 9.1.2 Sparkling / Carbonated Water | |
      3. 9.1.3 Flavoured Water | |
      4. 9.1.4 Functional & Enhanced Water |
    2. 9.2 By Packaging Type | |
      1. 9.2.1 PET Bottles | |
      2. 9.2.2 Returnable Multi-Gallon | |
      3. 9.2.3 Glass Bottles | |
      4. 9.2.4 Cans & Cartons |
    3. 9.3 By Distribution Channel | |
      1. 9.3.1 Supermarkets & Hypermarkets | |
      2. 9.3.2 Convenience & Grocery (Baqala) | |
      3. 9.3.3 On-Trade / HORECA & Institutional | |
      4. 9.3.4 Home & Office Delivery | |
      5. 9.3.5 Online Retail & Q-Commerce
  10. 10 Competitive Landscape |
    1. 10.1 Market Share Analysis (2026) |
    2. 10.2 Competitive Benchmarking Matrix |
    3. 10.3 Company Profiles | |
      1. 10.3.1 Health Water Bottling Co. (Nova Water) | |
      2. 10.3.2 Berain Water | |
      3. 10.3.3 Nestlé Waters Saudi Arabia | |
      4. 10.3.4 Hana Water | |
      5. 10.3.5 Aujan Coca-Cola Beverages (Arwa) | |
      6. 10.3.6 PepsiCo Saudi Bottling (Aquafina) | |
      7. 10.3.7 Naqi Water Company | |
      8. 10.3.8 Safa Water | |
      9. 10.3.9 Tania Water | |
      10. 10.3.10 Agthia Group | |
      11. 10.3.11 Oska Water
  11. 11 Recent Developments & News (2023–2025)
  12. 12 Report Scope & Methodology |
    1. 12.1 Study Period & Base Year |
    2. 12.2 Data Sources & Citations |
    3. 12.3 Abbreviations
  13. 13 Detailed Sources & Citations
  14. 14 Frequently Asked Questions (FAQs)
  15. 15 LIST OF TABLES
  16. 16 LIST OF FIGURES
Share::
Request Free Sample

Segmentation Quick Reference

DimensionSub-SegmentsDominant SegmentFastest Growing Segment
By Product TypeStill Water; Sparkling / Carbonated Water; Flavoured Water; Functional & Enhanced WaterStill WaterFunctional & Enhanced Water
By Packaging TypePET Bottles; Returnable Multi-Gallon; Glass Bottles; Cans & CartonsPET BottlesCans & Cartons
By Distribution ChannelSupermarkets & Hypermarkets; Convenience & Grocery (Baqala); On-Trade / HORECA & Institutional; Home & Office Delivery; Online Retail & Q-CommerceSupermarkets & HypermarketsOnline Retail & Q-Commerce
By RegionCentral Region; Western Region; Eastern Province; Southern Region; Northern & Border RegionsCentral RegionWestern Region


Market Segmentation Overview

By Product Type

Sub-SegmentKey Trend
Still WaterVolume backbone; competition shifts from price to mineral-profile claims and pack architecture
Sparkling / Carbonated WaterConcentrated in fine dining and hotel channels; glass format drives realised price
Flavoured WaterSugar-reduction reformulation opens shelf space against carbonated soft drinks
Functional & Enhanced WaterAlkaline and electrolyte variants scale fastest; wellness retail is the primary gateway


Product mix is bifurcating rather than shifting wholesale. Still water keeps its volume dominance while functional and flavoured formats absorb the majority of incremental margin, which pushes bottlers toward dual-line capability rather than single-format scale.

By Packaging Type

Sub-SegmentKey Trend
PET BottlesLightweighting near practical limits; recycled-content thresholds become the next cost variable
Returnable Multi-GallonSubscription replenishment locks recurring revenue; route density determines profitability
Glass BottlesLuxury hospitality and destination resorts sustain premium realisation despite freight cost
Cans & CartonsSustainability-led listings and event channels drive the fastest percentage growth


Packaging decisions increasingly carry regulatory weight rather than purely commercial weight. Securing food-grade recycled resin supply ahead of mandate deadlines separates operators who will absorb compliance cost smoothly from those facing step-change margin compression.

By Distribution Channel

Sub-SegmentKey Trend
Supermarkets & HypermarketsMultipack basket economics; private-label share continues to expand
Convenience & Grocery (Baqala)Single-serve impulse remains large but is losing incremental share
On-Trade / HORECA & InstitutionalContract tenders tied to pilgrimage and giga-project catering
Home & Office DeliveryLowest churn of any channel once dispenser installation is complete
Online Retail & Q-CommerceFastest growth; delivers granular demand data alongside volume


Channel strategy now determines competitive outcome more than product formulation. Operators controlling their own delivery fleets capture margin that aggregators otherwise extract, and the data generated by direct fulfilment is becoming an asset in its own right.

By Region

Sub-SegmentKey Trend
Central RegionPremium tier concentration; Riyadh population expansion sustains demand growth
Western RegionPilgrimage-linked institutional volume; destination self-supply emerging
Eastern ProvinceIndustrial hydration mandates create contract-locked bulk demand
Southern RegionDomestic tourism lifts seasonal volume; distribution cost is the binding constraint
Northern & Border RegionsProject-linked demand concentrated around construction workforce accommodation


Regional dynamics reward local density over national footprint. Freight economics protect incumbents in outlying provinces, which explains why consolidation has advanced more slowly here than in comparable Gulf beverage categories.




Share::
Request Free Sample
Download PDF ×

We do not share your information with anyone. However, we may send you emails based on your report interest from time to time. You may contact us at any time to opt-out.