Segmentation Quick Reference
| Dimension | Sub-Segments | Dominant Segment | Fastest Growing Segment |
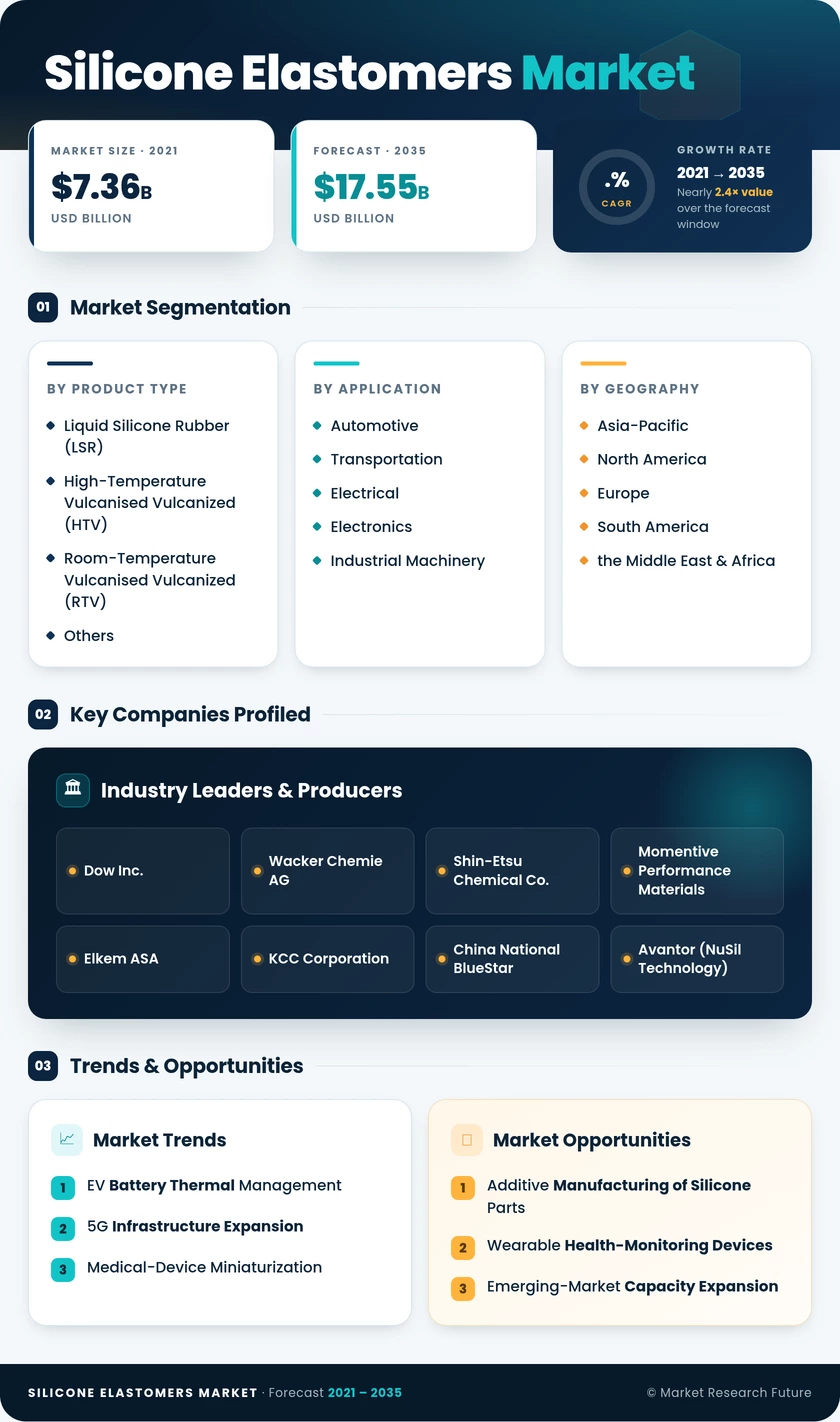
| Product Type | Liquid Silicone Rubber (LSR), High-Temperature Vulcanized (HTV), Room-Temperature Vulcanized (RTV), Others | Liquid Silicone Rubber (LSR) | Liquid Silicone Rubber (LSR) |
| Application | Automotive and Transportation, Electrical and Electronics, Industrial Machinery, Consumer Goods, Silicone Elastomers Market, Others | Automotive and Transportation | Electrical and Electronics |
| Geography | Asia-Pacific, North America, Europe, South America, the Middle East & Africa | Asia-Pacific | Asia-Pacific |
Market Segmentation Overview
By Product Type
| Sub-Segment | Key Trend |
| Liquid Silicone Rubber (LSR) | Rapid adoption in precision medical and EV thermal-management molding |
| High-Temperature Vulcanized (HTV) | Sustained demand for power-grid insulators and heavy-industrial seals |
| Room-Temperature Vulcanized (RTV) | Growth in construction sealant and electronics conformal-coating applications |
| Others | Niche fluorosilicone and phenyl-silicone grades for aerospace and fuel-contact roles |
Liquid Silicone Rubber continues to gain share as automated injection-molding technology reduces cycle times and enables tighter tolerances across medical and automotive production lines. HTV remains essential where thick cross-sections and high mechanical strength are non-negotiable, particularly in industrial and utility applications.
By Application
| Sub-Segment | Key Trend |
| Automotive and Transportation | EV battery sealing, ADAS sensor housings, under-hood thermal management |
| Electrical and Electronics | 5G radome gaskets, LED encapsulants, semiconductor packaging |
| Industrial Machinery | High-durability seals, vibration-dampening mounts, conveyor components |
| Consumer Goods | Kitchenware, wearable-device bands, and personal-care appliance gaskets |
| Silicone Elastomers Market | Architectural glazing sealants, expansion joints and waterproofing membranes |
| Others | Aerospace seals, energy-sector gaskets, defense-grade encapsulation |
Automotive and Transportation anchors the largest revenue pool as global EV production scales, while Electrical and Electronics captures the highest growth rate driven by 5G deployment and AI-server thermal management needs.
By Geography
| Sub-Segment | Key Trend |
| Asia-Pacific | Electronics manufacturing hub, EV production scale, new compounding capacity |
| North America | Medical-device leadership, defense spending, EV battery plants |
| Europe | REACH compliance investment, automotive lightweighting, renewable-energy sealing |
| South America | Silicone Elastomers Market sealant demand, consumer-goods manufacturing |
| Middle East & Africa | Infrastructure mega-projects, power-grid expansion, and petrochemical diversification |
Asia-Pacific dominates both market share and growth rate, driven by China's electronics ecosystem and India's electronics PLI-driven manufacturing expansion. North America and Europe sustain premium-value niches through regulatory-intensive medical and automotive applications.