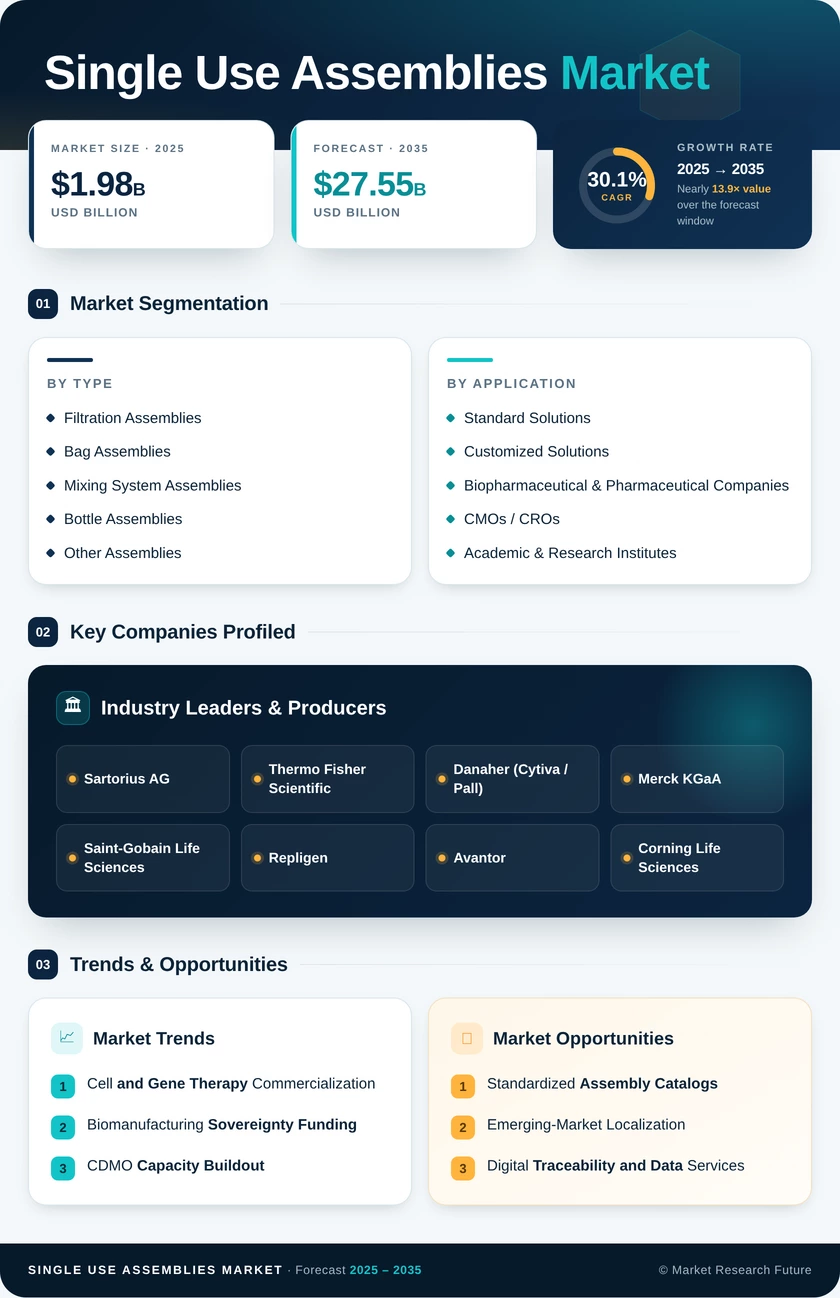
Single-use Assemblies Market (2026 - 2035)

Single-Use Assemblies Market Research Report: Size, Share, Trend Analysis By Applications (Biopharmaceutical Manufacturing, Vaccination, Cell Culture, Tissue Engineering), By Component Type (Bag Systems, Filters, Connectors, Tubing), By Material Type (Polyethylene, Polypropylene, Polyvinyl Chloride, Thermoplastic Elastomers), By End Users (Pharmaceutical Companies, Contract Manufacturing Organizations, Research Laboratories) and By Regional (North America, Europe, South America, Asia Pacific, Middle East and Africa) - Growth Outlook & Industry Forecast 2025 To 2035

Forecast Period
2026-2035
CAGR
30.1%
2025 Market Size
USD 1.98 Billion
2035 Market Size
USD 27.55 Billion
Healthcare ● Updated August 2026 Report ID: MRFR/HC/19931-HCR | Pages: 128 | Author: Nidhi Mandole, Rahul Gotadki
  1. 1 Market Summary |
    1. 1.1 Study Assumptions & Market Definition |
    2. 1.2 Scope of the Study |
    3. 1.3 Research Methodology
  2. 2 Key Report Takeaways |
    1. 2.1 By Technology (Product) |
    2. 2.2 By Sector (Application & End User) |
    3. 2.3 By Geography
  3. 3 Market Size & Forecast (2021–2035) |
    1. 3.1 Historical Market Size (2021–2024) |
    2. 3.2 Base Year Calibration (2025) |
    3. 3.3 Forecast Market Size (2026–2035) |
    4. 3.4 Year-over-Year Growth Analysis
  4. 4 Driver Impact Analysis |
    1. 4.1 Cell and Gene Therapy Commercialization |
    2. 4.2 Biomanufacturing Sovereignty Funding |
    3. 4.3 CDMO Capacity Buildout |
    4. 4.4 Facility Conversion Economics
  5. 5 Restraints Impact Analysis |
    1. 5.1 Sterilization Bottlenecks |
    2. 5.2 Extractables and Leachables Qualification |
    3. 5.3 Polymer Supply Concentration
  6. 6 Opportunity Analysis |
    1. 6.1 Standardized Assembly Catalogs |
    2. 6.2 Emerging-Market Localization |
    3. 6.3 Digital Traceability and Data Services |
    4. 6.4 Continuous and Intensified Processing |
    5. 6.5 Circularity and Recovery Programs |
    6. 6.6 Industry Value Chain Analysis |
    7. 6.7 Porter's Five Forces Analysis
  7. 7 Regional Market Share & Country-Level Analysis |
    1. 7.1 North America | |
      1. 7.1.1 US | |
      2. 7.1.2 Canada | |
      3. 7.1.3 Mexico |
    2. 7.2 Europe | |
      1. 7.2.1 Germany | |
      2. 7.2.2 UK | |
      3. 7.2.3 France | |
      4. 7.2.4 Italy | |
      5. 7.2.5 Spain | |
      6. 7.2.6 Nordic Countries | |
      7. 7.2.7 Russia | |
      8. 7.2.8 Rest of Europe |
    3. 7.3 Asia-Pacific | |
      1. 7.3.1 China | |
      2. 7.3.2 India | |
      3. 7.3.3 Japan | |
      4. 7.3.4 South Korea | |
      5. 7.3.5 ASEAN | |
      6. 7.3.6 Rest of Asia-Pacific |
    4. 7.4 South America | |
      1. 7.4.1 Brazil | |
      2. 7.4.2 Argentina | |
      3. 7.4.3 Rest of South America |
    5. 7.5 Middle East & Africa | |
      1. 7.5.1 Saudi Arabia | |
      2. 7.5.2 UAE | |
      3. 7.5.3 South Africa | |
      4. 7.5.4 Egypt | |
      5. 7.5.5 Rest of Middle East & Africa
  8. 8 Future Outlook (2026–2035) |
    1. 8.1 Automation and Closed Robotics |
    2. 8.2 Platform Economics and Supplier Lock-In |
    3. 8.3 Distributed and Point-of-Care Manufacturing |
    4. 8.4 Sustainability Reporting
  9. 9 Market Segmentation Analysis |
    1. 9.1 By Product | |
      1. 9.1.1 Bag Assemblies | |
      2. 9.1.2 Filtration Assemblies | |
      3. 9.1.3 Bottle Assemblies | |
      4. 9.1.4 Mixing System Assemblies | |
      5. 9.1.5 Other Assemblies |
    2. 9.2 By Application | |
      1. 9.2.1 Filtration | |
      2. 9.2.2 Storage & Transport | |
      3. 9.2.3 Cell Culture & Mixing | |
      4. 9.2.4 Sampling | |
      5. 9.2.5 Fill-Finish |
    3. 9.3 By Solution | |
      1. 9.3.1 Standard Solutions | |
      2. 9.3.2 Customized Solutions |
    4. 9.4 By End User | |
      1. 9.4.1 Biopharmaceutical & Pharmaceutical Companies | |
      2. 9.4.2 CMOs / CROs | |
      3. 9.4.3 Academic & Research Institutes
  10. 10 Competitive Landscape |
    1. 10.1 Market Concentration Analysis (2026) |
    2. 10.2 Competitive Benchmarking Matrix |
    3. 10.3 Company Profiles | |
      1. 10.3.1 Sartorius AG | |
      2. 10.3.2 Thermo Fisher Scientific | |
      3. 10.3.3 Danaher (Cytiva / Pall) | |
      4. 10.3.4 Merck KGaA | |
      5. 10.3.5 Saint-Gobain Life Sciences | |
      6. 10.3.6 Repligen Corporation | |
      7. 10.3.7 Avantor | |
      8. 10.3.8 Corning Life Sciences | |
      9. 10.3.9 Entegris | |
      10. 10.3.10 Parker Hannifin | |
      11. 10.3.11 Meissner Filtration Products | |
      12. 10.3.12 CPC (Dover)
  11. 11 Recent News & Developments
  12. 12 Report Scope & Methodology |
    1. 12.1 Study Period & Base Year |
    2. 12.2 Valuation Currency & Conventions |
    3. 12.3 Abbreviations
  13. 13 Detailed Sources & Citations
  14. 14 Frequently Asked Questions
  15. 15 LIST OF TABLES |
  16. TABLE 1 Global Single-use Assemblies Market Size & Forecast, by Revenue (USD billion), 2021–2035 |
  17. TABLE 2 Global Single-use Assemblies Market – Year-over-Year Growth Analysis, 2021–2035 |
  18. TABLE 3 Driver Impact Analysis – Weighting, Geography & Timeline, 2026–2035 |
  19. TABLE 4 Restraint Impact Analysis – Weighting, Geography & Timeline, 2026–2035 |
  20. TABLE 5 Global Single-use Assemblies Market Size, by Region, 2021–2035 (USD billion) |
  21. TABLE 6 North America Single-use Assemblies Market Size, by Country, 2021–2035 (USD billion) |
  22. TABLE 7 Europe Single-use Assemblies Market Size, by Country, 2021–2035 (USD billion) |
  23. TABLE 8 Asia-Pacific Single-use Assemblies Market Size, by Country, 2021–2035 (USD billion) |
  24. TABLE 9 South America Single-use Assemblies Market Size, by Country, 2021–2035 (USD billion) |
  25. TABLE 10 Middle East & Africa Single-use Assemblies Market Size, by Country, 2021–2035 (USD billion) |
  26. TABLE 11 Global Single-use Assemblies Market Size, by Product, 2021–2035 (USD billion) |
  27. TABLE 12 Global Single-use Assemblies Market Size, by Application, 2021–2035 (USD billion) |
  28. TABLE 13 Global Single-use Assemblies Market Size, by Solution, 2021–2035 (USD billion) |
  29. TABLE 14 Global Single-use Assemblies Market Size, by End User, 2021–2035 (USD billion) |
  30. TABLE 15 North America Single-use Assemblies Market Size, by Product, 2021–2035 (USD billion) |
  31. TABLE 16 Europe Single-use Assemblies Market Size, by Application, 2021–2035 (USD billion) |
  32. TABLE 17 Asia-Pacific Single-use Assemblies Market Size, by End User, 2021–2035 (USD billion) |
  33. TABLE 18 Competitive Benchmarking Matrix – Global Single-use Assemblies Market, 2026 |
  34. TABLE 19 Company Profiles – Key Players, Global Single-use Assemblies Market |
  35. TABLE 20 Recent Developments & Strategic Announcements, 2023–2025 |
  36. TABLE 21 Report Scope & Methodology Summary |
  37. TABLE 22 Detailed Sources & Citations Index |
  38. TABLE 23 Segmentation Quick Reference – Dominant & Fastest Growing Segments
  39. 16 LIST OF FIGURES |
  40. FIGURE 1 Global Single-use Assemblies Market – Market Dynamics Snapshot (Drivers, Restraints, Opportunities) |
  41. FIGURE 2 Industry Value Chain Analysis – Resin to Validated Assembly |
  42. FIGURE 3 Porter's Five Forces Analysis – Single-use Assemblies Market |
  43. FIGURE 4 Market Size Trend Line, 2021–2035 (USD billion) |
  44. FIGURE 5 Year-over-Year Growth Curve, 2022–2035 (%) |
  45. FIGURE 6 Market Share by Product, 2025 vs. 2035 (%) |
  46. FIGURE 7 Market Share by Application, 2025 vs. 2035 (%) |
  47. FIGURE 8 Market Share by Solution, 2025 vs. 2035 (%) |
  48. FIGURE 9 Market Share by End User, 2025 vs. 2035 (%) |
  49. FIGURE 10 Regional Revenue Share, 2025 (%) |
  50. FIGURE 11 Regional CAGR Comparison, 2026–2035 (%) |
  51. FIGURE 12 North America Country-Level Share Breakdown, 2025 (%) |
  52. FIGURE 13 Asia-Pacific Country-Level Growth Comparison, 2026–2035 (%) |
  53. FIGURE 14 Competitive Landscape – Revenue Share Band Positioning, 2026 |
  54. FIGURE 15 Strategic Positioning Matrix – Portfolio Breadth vs. Customization Capability
Share::
Request Free Sample

Segmentation Quick Reference

DimensionSub-SegmentsDominant SegmentFastest Growing Segment
By ProductBag Assemblies; Filtration Assemblies; Bottle Assemblies; Mixing System Assemblies; Other AssembliesFiltration AssembliesBag Assemblies
By ApplicationFiltration; Storage & Transport; Cell Culture & Mixing; Sampling; Fill-FinishFiltrationCell Culture & Mixing
By SolutionStandard Solutions; Customized SolutionsStandard SolutionsCustomized Solutions
By End UserBiopharmaceutical & Pharmaceutical Companies; CMOs / CROs; Academic & Research InstitutesBiopharmaceutical & Pharmaceutical CompaniesCMOs / CROs
By GeographyNorth America; Europe; Asia-Pacific; South America; Middle East & AfricaNorth AmericaAsia-Pacific


Market Segmentation Overview

By Product

Sub-SegmentKey Trend
Bag Assemblies2D and 3D formats displacing stainless hold vessels across buffer, media, and harvest duty
Filtration AssembliesSterilizing-grade capsule consumption rises with every added process step.
Bottle AssembliesClosed sampling protocols under Annex 1 lift small-volume transfer demand
Mixing System AssembliesBuffer preparation converts first in most stainless-to-disposable retrofits.
Other AssembliesManifolds and genderless connectors standardize around a few dominant ecosystems.


Product conversion is uneven by design. Filters and connectors switched to disposable formats a decade ago, while large-volume mixing and hold vessels are only now converting as bag film strength and sensor integration mature.

By Application

Sub-SegmentKey Trend
FiltrationHighest per-batch consumption intensity; conversion largely complete at commercial scale
Storage & TransportFrozen intermediate shipping drives demand for validated cold-chain bag systems
Cell Culture & MixingPerfusion campaigns consume assemblies continuously rather than per batch.
SamplingAseptic sampling manifolds replace open-port sampling under tightened GMP expectations.
Fill-FinishClosed transfer to filling lines becomes standard for sterile drug product.


Application growth tracks process intensification more than facility count. Continuous upstream operation multiplies consumption per gram of product, which is why cell culture and mixing outpace the broader market despite a smaller installed base.

By Solution

Sub-SegmentKey Trend
Standard SolutionsCatalog SKUs compress lead times to roughly four weeks and reduce qualification cost.
Customized SolutionsNovel modalities require bespoke fluid path geometry with no catalog equivalent.


Standard versus custom is fundamentally a lead-time trade. Buyers accept design compromise to secure availability, and suppliers respond by expanding pre-validated catalogs that cover the majority of common configurations.

By End User

Sub-SegmentKey Trend
Biopharmaceutical & Pharmaceutical CompaniesCommercial biologics portfolios anchor baseline volume and long-term supply contracts.
CMOs / CROsMulti-client suites multiply changeover events and therefore assembly consumption.
Academic & Research InstitutesTranslational ATMP research seeds early platform preference for later commercial scale


End-user mix is shifting toward outsourcing. Every program a contract manufacturer adds increases turnover frequency, and turnover frequency — not installed litres — is the truest predictor of assembly demand.




Share::
Request Free Sample
Download PDF ×

We do not share your information with anyone. However, we may send you emails based on your report interest from time to time. You may contact us at any time to opt-out.