Segmentation Quick Reference
| Dimension | Sub-Segments | Dominant Segment (2025) | Fastest Growing Segment (2026–2035) |
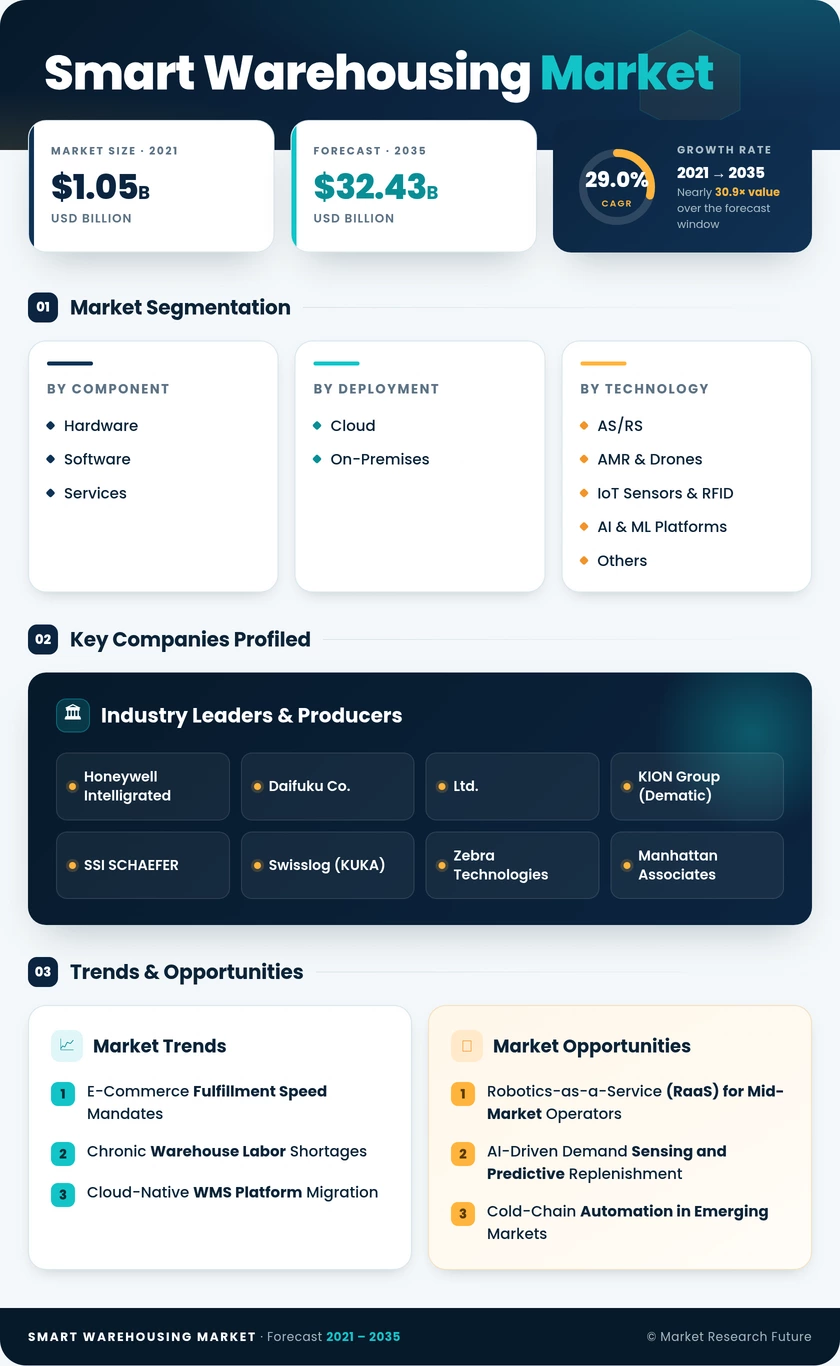
| Component | Hardware, Software, Services | Software (43.5% share) | Services (CAGR 19.3%) |
| Deployment | Cloud, On-Premises | Cloud (55.8% share) | Cloud (leading CAGR) |
| Technology | AS/RS, AMR & Drones, IoT Sensors & RFID, AI & ML Platforms, Others | AS/RS (30.5% share) | AI & ML Platforms (CAGR 24.8%) |
| End-User | Retail & E-Commerce, Manufacturing, Healthcare & Pharma, Food & Beverage, 3PL, Others | Retail & E-Commerce (35.2% share) | Healthcare & Pharma (CAGR 22.2%) |
| Geography | North America, Europe, Asia-Pacific, South America, MEA | North America (36.1% share) | Asia-Pacific (CAGR 17.9%) |
Market Segmentation Overview
By Component
| Sub-Segment | Key Trend |
| Hardware | AS/RS and conveyor installations are driving the bulk of capex in greenfield facilities. |
| Software | Cloud-native WMS platforms with embedded AI analytics are dominating new deployments. |
| Services | System integration and managed-service contracts are expanding as automation complexity grows. |
Software remains the value center as operators increasingly purchase hardware through bundled software subscriptions rather than stand-alone equipment orders, shifting revenue composition toward recurring license fees.
By Deployment
| Sub-Segment | Key Trend |
| Cloud | Multi-tenant SaaS WMS enabling rapid multi-site rollouts with centralized analytics |
| On-Premises | Retained in defense, pharma cold-chain, and data-sovereignty-sensitive verticals |
Cloud deployment continues to capture share as API-first architectures simplify integration with ERP, TMS, and IoT sensor ecosystems.
By Technology
| Sub-Segment | Key Trend |
| Automated Storage & Retrieval Systems (AS/RS) | High-density cube and shuttle systems for urban micro-fulfillment |
| Autonomous Mobile Robots & Drones | Fleet-management software enabling scalable goods-to-person workflows |
| IoT Sensors & RFID | Real-time condition monitoring and serialized track-and-trace |
| AI & Machine Learning Platforms | Predictive demand sensing, dynamic slotting, and labor planning |
| Others | Conveyor sortation, voice-directed picking, augmented-reality pick guidance |
AS/RS and AMR technologies together represent over half of technology-level revenue, reflecting operator preference for physical automation that delivers immediate throughput and accuracy gains.
By End-User
| Sub-Segment | Key Trend |
| Retail & E-Commerce | Same-day and next-day delivery mandates are driving AMR and micro-fulfillment adoption |
| Manufacturing | Just-in-time staging and kitting automation for lean production lines |
| Healthcare & Smart Warehousing Markets | GDP-compliant cold-chain automation and serialization mandates |
| Food & Beverage | Perishable inventory rotation, freshness tracking, and temperature-controlled AS/RS |
| Third-Party Logistics (3PL) | Multi-client warehouse optimization through flexible, reconfigurable automation |
| Others | Automotive spare-parts, aerospace MRO, government strategic reserves |
Retail and e-commerce will continue to anchor total market volume, while healthcare and pharmaceutical end-users drive the highest incremental CAGR through regulatory-mandated automation upgrades.