Smart Workplace Market (2026 - 2035)

Smart Workplace Market Size, Share and Research Report By Component (Software and Services), By Product (Smart Lighting, Security Systems, Energy Management Systems and HVAC Control Systems), By Communication Technology (Wired and Wireless) And By Region (North America, Europe, Asia-Pacific, And Rest Of The World) –Industry Forecast Till 2035
ID: MRFR/SEM/3052-HCR
100 Pages
Ankit Gupta
Last Updated: July 06, 2026
Smart Workplace Market
Market Size
Forecast Period2026-2035
CAGR (2026-2035)12.1%
2025 Market SizeUSD 51.48 billion
2035 Market SizeUSD 161.28 billion
Key Players
Cisco Systems
Microsoft Corporation
Siemens AG
Honeywell International
Johnson Controls International
Schneider Electric
Opportunities
  • AI-Powered Autonomous Building Operations
  • Emerging-Market Smart-City Construction
  • Data Monetization and Workplace-as-a-Service Models

Smart Workplace Market Summary

The Smart Workplace Market reached an estimated USD 51.48 billion in 2025, poised to climb from USD 57.71 billion in 2026 to USD 161.28 billion by 2035 at a compound annual growth rate (CAGR) of 12.1% during the 2026–2035 forecast window. Two forces are accelerating adoption at a pace few technology categories match: first, updated energy-performance mandates like ASHRAE Standard 90.1-2022 and local building-performance laws in cities such as New York (Local Law 97) and London (MEES regulations) are pushing landlords toward intelligent HVAC, lighting, and space-utilization platforms [1][2]. Second, the structural shift to hybrid work has turned real-time occupancy data from a convenience into an operational necessity for facility managers juggling fluctuating headcounts.

The cloud-connected sensor networks, AI-powered climate control, and integrated desk-reservation platforms are replacing the traditional building-management systems built for static 9-to-5 occupancy. In fact, corporate real-estate teams claim energy savings of 25-35% after adopting intelligent building systems; productivity metrics measured by anonymized workplace analytics imply production improvements of over 40% in pilot projects [3][4]. In 2024, commercial smart building retrofits attracted investments of over USD 28 billion globally, indicating that even the existing building stock is being included in the Smart Workplace Market fold [5].

North America represented a substantial share of the Smart Workplace Market in 2024, around 37.1%, due to early enterprise adoption in the United States and Canada. Asia-Pacific is the fastest-growing area and is expected to have a CAGR of 14.4% through 2035, as increasing urbanization in China, India and ASEAN countries drives new commercial buildings. The second highest share was held by Europe with roughly 27.0% because to the need to meet EU taxonomy-aligned standards for restoration. With maturing AI capabilities and falling sensor prices, the Smart Workplace Market is approaching a decade of compounding momentum.


Key Report Takeaways

• By Component

  • Smart lighting systems accounted for approximately 30.6% of Smart Workplace Market revenue in 2024, reflecting strong adoption of tunable-white and human-centric lighting across Class A office buildings.
  • Sensors and edge devices are forecast to expand at a 14.7% CAGR from 2026 to 2035, driven by falling hardware costs and growing demand for real-time environmental monitoring.

• By Solution Type

  • Hardware represented roughly 49.3% of the Smart Workplace Market in 2024, encompassing connected luminaires, HVAC actuators, occupancy sensors, and access-control endpoints.
  • Cloud and SaaS solutions are projected to grow at a 14.8% CAGR through 2035, outpacing on-premises software as multi-tenant analytics platforms gain traction.

• By Geography

  • North America commanded a 37.1% share of the Smart Workplace Market in 2024, with the United States alone contributing over two-thirds of regional revenue.
  • Asia-Pacific is set to record the highest regional CAGR of 14.4% during the forecast period, propelled by smart-city initiatives across China, India, and South Korea.


Market Size and Forecast (2021–2035)

Market Research Future (MRFR) uses a bottom-up revenue model, which sums vendor shipments, software license and managed-service contract values in commercial working contexts. Historical estimates (2021-2024) are based on available financial disclosures and industry association data; the prediction employs a calibrated 12.1% CAGR for 2026-2035, tested against macroeconomic indices and technology adoption curves.
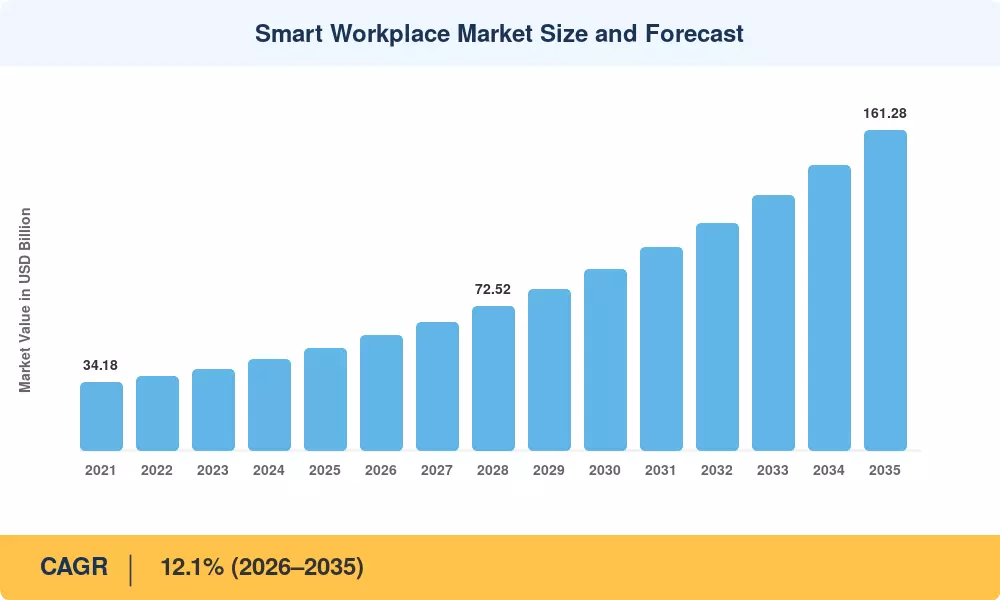
Smart Workplace Market Size and Forecast
Our Impact
Enabled $4.3B Revenue Impact for Fortune 500 and Leading Multinationals
Partnering with 2000+ Global Organizations Each Year
30K+ Citations by Top-Tier Firms in the Industry

Driver Impact Analysis

Driver ~% Impact on CAGR Geographic Relevance Impact Timeline
Hybrid-work real-estate rationalization +2.4% Global Short-term (≤2 yr)
Building energy-performance mandates +2.1% North America, Europe Medium-term (2–4 yr)
IoT sensor and edge hardware cost declines +1.8% Global Short-term (≤2 yr)
AI-driven occupancy and climate optimization +1.6% North America, Asia-Pacific Medium-term (2–4 yr)
ESG reporting and green-building certification +1.3% Europe, Asia-Pacific Long-term (≥4 yr)
Cybersecurity and smart-building insurance incentives +0.9% North America, Europe Medium-term (2–4 yr)
Government smart-city stimulus programs +0.8% Asia-Pacific, MEA Long-term (≥4 yr)


Hybrid-Work Real-Estate Rationalization

Corporate occupiers slashed an average of 18% of their leased footprints between 2022 and 2024, according to CBRE data, but the remaining space must work harder [7]. Firms now allocate USD 120–180 per employee annually on workspace-optimization technology to avoid over-provisioning desks, meeting rooms, and climate conditioning. This spending directly feeds the Smart Workplace Market, because digital booking systems and real-time space-utilization dashboards are the tools that make a smaller, flexible footprint viable.

Building Energy-Performance Mandates

New York City's Local Law 97 requires buildings over 25,000 sq ft to meet emissions caps starting in 2024, with penalties reaching USD 268 per metric ton of excess CO₂ [2]. Similar mandates in Washington, D.C., Boston, and across the EU's Energy Performance of Buildings Directive recast mean that non-compliant landlords face both financial penalties and tenant attrition. Smart HVAC and lighting platforms that cut energy use by 25–35% represent the lowest-risk compliance pathway, making them a durable growth catalyst for the Smart Workplace Market.

IoT Sensor and Edge Hardware Cost Declines

Average prices for commercial-grade occupancy sensors dropped nearly 38% between 2020 and 2025, while Bluetooth Low Energy beacons now cost under USD 8 per unit at scale [9]. This price compression has opened the Smart Workplace Market to small and medium offices that previously could not justify a full sensor build-out, expanding the addressable market by an estimated 30% relative to 2020 baselines.

AI-Driven Occupancy and Climate Optimization

Machine-learning algorithms that predict building occupancy 24 hours in advance enable pre-conditioning of HVAC zones, cutting peak energy loads by up to 20% according to a 2024 U.S. Department of Energy study [10]. Generative-AI copilots are beginning to surface actionable recommendations to facility managers in natural language, lowering the skill barrier for Smart Workplace Market adoption in organizations without dedicated building-science teams.

Restraints Impact Analysis

The restraints below quantify headwinds that slow the Smart Workplace Market expansion rate. As with drivers, impact percentages are directional and non-additive.

Restraint ~% Impact on CAGR Geographic Relevance Impact Timeline
Employee data privacy and surveillance concerns −1.2% Europe, North America Short-term (≤2 yr)
Legacy building-infrastructure incompatibility −1.0% Global Medium-term (2–4 yr)
Fragmented vendor ecosystems and interoperability gaps −0.8% Global Medium-term (2–4 yr)
Cybersecurity vulnerabilities in IoT endpoints −0.7% Global Long-term (≥4 yr)
High upfront retrofit costs for older stock −0.5% South America, MEA Long-term (≥4 yr)


Employee Data-Privacy and Surveillance Concerns

Europe's GDPR imposes strict limitations on continuous workplace monitoring, and the EU AI Act classifies certain employee-tracking algorithms as high-risk, requiring conformity assessments before deployment [14]. In the United States, state-level biometric information privacy acts in Illinois, Texas, and Washington create a patchwork compliance burden. These regulations do not block Smart Workplace Market growth outright, but they lengthen sales cycles and increase vendor compliance costs by an estimated 10–15%.

Legacy Building-Infrastructure Incompatibility

Approximately 60% of commercial office stock in mature markets was constructed before 2000, with wiring, ductwork, and control panels that lack the digital backbone smart systems require [15]. Retrofit projects in these buildings can cost 30–50% more than deployments in new construction, discouraging building owners from participating in the Smart Workplace Market until lease-cycle economics justify the expenditure.

Fragmented Vendor Ecosystems

Many enterprises report managing five or more separate workplace-technology vendors for lighting, HVAC, security, and space management, with limited protocol interoperability between them [16]. The resulting integration complexity adds 15–25% to total implementation costs and slows time-to-value, creating friction that disproportionately affects mid-market Smart Workplace Market adoption.

Smart Workplace Market Opportunities

AI-Powered Autonomous Building Operations

Advances in reinforcement learning now allow building systems to self-tune HVAC set-points, lighting schedules, and ventilation rates without human intervention. Early pilots at Google's Bay View campus demonstrated a 28% reduction in operational energy costs through autonomous control loops [10]. As these algorithms become commercially available through platforms like Siemens Building X and Johnson Controls OpenBlue, they will unlock a premium software tier within the Smart Workplace Market.

Emerging-Market Smart-City Construction

India's Smart Cities Mission has earmarked over USD 7 billion for urban infrastructure upgrades across 100 cities. At the same time, Saudi Arabia's NEOM and Egypt's New Administrative Capital represent greenfield opportunities where Smart Workplace Market technologies are designed-in from day one [13][17]. These markets combine high construction velocity with government co-funding, creating conditions for rapid deployment at scale.

Data Monetization and Workplace-as-a-Service Models

Aggregated and anonymized occupancy data holds significant value for commercial real-estate investors, urban planners, and insurance underwriters. Vendors that offer subscription-based analytics dashboards — converting raw sensor feeds into actionable portfolio intelligence — can capture recurring SaaS revenue while deepening customer stickiness within the Smart Workplace Market.

Co-Working and Flex-Space Digitization

The global co-working sector is expanding rapidly, with operators opening over 8,000 new locations between 2023 and 2025 [18]. Each location requires granular desk-level monitoring, HVAC zoning, and automated billing tied to space usage — requirements that are native use cases for the Smart Workplace Market. Operators like WeWork, IWG, and regional players are investing heavily in sensor-enabled fit-outs.

Cybersecurity and Smart-Building Insurance

Cyber insurance carriers are beginning to offer premium discounts of 5–12% for buildings that deploy certified IoT security stacks and zero-trust network architectures [12]. This creates a financial incentive loop where Smart Workplace Market investments lower insurance costs, improving the ROI calculus for risk-averse building owners.

Smart Workplace Market Future Outlook

AI-Autonomous and Self-Healing Buildings

By 2030, buildings equipped with reinforcement-learning control systems will begin operating in near-autonomous modes, adjusting lighting, temperature, and ventilation in real time without human input. The International Energy Agency projects that AI-optimized commercial buildings could reduce global building-sector emissions by 12% by 2035 [10][19]. This shift will redefine the value proposition of the Smart Workplace Market from "monitoring dashboards" to "outcome-guaranteed performance contracts."

Platform Consolidation and Ecosystem Economics

The current landscape of fragmented point solutions is giving way to integrated workplace-experience platforms. Cisco, Microsoft, and Siemens are each building end-to-end stacks that combine room booking, environmental control, security, and employee engagement into single-pane-of-glass interfaces. By the early 2030s, the Smart Workplace Market will likely consolidate around three to four dominant platform ecosystems, with smaller vendors integrating via open APIs rather than competing head-to-head [16].

ESG Compliance as a Revenue-Grade Data Layer

As mandatory sustainability reporting frameworks — the EU Corporate Sustainability Reporting Directive, SEC climate-disclosure rules, and ISSB standards — mature, commercial buildings will need granular, auditable energy and emissions data [11][20]. The Smart Workplace Market is uniquely positioned to supply this data layer, transforming environmental sensors from operational tools into compliance infrastructure that directly serves CFOs and sustainability officers.

Generative AI and the Adaptive Workplace

Large language models and multimodal AI will enable facility managers and employees to interact with building systems through natural-language commands — "prepare the fifth floor for a 200-person event at 2 PM" — triggering automated workflows across HVAC, lighting, access, and catering systems. This conversational interface layer will lower the skill barrier for the Smart Workplace Market, expanding adoption into organizations that lack dedicated building-engineering teams and accelerating the shift to intent-based building operations [10].

Smart Workplace Market Segmentation

By Component

Segment Key Metric Primary Demand Driver
Smart Lighting Systems 30.6% share (2024) Human-centric lighting and circadian tuning
HVAC Control Systems USD 10.82 billion (2025) Energy-performance compliance
Sensors & Edge Devices 14.7% CAGR (2026–2035) Cost declines and miniaturization
Security & Access Control USD 7.46 billion (2025) Touchless entry post-pandemic
Others 9.8% share (2024) Audio-visual, wayfinding, digital signage


Smart lighting systems lead the Smart Workplace Market by component, as LED-based tunable-white fixtures now incorporate occupancy sensors and daylight harvesting in a single luminaire. The segment benefits from rapid payback periods — typically under three years — making it the most common entry point for organizations beginning their smart-building journey. Sensors and edge devices represent the fastest-growing component, fueled by Bluetooth Low Energy beacon prices that have dropped below USD 8 per unit and millimeter-wave radar sensors that offer desk-level granularity without capturing personally identifiable images [9].

By Solution Type

Segment Key Metric Primary Demand Driver
Hardware 49.3% share (2024) Sensor, actuator, and gateway deployments
Software Platforms USD 11.95 billion (2025) Integrated workplace-experience management
Cloud / SaaS 14.8% CAGR (2026–2035) Multi-site portfolio analytics
Professional Services 8.4% share (2024) System integration and commissioning


Hardware still constitutes the largest share of the Smart Workplace Market by solution type, reflecting the physical infrastructure needed to instrument a building. Cloud and SaaS solutions, however, are growing substantially faster as multi-tenant analytics platforms allow landlords and enterprise occupiers to manage dozens of buildings from a single dashboard — a capability particularly valuable for global corporations standardizing workplace experience across geographies.

By Building Size

Segment Key Metric Primary Demand Driver
Large Enterprises 58.0% share (2024) Portfolio-wide standardization mandates
Small and Medium Offices 15.0% CAGR (2026–2035) Turnkey SaaS packages and lower sensor costs


Large enterprises dominate the Smart Workplace Market by building size, driven by corporate mandates to standardize environmental and space-management systems across multi-building portfolios. Small and medium offices are the faster-growing segment; however, as out-of-the-box sensor kits priced under USD 5,000 and subscription-based analytics make building intelligence accessible to organizations that previously considered it cost-prohibitive.

By End-User Industry

Segment Key Metric Primary Demand Driver
Corporate & Co-Working Spaces 35.4% share (2024) Flex-space utilization optimization
Healthcare Facilities USD 5.92 billion (2025) Air-quality and infection-control mandates
Education & Research 13.5% CAGR (2026–2035) Campus digitization programs
Government & Public Sector 10.1% share (2024) Green-building executive orders
Others USD 4.38 billion (2025) Hospitality, retail, industrial


Corporate and co-working spaces remain the largest end-user segment within the Smart Workplace Market, as fluctuating daily occupancy in hybrid-work environments makes real-time space management indispensable. Healthcare facilities represent a high-value vertical where smart ventilation, air-quality monitoring, and access control directly impact patient outcomes and regulatory compliance — justifying premium pricing for specialized Smart Workplace Market solutions.

By Deployment Model

Segment Key Metric Primary Demand Driver
On-Premises 54.2% share (2024) Data-sovereignty and latency requirements
Cloud / SaaS 14.8% CAGR (2026–2035) Scalability and reduced IT overhead


On-premises deployments still lead the Smart Workplace Market by deployment model, particularly in industries with strict data-residency requirements such as government, defense, and healthcare. Cloud and SaaS models are closing the gap rapidly, especially among multi-site operators who value centralized management and automatic software updates over the control benefits of on-premises infrastructure.


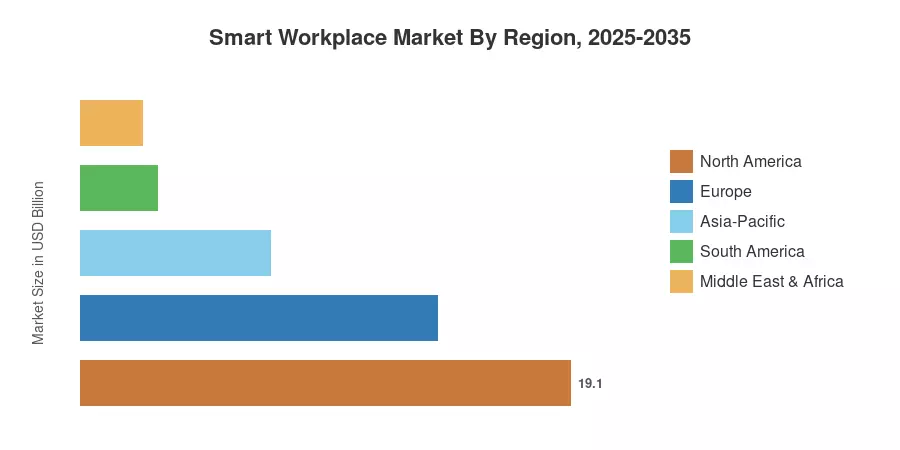
Regional Market Share Analysis

Region Key Metric Primary Investment Themes
North America 37.1% share (2024) Hybrid-work optimization, energy-code compliance
Europe USD 13.90 billion (2025) EU renovation wave, GDPR-aware deployments
Asia-Pacific 14.4% CAGR (2026–2035) Smart-city programs, new commercial construction
South America 5.8% share (2024) Co-working expansion, telecom-led IoT
Middle East & Africa USD 2.42 billion (2025) Mega-project greenfield builds, government digitization
Total USD 51.48 billion (2025)

The Smart Workplace Market exhibits a clear geographic hierarchy shaped by commercial real-estate maturity, regulatory stringency, and digital-infrastructure readiness.


North America

Country Key Metric Key Driver
United States 71.3% of regional share Local Law 97 and ENERGY STAR mandates
Canada 12.8% CAGR (2026–2035) Federal Greening Government Strategy
Mexico USD 1.18 billion (2025) Nearshoring-driven office construction


The United States remains the single largest country market within the Smart Workplace Market, propelled by a combination of stringent municipal energy laws, robust venture-capital funding for proptech start-ups, and an installed base of commercial real estate exceeding 6 billion square feet [2][6]. Canada's federal government committed CAD 2.6 billion to greening its own building portfolio through 2030, while Mexico's nearshoring boom is generating new Class A office demand in Monterrey and Guadalajara.

Europe

Country Key Metric Key Driver
Germany 23.5% of regional share Energiewende commercial retrofits
United Kingdom USD 3.21 billion (2025) MEES and net-zero targets
France 12.6% CAGR (2026–2035) Décret Tertiaire compliance
Italy 11.8% of regional share Superbonus fiscal incentives
Spain USD 1.04 billion (2025) Tourism-sector smart hospitality
Nordic Countries 13.1% CAGR (2026–2035) Near-zero-energy building standards
Russia 4.2% of regional share Limited by the sanctions environment
Rest of Europe USD 1.89 billion (2025) Varied adoption pace


Europe's Smart Workplace Market benefits from the EU Energy Performance of Buildings Directive recast, which will require all new commercial buildings to be zero-emission by 2030 and existing stock to reach minimum energy-performance class E by 2033 [11]. Germany and the UK together account for over 40% of regional spending. In comparison, France's Décret Tertiaire mandates a 40% energy reduction in commercial buildings by 2030, forcing rapid adoption of intelligent climate-management systems.

Asia-Pacific

Country Key Metric Key Driver
China 34.8% of regional share "New Infrastructure" investment initiative
India 15.2% CAGR (2026–2035) Smart Cities Mission and IT-park expansion
Japan USD 2.15 billion (2025) Aging workforce automation
South Korea 13.9% CAGR (2026–2035) Digital New Deal 2.0
ASEAN USD 1.72 billion (2025) Rapid commercial construction
Rest of Asia-Pacific 12.5% CAGR (2026–2035) Broadband expansion


Asia-Pacific's prominence in the Smart Workplace Market stems from massive new-build volumes — China alone completed over 500 million square meters of commercial floor space in 2024 — combined with government digitization mandates [13]. India's IT-corridor cities (Bengaluru, Hyderabad, Pune) represent concentrated demand pockets where multinational occupiers require smart-workplace standards equivalent to their Western headquarters.

South America

Country Key Metric Key Driver
Brazil 58.4% of regional share São Paulo office modernization
Argentina USD 0.38 billion (2025) Emerging proptech ecosystem
Rest of South America 12.0% CAGR (2026–2035) Chile and Colombia urban growth


Brazil dominates South America's Smart Workplace Market, with São Paulo's Faria Lima corridor undergoing a significant smart-retrofit cycle as multinational tenants demand integrated workplace platforms comparable to global standards. Telecom providers in the region are bundling IoT connectivity with basic workplace-sensor packages, lowering the barrier to entry for mid-market adopters.

Middle East & Africa

Country Key Metric Key Driver
Saudi Arabia 31.6% of regional share Vision 2030 mega-projects
UAE 13.8% CAGR (2026–2035) Dubai Smart City initiative
South Africa USD 0.31 billion (2025) Johannesburg commercial hubs
Egypt 12.4% CAGR (2026–2035) New Administrative Capital
Rest of MEA 18.2% of regional share Government digitization


Saudi Arabia and the UAE anchor the Middle East & Africa Smart Workplace Market, with NEOM's The Line project and Dubai's D33 agenda channeling billions into technology-first commercial environments. South Africa and Egypt represent emerging pockets where government-led capital city developments are incorporating workplace intelligence systems from inception.


Smart Workplace Market By Region, 2025-2035

Competitive Benchmarking

The Smart Workplace Market is moderately concentrated, with the top five vendors owning around 32-38% of the total market share. The Herfindahl-Hirschman Index is between 600 and 900, meaning the market is competitive but not fragmented. The big building-technology conglomerates fight with the enterprise-software giants and the specialized proptech start-ups, where platform breadth, AI capacity and open-ecosystem interoperability increasingly become the differentiators.

Company Est. Revenue Share Range Key Offerings for Smart Workplace Market Strategic Positioning
Cisco Systems ~7–10% Webex Devices, Meraki sensors, DNA Spaces Unified collaboration and IoT networking
Microsoft Corporation ~6–9% Azure Digital Twins, Teams Rooms, Viva Software-platform-centric workplace ecosystem
Siemens AG ~5–8% Building X platform, Desigo CC Building automation and digital-twin integration
Honeywell International ~5–8% Forge platform, Connected Buildings Outcome-based energy and comfort optimization
Johnson Controls International ~4–7% OpenBlue platform, Metasys AI-driven building performance management
Schneider Electric ~4–6% EcoStruxure for Buildings Energy management and sustainability analytics
ABB Ltd ~3–5% ABB Ability Smart Building Electrification and automation convergence
IBM Corporation ~3–5% TRIRIGA, Maximo Enterprise asset and facilities management
Signify (Philips Lighting) ~3–5% Interact Office, BrightSites Connected-lighting-as-a-platform
Google (Alphabet) ~2–4% Google Workspace, Nest for Enterprise Cloud-native collaboration and smart devices


Recent News & Developments

  • Honeywell International (December 2020): Acquired Sine Group, a visitor-management and access-control provider, to strengthen its Forge smart-building ecosystem [23].
  • IBM (June 2025): IBM launched a governance and security suite for agentic AI combining watsonx.governance and Guardium AI Security.

Smart Workplace Market Report Scope

Parameter Details
Market Scope Global Smart Workplace Market — hardware, software, and services for intelligent commercial work environments
Study Period 2021–2035
CAGR 12.1% (2026–2035)
Base Year Size USD 51.48 billion (2025)
Forecast Endpoint USD 161.28 billion (2035)
Fastest Growing Segment Cloud / SaaS solutions (14.8% CAGR); Small and Medium Offices (15.0% CAGR)
Companies Profiled Cisco, Microsoft, Siemens, Honeywell, Johnson Controls, Schneider Electric, ABB, IBM, Signify, Google
Valuation Currency USD billion


FAQs

What is the typical payback period for a Smart Workplace Market investment in a mid-size office?
Most mid-size office deployments achieve payback within 2.5 to 3.5 years through combined energy savings and reduced real-estate overhead. ROI accelerates when organizations bundle lighting, HVAC, and space-management upgrades into a single project [3].
How does the Smart Workplace Market address tenant data-privacy requirements across jurisdictions?
Leading vendors now offer configurable data-residency controls and anonymized analytics that comply with GDPR, CCPA, and emerging Asian privacy frameworks. Edge-processing architectures keep raw sensor data on-premises while transmitting only aggregated insights to the cloud [14].
Which protocol standards should procurement teams prioritize when evaluating Smart Workplace Market solutions?
Buyers should look for Matter, BACnet/IP, and MQTT support to ensure cross-vendor interoperability. Open-API documentation and published integration partner lists signal a vendor's commitment to ecosystem flexibility [16].
How are cyber-insurance incentives shaping Smart Workplace Market procurement decisions?
Carriers now offer premium discounts of 5–12% for buildings with certified IoT security stacks. This creates a measurable financial return that procurement teams can factor into total-cost-of-ownership models [12].
What role does 5G play in accelerating Smart Workplace Market adoption?
Private 5G networks enable ultra-low-latency sensor communication in large campuses where Wi-Fi coverage is inconsistent. Early adopters in manufacturing and healthcare verticals report 40% faster sensor-data throughput compared to legacy wireless [9].
How should organizations approach change management when deploying Smart Workplace Market solutions?
Successful implementations pair technology deployment with structured employee onboarding, including transparent communication about what data is collected and how it is used. Pilot programs on a single floor or building before portfolio-wide rollout reduce resistance [4].
What differentiates cloud-native Smart Workplace Market platforms from retrofitted on-premises systems?
Cloud-native platforms offer automatic updates, elastic scaling, and unified multi-site dashboards without local server infrastructure. On-premises systems provide lower latency and greater data control but require dedicated IT staff for maintenance [16].    
Author
Author
Author Profile
Ankit Gupta LinkedIn
Team Lead - Research
Ankit Gupta is a seasoned market intelligence and strategic research professional with over six plus years of experience in the ICT and Semiconductor industries. With academic roots in Telecom, Marketing, and Electronics, he blends technical insight with business strategy. Ankit has led 200+ projects, including work for Fortune 500 clients like Microsoft and Rio Tinto, covering market sizing, tech forecasting, and go-to-market strategies. Known for bridging engineering and enterprise decision-making, his insights support growth, innovation, and investment planning across diverse technology markets.

Research Approach


Secondary Research

The secondary research process involved comprehensive analysis of government technology databases, peer-reviewed engineering journals, commercial real estate publications, and authoritative ICT industry organizations. Key sources included the U.S. Department of Labor Occupational Safety and Health Administration (OSHA), National Institute of Standards and Technology (NIST), European Committee for Standardization (CEN/CENELEC), International Electrotechnical Commission (IEC), International Facility Management Association (IFMA), Building Owners and Managers Association (BOMA) International, U.S. Energy Information Administration (EIA), International Energy Agency (IEA), IEEE Communications Society, GSMA Intelligence, U.S. Bureau of Labor Statistics (BLS), Organisation for Economic Co-operation and Development (OECD) Digital Economy Outlook, European Union Eurostat ICT Database, China Ministry of Industry and Information Technology (MIIT), India Ministry of Electronics and Information Technology (MeitY), and national smart city initiatives from key markets. These sources were used to collect IoT deployment statistics, energy efficiency standards, building automation regulations, enterprise software adoption trends, and market landscape analysis for smart lighting systems, security systems, energy management systems (EMS), HVAC control systems, and underlying software and services platforms.


Primary Research

Qualitative and quantitative insights were obtained by interviewing supply-side and demand-side stakeholders during the primary research process. Supply-side sources comprised CEOs, CTOs, VPs of IoT Solutions, directors of Smart Building Divisions, and Chief Sustainability Officers from integrated workplace management system (IWMS) providers, building automation OEMs, and enterprise software vendors. The demand-side sources included procurement leads from Fortune 500 enterprises, commercial property developers, co-working space operators, and smart building integrators, as well as Chief Facility Officers (CFOs), Corporate Real Estate Directors, VP of Workplace Experience, and Chief Information Officers (CIOs). Primary research verified market segmentation across software and services components, verified product deployment timelines for smart lighting and security systems, and collected insights on enterprise adoption patterns, SaaS pricing strategies, and energy efficiency ROI metrics.


Primary Respondent Breakdown

By Designation: C-level Executives (42%), Director Level (25%), Others (33%)

By Region: North America (32%), Europe (30%), Asia-Pacific (28%), Rest of World (10%)


Market Size Estimation

Global market valuation was derived through revenue mapping and deployment volume analysis. The methodology included:

Identification of 60+ key technology providers across North America, Europe, Asia-Pacific, and Latin America, encompassing software platforms (IWMS, CAFM, space management), IoT hardware manufacturers, and systems integrators

Product mapping across software suites (cloud-based workplace management platforms, analytics software, mobile applications), services (consulting, integration, managed services), and hardware products (smart lighting controls, IoT sensors, access control systems, energy management hardware, HVAC automation controllers)

Communication technology segmentation across wired (Ethernet, PoE, BACnet, Modbus) and wireless (Wi-Fi 6, Zigbee, Z-Wave, LoRaWAN, 5G private networks) protocols

Analysis of reported and modeled annual revenues specific to smart workplace solution portfolios and recurring service revenues

Coverage of technology providers representing 75-80% of global market share in 2024

Extrapolation using bottom-up approach (enterprise deployment volumes × average selling price by country/industry) and top-down approach (vendor revenue validation and IT/OT spending allocation) to derive segment-specific valuations for smart lighting, security systems, EMS, and HVAC control systems across software and service categories

Download Free Sample

Kindly complete the form below to receive a free sample of this Report

Download PDF ×

We do not share your information with anyone. However, we may send you emails based on your report interest from time to time. You may contact us at any time to opt-out.
















