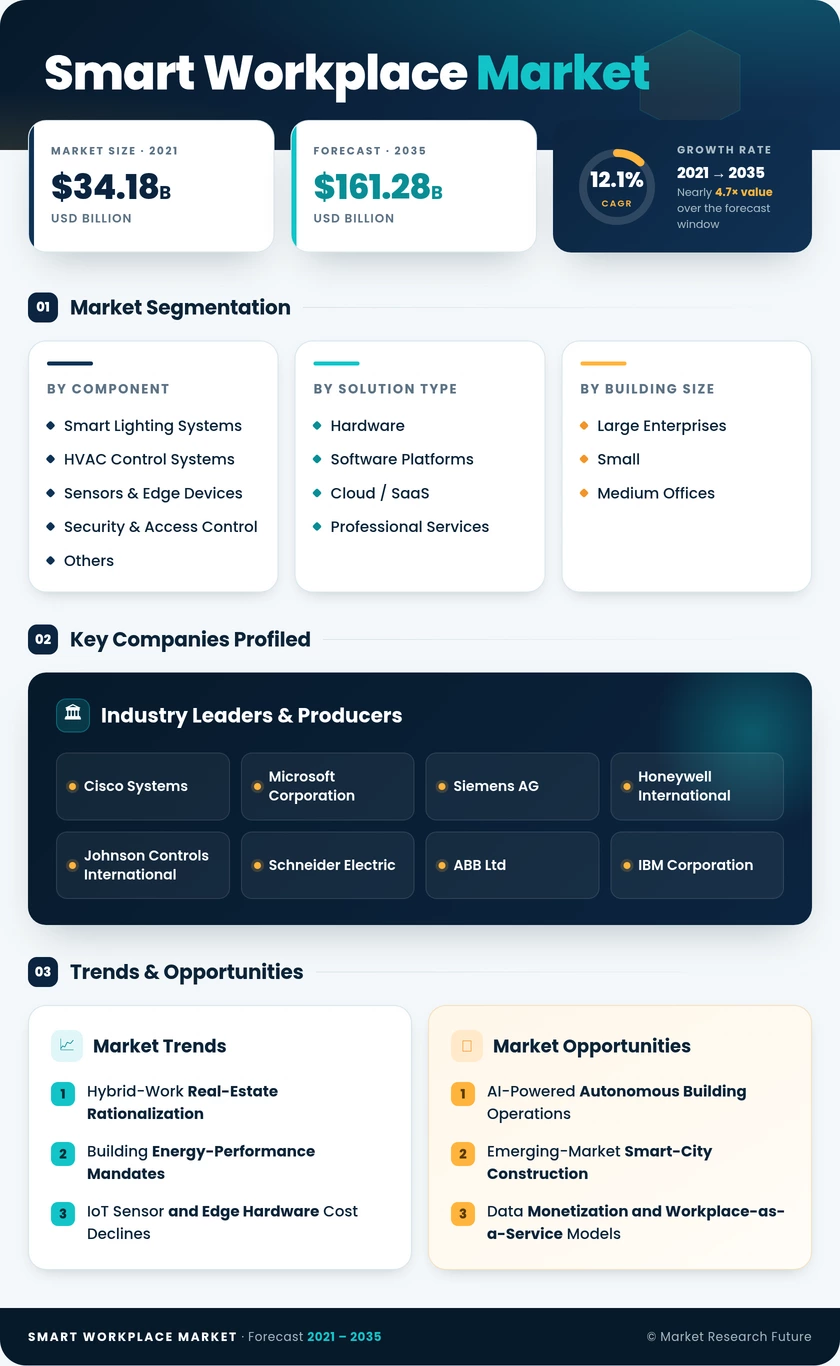
Smart Workplace Market (2026 - 2035)

ID: MRFR/SEM/3052-HCR
100 Pages
Ankit Gupta
Last Updated: July 06, 2026
Smart Workplace Market Size, Share and Research Report By Component (Software and Services), By Product (Smart Lighting, Security Systems, Energy Management Systems and HVAC Control Systems), By Communication Technology (Wired and Wireless) And By Region (North America, Europe, Asia-Pacific, And Rest Of The World) –Industry Forecast Till 2035
Smart Workplace Market
Market Size
Forecast Period2026-2035
CAGR (2026-2035)12.1%
2025 Market SizeUSD 51.48 billion
2035 Market SizeUSD 161.28 billion
Key Players
Cisco Systems
Microsoft Corporation
Siemens AG
Honeywell International
Johnson Controls International
Schneider Electric
Opportunities
  • AI-Powered Autonomous Building Operations
  • Emerging-Market Smart-City Construction
  • Data Monetization and Workplace-as-a-Service Models
  1. 1 Market Overview |
    1. 1.1 Study Assumptions & Market Definition |
    2. 1.2 Scope of the Study |
    3. 1.3 Research Methodology
  2. 2 Market Summary & Key Takeaways
  3. 3 Market Dynamics |
    1. 3.1 Market Drivers Analysis | |
      1. 3.1.1 Hybrid-Work Real-Estate Rationalization | |
      2. 3.1.2 Building Energy-Performance Mandates | |
      3. 3.1.3 IoT Sensor and Edge Hardware Cost Declines | |
      4. 3.1.4 AI-Driven Occupancy and Climate Optimization | |
      5. 3.1.5 ESG Reporting and Green-Building Certification | |
      6. 3.1.6 Cybersecurity and Smart-Building Insurance Incentives | |
      7. 3.1.7 Government Smart-City Stimulus Programs |
    2. 3.2 Market Restraints Analysis | |
      1. 3.2.1 Employee Data-Privacy and Surveillance Concerns | |
      2. 3.2.2 Legacy Building-Infrastructure Incompatibility | |
      3. 3.2.3 Fragmented Vendor Ecosystems and Interoperability Gaps | |
      4. 3.2.4 Cybersecurity Vulnerabilities in IoT Endpoints | |
      5. 3.2.5 High Upfront Retrofit Costs for Older Stock |
    3. 3.3 Market Opportunity Analysis | |
      1. 3.3.1 AI-Powered Autonomous Building Operations | |
      2. 3.3.2 Emerging-Market Smart-City Construction | |
      3. 3.3.3 Data Monetization and Workplace-as-a-Service Models | |
      4. 3.3.4 Co-Working and Flex-Space Digitization | |
      5. 3.3.5 Cybersecurity and Smart-Building Insurance |
    4. 3.4 Industry Value Chain Analysis |
    5. 3.5 Porter's Five Forces Analysis
  4. 4 Global Smart Workplace Market Size & Forecast (2021–2035) |
    1. 4.1 Historical Market Size (2021–2025) |
    2. 4.2 Current & Forecast Market Size (2026–2035) |
    3. 4.3 Market Size by Revenue (USD billion) |
    4. 4.4 Year-over-Year Growth Analysis
  5. 5 Segmentation Analysis |
    1. 5.1 By Component | |
      1. 5.1.1 Smart Lighting Systems | |
      2. 5.1.2 HVAC Control Systems | |
      3. 5.1.3 Sensors & Edge Devices | |
      4. 5.1.4 Security & Access Control | |
      5. 5.1.5 Others |
    2. 5.2 By Solution Type | |
      1. 5.2.1 Hardware | |
      2. 5.2.2 Software Platforms | |
      3. 5.2.3 Cloud / SaaS | |
      4. 5.2.4 Professional Services |
    3. 5.3 By Building Size | |
      1. 5.3.1 Large Enterprises | |
      2. 5.3.2 Small and Medium Offices |
    4. 5.4 By End-User Industry | |
      1. 5.4.1 Corporate & Co-Working Spaces | |
      2. 5.4.2 Healthcare Facilities | |
      3. 5.4.3 Education & Research | |
      4. 5.4.4 Government & Public Sector | |
      5. 5.4.5 Others |
    5. 5.5 By Deployment Model | |
      1. 5.5.1 On-Premises | |
      2. 5.5.2 Cloud / SaaS
  6. 6 Regional Analysis |
    1. 6.1 North America | |
      1. 6.1.1 United States | |
      2. 6.1.2 Canada | |
      3. 6.1.3 Mexico |
    2. 6.2 Europe | |
      1. 6.2.1 Germany | |
      2. 6.2.2 United Kingdom | |
      3. 6.2.3 France | |
      4. 6.2.4 Italy | |
      5. 6.2.5 Spain | |
      6. 6.2.6 Nordic Countries | |
      7. 6.2.7 Russia | |
      8. 6.2.8 Rest of Europe |
    3. 6.3 Asia-Pacific | |
      1. 6.3.1 China | |
      2. 6.3.2 India | |
      3. 6.3.3 Japan | |
      4. 6.3.4 South Korea | |
      5. 6.3.5 ASEAN | |
      6. 6.3.6 Rest of Asia-Pacific |
    4. 6.4 South America | |
      1. 6.4.1 Brazil | |
      2. 6.4.2 Argentina | |
      3. 6.4.3 Rest of South America |
    5. 6.5 Middle East & Africa | |
      1. 6.5.1 Saudi Arabia | |
      2. 6.5.2 UAE | |
      3. 6.5.3 South Africa | |
      4. 6.5.4 Egypt | |
      5. 6.5.5 Rest of MEA
  7. 7 Competitive Landscape |
    1. 7.1 Market Share Analysis (2024) |
    2. 7.2 Competitive Benchmarking Matrix |
    3. 7.3 Company Profiles | |
      1. 7.3.1 Cisco Systems | |
      2. 7.3.2 Microsoft Corporation | |
      3. 7.3.3 Siemens AG | |
      4. 7.3.4 Honeywell International | |
      5. 7.3.5 Johnson Controls International | |
      6. 7.3.6 Schneider Electric | |
      7. 7.3.7 ABB Ltd | |
      8. 7.3.8 IBM Corporation | |
      9. 7.3.9 Signify (Philips Lighting) | |
      10. 7.3.10 Google (Alphabet)
  8. 8 Future Outlook & Strategic Recommendations (2026–2035) |
    1. 8.1 AI-Autonomous and Self-Healing Buildings |
    2. 8.2 Platform Consolidation and Ecosystem Economics |
    3. 8.3 ESG Compliance as a Revenue-Grade Data Layer |
    4. 8.4 Generative AI and the Adaptive Workplace
  9. 9 Recent Developments & News
  10. 10 Frequently Asked Questions (FAQs)
  11. 11 Report Scope & Methodology |
    1. 11.1 Study Period & Base Year |
    2. 11.2 Data Sources & Citations |
    3. 11.3 Abbreviations
  12. 12 LIST OF TABLES |
  13. TABLE 1 Global Smart Workplace Market Size & Forecast, by Revenue (USD billion), 2021–2035 |
  14. TABLE 2 Global Smart Workplace Market – Year-over-Year Growth Analysis, 2021–2035 |
  15. TABLE 3 Global Smart Workplace Market – Driver Impact Analysis, 2026–2035 |
  16. TABLE 4 Global Smart Workplace Market – Restraint Impact Analysis, 2026–2035 |
  17. TABLE 5 Global Smart Workplace Market Size, by Component, 2021–2035 (USD billion) |
  18. TABLE 6 Global Smart Workplace Market Size, by Solution Type, 2021–2035 (USD billion) |
  19. TABLE 7 Global Smart Workplace Market Size, by Building Size, 2021–2035 (USD billion) |
  20. TABLE 8 Global Smart Workplace Market Size, by End-User Industry, 2021–2035 (USD billion) |
  21. TABLE 9 Global Smart Workplace Market Size, by Deployment Model, 2021–2035 (USD billion) |
  22. TABLE 10 Global Smart Workplace Market Size, by Region, 2021–2035 (USD billion) |
  23. TABLE 11 North America Smart Workplace Market Size, by Country, 2021–2035 (USD billion) |
  24. TABLE 12 Europe Smart Workplace Market Size, by Country, 2021–2035 (USD billion) |
  25. TABLE 13 Asia-Pacific Smart Workplace Market Size, by Country, 2021–2035 (USD billion) |
  26. TABLE 14 South America Smart Workplace Market Size, by Country, 2021–2035 (USD billion) |
  27. TABLE 15 Middle East & Africa Smart Workplace Market Size, by Country, 2021–2035 (USD billion) |
  28. TABLE 16 Competitive Benchmarking Matrix – Global Smart Workplace Market, 2024 |
  29. TABLE 17 Company Profiles – Key Players, Global Smart Workplace Market |
  30. TABLE 18 Recent Developments & Strategic Announcements, 2023–2025 |
  31. TABLE 19 Report Scope & Methodology Summary |
  32. TABLE 20 Detailed Sources and Citations |
  33. TABLE 21 North America Smart Workplace Market Size, by Component, 2021–2035 (USD billion) |
  34. TABLE 22 North America Smart Workplace Market Size, by Solution Type, 2021–2035 (USD billion) |
  35. TABLE 23 North America Smart Workplace Market Size, by Building Size, 2021–2035 (USD billion) |
  36. TABLE 24 North America Smart Workplace Market Size, by End-User Industry, 2021–2035 (USD billion) |
  37. TABLE 25 North America Smart Workplace Market Size, by Deployment Model, 2021–2035 (USD billion) |
  38. TABLE 26 Europe Smart Workplace Market Size, by Component, 2021–2035 (USD billion) |
  39. TABLE 27 Europe Smart Workplace Market Size, by Solution Type, 2021–2035 (USD billion) |
  40. TABLE 28 Europe Smart Workplace Market Size, by Building Size, 2021–2035 (USD billion) |
  41. TABLE 29 Europe Smart Workplace Market Size, by End-User Industry, 2021–2035 (USD billion) |
  42. TABLE 30 Europe Smart Workplace Market Size, by Deployment Model, 2021–2035 (USD billion) |
  43. TABLE 31 Asia-Pacific Smart Workplace Market Size, by Component, 2021–2035 (USD billion) |
  44. TABLE 32 Asia-Pacific Smart Workplace Market Size, by Solution Type, 2021–2035 (USD billion) |
  45. TABLE 33 Asia-Pacific Smart Workplace Market Size, by Building Size, 2021–2035 (USD billion) |
  46. TABLE 34 Asia-Pacific Smart Workplace Market Size, by End-User Industry, 2021–2035 (USD billion) |
  47. TABLE 35 Asia-Pacific Smart Workplace Market Size, by Deployment Model, 2021–2035 (USD billion) |
  48. TABLE 36 South America Smart Workplace Market Size, by Component, 2021–2035 (USD billion) |
  49. TABLE 37 South America Smart Workplace Market Size, by Solution Type, 2021–2035 (USD billion) |
  50. TABLE 38 South America Smart Workplace Market Size, by Building Size, 2021–2035 (USD billion) |
  51. TABLE 39 South America Smart Workplace Market Size, by End-User Industry, 2021–2035 (USD billion) |
  52. TABLE 40 South America Smart Workplace Market Size, by Deployment Model, 2021–2035 (USD billion) |
  53. TABLE 41 Middle East & Africa Smart Workplace Market Size, by Component, 2021–2035 (USD billion) |
  54. TABLE 42 Middle East & Africa Smart Workplace Market Size, by Solution Type, 2021–2035 (USD billion) |
  55. TABLE 43 Middle East & Africa Smart Workplace Market Size, by Building Size, 2021–2035 (USD billion) |
  56. TABLE 44 Middle East & Africa Smart Workplace Market Size, by End-User Industry, 2021–2035 (USD billion) |
  57. TABLE 45 Middle East & Africa Smart Workplace Market Size, by Deployment Model, 2021–2035 (USD billion)
  58. 13 LIST OF FIGURES |
  59. FIGURE 1 Global Smart Workplace Market Dynamics — Drivers, Restraints, and Opportunities |
  60. FIGURE 2 Industry Value Chain Analysis — Smart Workplace Market |
  61. FIGURE 3 Porter's Five Forces Analysis — Smart Workplace Market |
  62. FIGURE 4 Global Smart Workplace Market Size Trend (USD billion), 2021–2035 |
  63. FIGURE 5 Smart Workplace Market Share, by Component, 2024 |
  64. FIGURE 6 Smart Workplace Market Share, by Solution Type, 2024 |
  65. FIGURE 7 Smart Workplace Market Share, by Building Size, 2024 |
  66. FIGURE 8 Smart Workplace Market Share, by End-User Industry, 2024 |
  67. FIGURE 9 Smart Workplace Market Share, by Deployment Model, 2024 |
  68. FIGURE 10 Smart Workplace Market Share, by Region, 2024 |
  69. FIGURE 11 North America Smart Workplace Market Size (USD billion), 2021–2035 |
  70. FIGURE 12 Europe Smart Workplace Market Size (USD billion), 2021–2035 |
  71. FIGURE 13 Asia-Pacific Smart Workplace Market Size (USD billion), 2021–2035 |
  72. FIGURE 14 South America Smart Workplace Market Size (USD billion), 2021–2035 |
  73. FIGURE 15 Middle East & Africa Smart Workplace Market Size (USD billion), 2021–2035 |
  74. FIGURE 16 Competitive Landscape — Market Share Analysis, 2024

SEGMENTATION QUICK REFERENCE

DimensionSub-SegmentsDominant SegmentFastest Growing Segment
By ComponentSmart Lighting Systems, HVAC Control Systems, Sensors & Edge Devices, Security & Access Control, OthersSmart Lighting SystemsSensors & Edge Devices
By Solution TypeHardware, Software Platforms, Cloud / SaaS, Smart Workplace MarketHardwareCloud / SaaS
By Building SizeLarge Enterprises, Small and Medium OfficesLarge EnterprisesSmall and Medium Offices
By End-User IndustryCorporate & Co-Working Spaces, Healthcare Facilities, Education & Research, Government & Public Sector, OthersCorporate & Co-Working SpacesEducation & Research
By Deployment ModelOn-Premises, Cloud / SaaSOn-PremisesCloud / SaaS


MARKET SEGMENTATION OVERVIEW

By Component

Sub-SegmentKey Trend
Smart Lighting SystemsHuman-centric tunable-white luminaires with embedded occupancy sensors
HVAC Control SystemsAI-driven predictive climate conditioning linked to occupancy forecasts
Sensors & Edge DevicesMillimeter-wave radar and BLE beacons enabling desk-level spatial analytics
Security & Access ControlTouchless biometric and mobile-credential entry systems
OthersDigital signage, wayfinding kiosks, and integrated AV collaboration tools


Smart lighting systems remain the most widely adopted entry point due to rapid payback and dual-purpose functionality — simultaneously reducing energy costs and improving occupant comfort through circadian-aligned illumination profiles.

By Solution Type

Sub-SegmentKey Trend
HardwareConnected luminaires, gateways, actuators, and environmental sensors
Software PlatformsIntegrated workplace-experience management and building-performance dashboards
Cloud / SaaSMulti-site analytics platforms with automatic updates and elastic scaling
Smart Workplace MarketSystem integration, commissioning, and ongoing managed services


Hardware spending continues to anchor initial deployments, while the recurring-revenue shift toward cloud-based management platforms is transforming vendor business models and creating stickier customer relationships.

By Building Size

Sub-SegmentKey Trend
Large EnterprisesPortfolio-wide standardization across global campuses and corporate HQs
Small and Medium OfficesTurnkey sensor kits and subscription-priced analytics are lowering adoption barriers.


Large enterprises set the technology benchmark, but small and medium offices represent the untapped growth frontier as plug-and-play solutions and falling sensor costs eliminate traditional budget constraints.

By End-User Industry

Sub-SegmentKey Trend
Corporate & Co-Working SpacesReal-time desk and meeting-room utilization management for hybrid workforces
Healthcare FacilitiesAir-quality monitoring and infection-control automation
Education & ResearchCampus-wide energy management and smart-classroom environments
Government & Public SectorGreen-building mandates and executive-order-driven modernization
OthersHospitality personalization, retail environment optimization and industrial workplace safety


Corporate and co-working spaces drive the plurality of demand, but healthcare and education verticals are accelerating as regulatory and institutional mandates create non-discretionary purchasing triggers.

By Deployment Model

Sub-SegmentKey Trend
On-PremisesPreferred where data-residency regulations or ultra-low latency requirements apply
Cloud / SaaSRapid adoption among multi-site operators seeking centralized management and lower IT burden


On-premises deployments remain prevalent in regulated industries, while cloud-native architectures are gaining ground as the default choice for organizations prioritizing scalability and operational simplicity.


Download PDF ×

We do not share your information with anyone. However, we may send you emails based on your report interest from time to time. You may contact us at any time to opt-out.