Segmentation Quick Reference
| Dimension | Sub-Segments | Dominant Segment | Fastest Growing Segment |
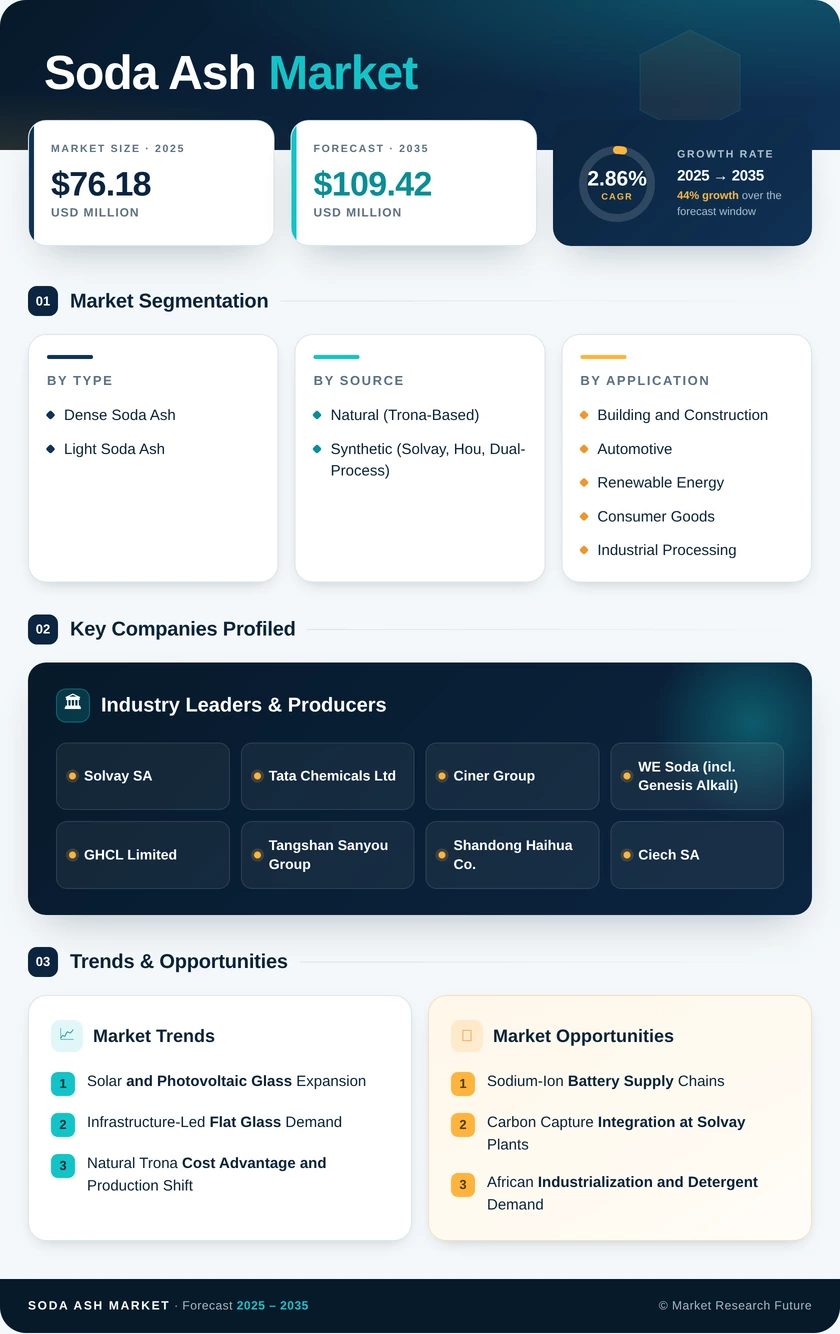
| By Type | Dense Soda Ash, Light Soda Ash | Dense Soda Ash | Light Soda Ash |
| By Source | Natural (Trona-Based), Synthetic (Solvay, Hou, Dual-Process) | Synthetic | Natural (Trona-Based) |
| By Application | Glass Manufacturing, Detergents and Soaps, Water Treatment, Chemicals and Metallurgy, Others | Glass Manufacturing | Water Treatment |
| By End-User Industry | Building and Construction, Automotive, Soda Ash Market, Consumer Goods, Industrial Processing | Building and Construction | Soda Ash Market |
| By Geography | Asia-Pacific, North America, Europe, South America, the Middle East & Africa | Asia-Pacific | Middle East & Africa |
Market Segmentation Overview
By Type
| Sub-Segment | Key Trend |
| Dense Soda Ash | Tightening supply as photovoltaic and automotive glass demand accelerates globally |
| Light Soda Ash | Growth led by powdered detergent formulations in South Asia and Sub-Saharan Africa |
Dense soda ash continues to dominate global volume due to its critical function as a glass-batch flux, while light soda ash benefits from structural demand growth in detergent and water treatment applications across emerging economies.
By Source
| Sub-Segment | Key Trend |
| Natural (Trona-Based) | Capacity expansion in Wyoming and Türkiye is displacing higher-cost synthetic output |
| Synthetic (Solvay, Hou, Dual-Process) | Carbon penalties and energy costs are driving rationalization in Europe and China |
The ongoing production shift from synthetic to natural extraction is the defining structural trend in global soda ash supply, reshaping trade flows and competitive positioning across the industry.
By Application
| Sub-Segment | Key Trend |
| Glass Manufacturing | Solar glass and architectural glazing are driving incremental volume demand |
| Detergents and Soaps | Stable volumes anchored by emerging market household consumption growth |
| Water Treatment | Fastest-growing application, propelled by tightening municipal effluent standards |
| Chemicals and Metallurgy | Sodium bicarbonate and lithium carbonate precipitation expanding downstream use |
| Others | Flue gas desulfurization and pulp processing provide a niche but steady demand |
Glass manufacturing remains the overwhelmingly dominant application, but water treatment and energy storage represent the highest-growth incremental channels through 2035.
By End-User Industry
| Sub-Segment | Key Trend |
| Building and Construction | Infrastructure megaprojects in the Asia-Pacific and MEA are sustaining flat glass demand |
| Automotive | EV panoramic roofs and lightweighting trends are increasing the glass content per vehicle |
| Soda Ash Market | Solar panel and sodium-ion battery production are creating new demand channels |
| Consumer Goods | Detergent and personal care sectors are maintaining baseline consumption |
| Industrial Processing | Chemical intermediates and metallurgical applications provide a diversified demand |
Building and construction remains the largest end-user category, while renewable energy applications represent the most dynamic growth vector through the forecast period.