Segmentation Quick Reference
| Dimension | Sub-Segments | Dominant Segment | Fastest Growing Segment |
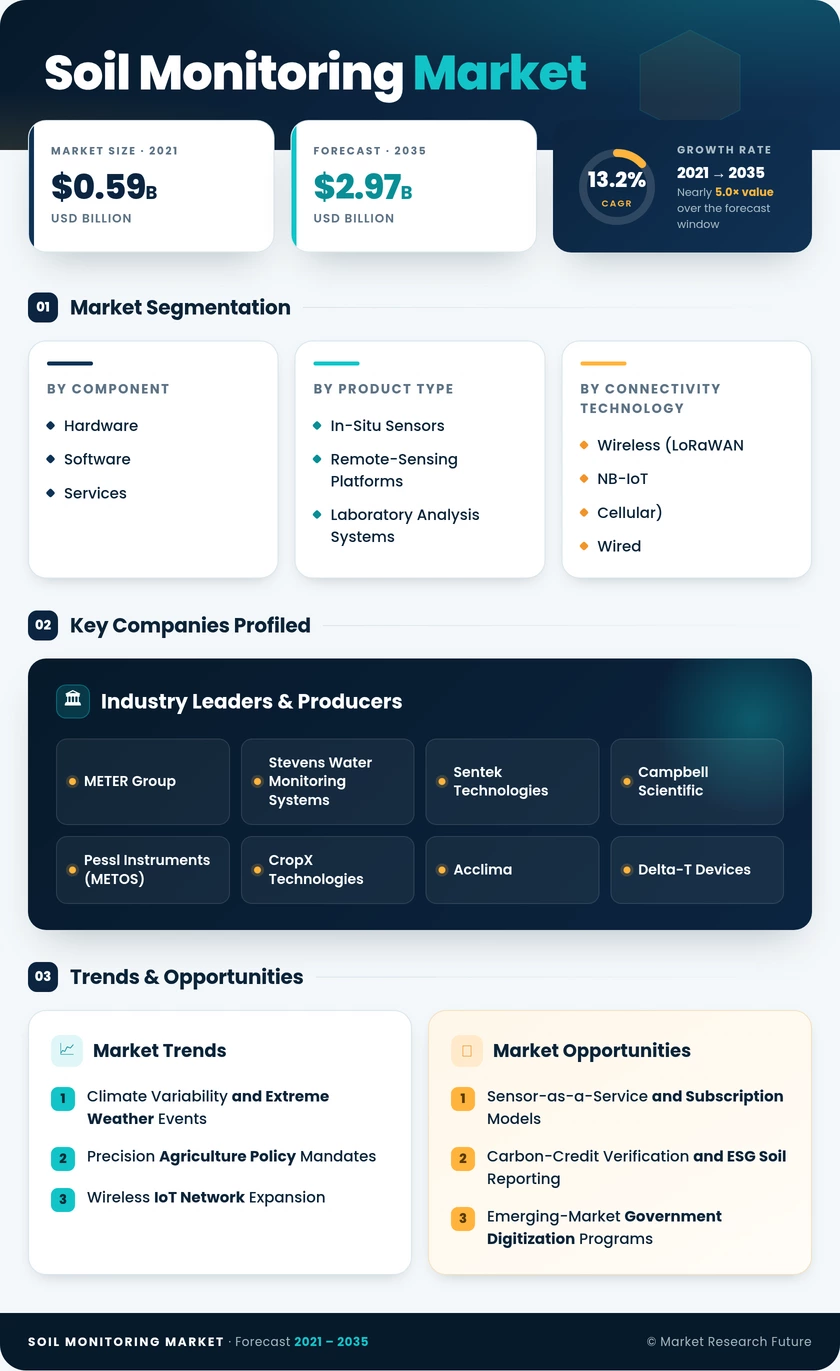
| Component | Hardware, Software, Services | Hardware | Services |
| Product Type | In-Situ Sensors, Remote-Sensing Platforms, Laboratory Analysis Systems | In-Situ Sensors | Remote-Sensing Platforms |
| Connectivity Soil Monitoring Market | Wireless (LoRaWAN, NB-IoT, Cellular), Wired | Wireless | Wireless |
| Application | Open Field, Protected Cultivation | Open Field | Protected Cultivation |
| End User | Large Commercial Farms, Smallholder Cooperatives, Research Institutes, Government Agencies | Large Commercial Farms | Research Institutes |
| Geography | North America, Europe, Asia-Pacific, South America, Middle East & Africa | North America | Asia-Pacific |
Market Segmentation Overview
By Component
| Sub-Segment | Key Trend |
| Hardware | Ongoing sensor miniaturization and multi-parameter probe integration |
| Software | Cloud-native SaaS analytics platforms are replacing legacy desktop applications. |
| Services | Managed calibration, advisory, and data-interpretation subscriptions |
Hardware remains the revenue anchor as growers invest in next-generation agricultural soil sensors with integrated wireless telemetry. Services are growing fastest as precision farming analytics vendors transition to recurring-revenue subscription models.
By Product Type
| Sub-Segment | Key Trend |
| In-Situ Sensors | Multi-depth capacitance and TDR probes are gaining commercial traction |
| Remote-Sensing Platforms | Satellite and drone-based multispectral crop land data monitoring |
| Laboratory Analysis Systems | Automated wet-chemistry and spectroscopy instruments |
In-situ sensors dominate because they deliver continuous subsurface readings that satellite platforms cannot replicate. Remote-sensing platforms are closing the gap as spatial resolution improves and revisit times shrink.
By Connectivity Soil Monitoring Market
| Sub-Segment | Key Trend |
| Wireless (LoRaWAN, NB-IoT, Cellular) | Rural LPWAN infrastructure buildout reduces per-hectare connectivity costs. |
| Wired | Persistent niche in greenhouse and controlled-environment deployments |
Wireless solutions command the connectivity landscape, with smart irrigation sensors and soil probes leveraging low-power networks for multi-year battery life in remote deployments.
By Application
| Sub-Segment | Key Trend |
| Open Field | Large-acre row-crop deployments in cereals, oilseeds, and cotton |
| Protected Cultivation | Greenhouse and vertical-farm substrate-level fertigation management |
Open-field applications account for the majority of deployments, while protected cultivation is the faster-growing segment as soil health monitoring tools become essential for high-value greenhouse operations.
By End User
| Sub-Segment | Key Trend |
| Large Commercial Farms | Systematic procurement integrated with farm-management platforms |
| Smallholder Cooperatives | Government-subsidized cooperative purchasing programs |
| Research Institutes | Grant-funded multi-year soil-science instrumentation projects |
| Government Agencies | Environmental monitoring and land-use compliance mandates |
Large commercial farms drive volume through standardized procurement cycles, while research institutes post the highest growth rate as climate-science and carbon-sequestration funding expands globally.