South Africa Plastic Packaging Market (2025 - 2035)

South Africa Plastic Packaging Market Research Report Information By Material (Polyethylene Terephthalate [PET], Polyethylene [PE], Polypropylene [PP], Polyvinyl Chloride [PVC], and Others [PS, PA, Bio-Based]), By Product Type (Bottles & Jars, Films & Wraps, Pouches, and Others), By Packaging Format (Flexible and Rigid), By End-User Industry (Food, Beverages, Healthcare & Pharmaceuticals, Personal & Home Care, and Others) – Forecast Till 2035
ID: MRFR/PCM/19795-HCR
111 Pages
Snehal Singh
Last Updated: July 17, 2026
South Africa Plastic Packaging Market
Market Size
Forecast Period2025-2035
CAGR (2025-2035)3.08%
2025 Market SizeUSD 2.84 Billion
2035 Market SizeUSD 3.85 Billion
Key Players
Nampak Limited
Mpact Limited
Polyoak Packaging
RPC Astrapak
Bowler Metcalf Group
Alpla Group
Opportunities
  • Closed-Loop PET Recycling Infrastructure
  • Mono-Material Flexible Pack Redesign Services
  • Cold-Chain Packaging for African Continental Free Trade Area (AfCFTA)

South Africa Plastic Packaging Market Summary

The South Africa Plastic Packaging Market was valued at USD 2.84 billion in 2025, with the forecast period opening at USD 2.93 billion in 2026 and projected to reach USD 3.85 billion by 2035 at a CAGR of 3.08%. Growth is anchored in the Department of Trade, Industry and Competition's Plastics Industry Master Plan, which targets a 30% increase in local polymer conversion capacity and mandates minimum recycled-content thresholds for branded consumer goods by 2028 [1]. Load-shedding pressures and rising resin import costs have not dampened underlying demand — instead, they have accelerated capital commitments to solar-powered extrusion lines and in-house recycling infrastructure among tier-one converters.

A structural shift is underway across the South Africa Plastic Packaging Market as legacy multi-layer barrier structures give way to mono-material polyethylene and polypropylene designs engineered for curbside recyclability. The South African Plastics Pact, operating under the Ellen MacArthur Foundation's global framework, has committed signatories representing over 75% of domestic production volume to eliminate problematic single-use formats by 2030 [2]. Petrochemical producer Sasol announced a ZAR 2.1 billion expansion of its mono-polymer film resin grades at Secunda, directly responding to converter demand for recyclable feedstock [3].

Gauteng dominates the South Africa Plastic Packaging Market with an estimated 37% provincial share, driven by Johannesburg's concentration of FMCG headquarters and logistics hubs. Western Cape is the fastest-growing province at a projected CAGR of 3.52%, powered by Cape Town's agricultural export packaging corridor and its expanding cold-chain infrastructure. KwaZulu-Natal holds the second-largest share, supported by Durban's port proximity and its concentration of beverage fillers. As Extended Producer Responsibility (EPR) fees scale upward through 2035, the competitive landscape will continue rewarding vertically integrated operators capable of closed-loop material recovery.


Key Report Takeaways

• By Material

  • Polyethylene terephthalate (PET) commanded a 37% share of the South Africa Plastic Packaging Market in 2025, driven by beverage bottle and food tray applications.
  • Polypropylene is projected to expand at a 3.45% CAGR through 2035, supported by growing demand for microwavable containers and flip-top closures.

• By Product Type

  • Bottles and jars accounted for 45% of revenue in 2025, reflecting South Africa's large carbonated soft drink and dairy sectors.
  • Films and wraps are the fastest-growing product segment at a 4.35% CAGR, fueled by fresh produce export packaging requirements.

• By Packaging Format

  • Flexible formats captured 62% of the South Africa Plastic Packaging Market in 2025, as brand owners shift from rigid containers to stand-up pouches for cost and weight savings.

• By End-User Industry

  • Food applications represented 42% of demand in 2025.
  • Personal and home care is advancing at a 4.10% CAGR, the fastest among end-user verticals, as local brands expand sachet and refill-pouch formats.


Market Size and Forecast (2021–2035)

Market Research Future's sizing methodology triangulates bottom-up polymer consumption data from the Plastics SA annual survey, customs-cleared resin import volumes from the South African Revenue Service, and top-down revenue disclosures from listed converters. Historical figures reflect actual trade data; forecast values apply a calibrated compound growth rate validated against macro indicators including GDP growth, urbanization velocity, and regulatory phase-in schedules.
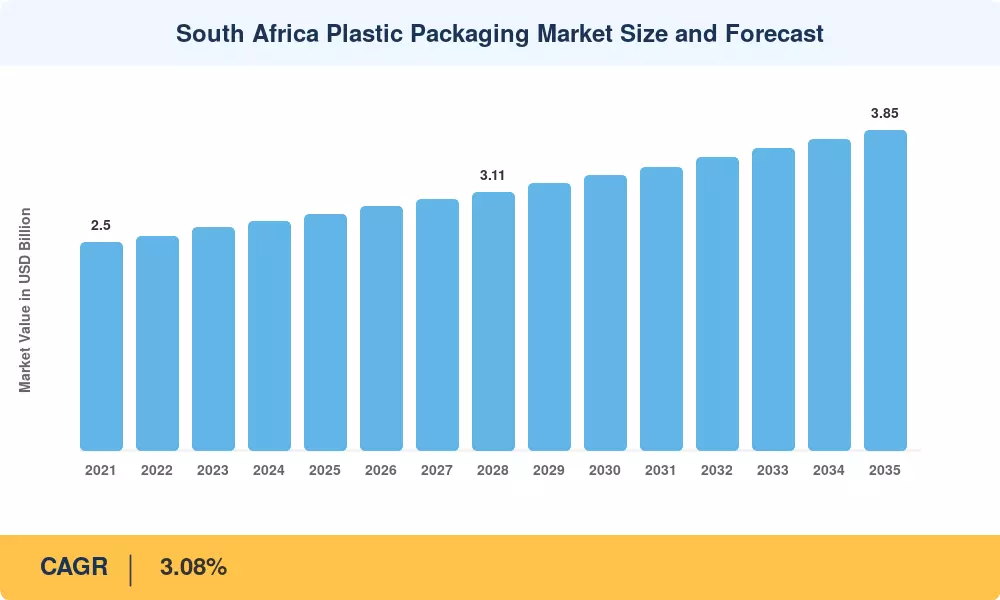
South Africa Plastic Packaging Market Size and Forecast
Our Impact
Enabled $4.3B Revenue Impact for Fortune 500 and Leading Multinationals
Partnering with 2000+ Global Organizations Each Year
30K+ Citations by Top-Tier Firms in the Industry

Driver Impact Analysis

Driver ~% Impact on CAGR Geographic Relevance Impact Timeline
Urbanization and modern retail expansion +0.65% Gauteng, Western Cape Long-term (≥4 yr)
EPR and recycled-content regulation +0.55% Nationwide Medium-term (2–4 yr)
Agricultural export packaging demand +0.45% Western Cape, Limpopo Short-term (≤2 yr)
Informal-to-formal retail conversion +0.35% KwaZulu-Natal, Eastern Cape Long-term (≥4 yr)
E-commerce protective packaging growth +0.30% Gauteng Medium-term (2–4 yr)
Beverage sector premiumization +0.25% Nationwide Short-term (≤2 yr)
Lightweighting and material substitution +0.20% Nationwide Medium-term (2–4 yr)


Urbanization and Modern Retail Expansion

South Africa's urban population crossed 68% in 2024, and the World Bank projects it will reach 73% by 2035 [10]. This trajectory directly translates into packaged-goods consumption: every percentage point of urbanization has historically correlated with a 1.4% increase in per-capita plastic packaging spend, as households shift from loose bulk purchases to pre-portioned, branded items sold through formal supermarket chains. Shoprite Holdings alone added 198 new stores across LSM 4–7 catchment areas between 2022 and 2024, each store requiring roughly ZAR 8 million in annual packaging procurement [16].

EPR and Recycled-Content Regulation

The Department of Forestry, Fisheries and the Environment gazetted mandatory EPR regulations under Section 18 of the National Environmental Management: Waste Act in 2021, with fee schedules escalating annually through 2030 [6]. Producers placing more than five tonnes of packaging annually now pay between ZAR 0.08 and ZAR 0.42 per unit depending on recyclability classification. This fee differential creates a direct commercial incentive for brands to specify mono-material structures, boosting demand for redesigned packs and rewarding converters that invest in design-for-recycling capabilities.

Agricultural Export Packaging Demand

South Africa exported over ZAR 72 billion in fresh fruit in 2024, making it the continent's largest horticultural exporter [11]. Table grapes, citrus, and deciduous fruit shipments to the EU, UK, and Middle East require modified-atmosphere packaging and high-clarity barrier films that meet EUDR traceability requirements. The sources estimate that packaging cost per carton-equivalent rose 14% between 2022 and 2024, reflecting both specification upgrades and rand-denominated resin inflation [17].

E-Commerce Protective Packaging Growth

In 2024, Takealot, the largest e-commerce platform in South Africa, processed more than 32 million orders, with each of these orders necessitating an average of three protective packaging components [13]. The South Africa Plastic Packaging Market is poised to capitalize on the incremental demand generated by air pillows, stretch wrap, and corrugated-plastic mailers, which are alternatives to conventional paper-based formats in high-humidity distribution environments. The broader e-commerce sector experienced a 29% year-over-year increase in GMV terms.


Restraints Impact Analysis

Restraint ~% Impact on CAGR Geographic Relevance Impact Timeline
Load-shedding and energy cost inflation −0.40% Nationwide Short-term (≤2 yr)
Import competition from Asian converters −0.35% Gauteng, KwaZulu-Natal Medium-term (2–4 yr)
Resin price volatility and rand weakness −0.30% Nationwide Short-term (≤2 yr)
Anti-plastic public sentiment and regulation −0.25% Western Cape, Gauteng Long-term (≥4 yr)
Skills shortage in polymer engineering −0.15% Nationwide Long-term (≥4 yr)


Load-Shedding and Energy Cost Inflation

Eskom's generation shortfall resulted in over 280 days of load-shedding in 2023, forcing plastic converters to operate diesel generators at costs exceeding ZAR 7.50 per kWh versus a ZAR 1.80 on-grid tariff [18]. Small and medium converters lacking capital for solar installations absorbed margin compression of 300–500 basis points, accelerating industry consolidation. While Eskom's new-build program and private renewable IPPs have moderated outages since mid-2024, the structural tariff trajectory — approved at CPI+3% annual escalation by NERSA — continues to erode cost competitiveness relative to Asian exporters.

Import Competition from Asian Converters

Finished PET preforms and BOPP films from China, Vietnam, and India entered South Africa at CIF prices 18–25% below domestic production cost in 2024 [19]. The International Trade Administration Commission of South Africa (ITAC) received anti-dumping petitions from local converters, but tariff relief proceedings typically span 12–18 months, leaving domestic producers exposed. The South Africa Plastic Packaging Market faces sustained pressure as Asian scale advantages widen, particularly in commodity-grade formats where differentiation is limited.

Resin Price Volatility

South Africa imports approximately 35% of its polymer requirements, making the sector acutely sensitive to both global naphtha pricing and ZAR/USD exchange fluctuations [7]. The rand depreciated 11% against the dollar between January 2023 and December 2024, compounding the impact of a 9% rise in benchmark HDPE prices over the same period. Converters operating on fixed-price supply agreements with FMCG customers absorbed the mismatch, tightening already thin margins.


South Africa Plastic Packaging Market Opportunities

Closed-Loop PET Recycling Infrastructure

South Africa's PET recycling rate reached 68% in 2024 according to the sources, but bottle-to-bottle recycling capacity remains below 30% of collected volume [8]. Investing in food-grade rPET decontamination plants presents a high-return opportunity, as EPR fee incentives and brand commitments create guaranteed off-take. Extrupet's Wadeville facility processes 50,000 tonnes annually, and two additional plants of similar scale are needed by 2030 to meet projected demand.

Mono-Material Flexible Pack Redesign Services

Brand owners facing the 2028 recyclability deadline need converter partners capable of re-engineering multi-layer laminates into mono-material structures without sacrificing barrier performance or shelf life. Converters offering in-house testing, regulatory navigation, and rapid prototyping can command 15–20% price premiums over commodity film suppliers, creating a defensible niche in a market trending toward consolidation.

Cold-Chain Packaging for African Continental Free Trade Area (AfCFTA)

The AfCFTA's phased tariff reductions are facilitating the establishment of intra-African trade corridors for South African processed food and pharmaceutical exports [22]. Insulated packaging solutions that are designed to withstand ambient temperatures exceeding 35°C and extended transit durations of 7–14 days are necessary for temperature-sensitive shipments to Nigeria, Kenya, and Ghana. The South African Plastic Packaging Market is strategically located to function as the continental hub for engineered cold-chain formats.


Smart and Connected Packaging

QR-coded, NFC-enabled, and blockchain-traced packaging formats are an emerging revenue stream that is currently valued at less than 2% of the total market. However, they are expected to grow at a rate that is twice the overall CAGR [23]. Woolworths and Pick n Pay, among other South African retailers, are currently conducting pilot programs for smart-label programs that are designed to verify the provenance of premium meat and wine products.


Data-Driven Packaging Optimization Platforms

Converter-operated SaaS platforms that aggregate fill-line efficiency, material waste, and EPR compliance data across FMCG client portfolios offer a recurring-revenue model layered onto physical packaging sales. Nampak's Digital Solutions division piloted such a platform with three multinational food companies in 2024, reducing packaging material waste by 8% across participating SKUs.


South Africa Plastic Packaging Market Future Outlook

Grid Stabilization and Cost Normalization (2026–2028)

The commissioning of over 6 GW of renewable IPP capacity under Bid Windows 5–7 of the Renewable Energy Independent Power Producer Procurement Programme (REIPPPP) is expected to reduce Stage 4+ load-shedding frequency by 80% before 2028 [18]. For the South Africa Plastic Packaging Market, grid stabilization translates directly into lower unit conversion costs, improved production scheduling reliability, and reduced capital tied up in backup generation — collectively releasing an estimated ZAR 1.2 billion in industry working capital.

Circular Economy Regulatory Maturation (2028–2031)

South Africa's EPR fee architecture will reach its full escalation schedule by 2030, at which point non recyclable packaging formats face fees four to six times higher than mono-material equivalents [6]. This regulatory ratchet will effectively price multi-layer laminates out of commodity applications, redirecting an estimated 35% of current flexible packaging volume toward redesigned mono-material formats and boosting demand for compatible adhesive, ink, and barrier-coating chemistries.

AfCFTA-Driven Export Expansion (2029–2033)

As tariff reductions under the AfCFTA Phase II protocols reach full implementation, South African converters with FSSC 22000 and BRC-certified facilities will capture contract manufacturing volumes from West and East African brands lacking local converting capacity [22]. The South Africa Plastic Packaging Market stands to add an incremental USD 120–180 million in export revenue by 2033, primarily in shelf-stable food pouches and pharmaceutical blister packaging.

Digitalization and Industry 4.0 Integration (2030–2035)

Adoption of AI-driven print inspection, IoT-connected extrusion monitoring, and digital-twin production planning will differentiate tier-one converters by 2032. The South Africa Plastic Packaging Market's largest players are already investing 3–5% of revenue in digital transformation programs. Nampak's partnership with Siemens on its Silverton flexible packaging line represents the first full-scale digital-twin deployment in African packaging conversion [23].


South Africa Plastic Packaging Market Segmentation

By Material

Segment Key Metric (2025) Primary Demand Driver
Polyethylene Terephthalate (PET) 37% share Beverage bottles, food trays
Polyethylene (PE) USD 0.74 Billion Carrier bags, agricultural films
Polypropylene (PP) 3.45% CAGR Microwavable containers, closures
Polyvinyl Chloride (PVC) 6% share Blister packs, cling wraps
Others (PS, PA, bio-based) 3.60% CAGR Specialty and niche applications


PET dominates the South Africa Plastic Packaging Market material mix thanks to the country's high per-capita consumption of carbonated soft drinks and bottled water — segments where PET's clarity, barrier properties, and established recycling infrastructure give it an unassailable position. Coca-Cola Beverages South Africa (CCBSA) alone consumes over 80,000 tonnes of PET resin annually across its nine bottling plants [14]. Polyethylene holds the second-largest value share, driven by its versatility in both rigid (blow-molded bottles) and flexible (shrink films, agricultural mulch) applications. Polypropylene's superior CAGR reflects its expanding role in ready-meal trays and e-commerce mailer envelopes where heat resistance and stiffness-to-weight ratios outperform alternatives.

By Product Type

Segment Key Metric (2025) Primary Demand Driver
Bottles and Jars 45% share Beverage, dairy, household chemicals
Films and Wraps 4.35% CAGR Fresh produce, export packaging
Pouches USD 0.38 Billion Sachet economy, refill formats
Others (trays, clamshells, tubes) 11% share Food service, pharmaceutical


Bottles and jars anchor the South Africa Plastic Packaging Market in product-type terms, with PET beverage bottles and HDPE dairy bottles together accounting for the bulk of this segment. The films and wraps category's faster growth rate reflects a structural shift: retailers including Woolworths, Checkers, and SPAR are converting produce packaging from rigid clamshells to flow-wrap and pillow-pack formats that reduce material usage by 30–40% per unit while improving shelf visibility [15].

By Packaging Format

Segment Key Metric (2025) Primary Demand Driver
Flexible 62% share Weight reduction, cost efficiency
Rigid 3.15% CAGR Barrier performance, stacking strength


Flexible formats command the majority of the South Africa Plastic Packaging Market by both volume and value, a reflection of the sachet economy's importance in LSM 1–6 consumer segments where single-serve and small-format packs dominate daily purchasing patterns.

By End-User Industry

Segment Key Metric (2025) Primary Demand Driver
Food 42% share Fresh, frozen, and shelf-stable categories
Beverages USD 0.62 Billion CSD, water, juice, dairy
Healthcare and Pharmaceuticals 3.55% CAGR Blister packs, IV bags, diagnostic kits
Personal and Home Care 4.10% CAGR Sachets, refill pouches, dispensers
Others (industrial, agricultural) 8% share Agri-chemical containers, lubricant packs


Food applications represent the largest vertical within the South Africa Plastic Packaging Market, reflecting a population of 62 million where packaged food penetration continues rising with urbanization and formalization of retail channels [10]. Personal and home care's superior CAGR is propelled by local manufacturers such as Unilever South Africa and Amka Products expanding sachet formats for shampoo, conditioner, and cleaning products targeted at price-sensitive consumers.


Regional Market Share Analysis

Province/Region Key Metric (2025) Primary Investment Themes
Gauteng 37% market share FMCG headquarters, logistics hubs, recycling plants
Western Cape 3.52% CAGR (2026–2035) Agricultural exports, cold-chain expansion
KwaZulu-Natal USD 0.51 Billion Port logistics, beverage filling
Eastern Cape 8% market share Automotive component packaging
Rest of South Africa USD 0.39 Billion Mining consumables, rural retail expansion
Total USD 2.84 Billion

South Africa's plastic packaging demand concentrates along the Gauteng–Durban–Cape Town industrial corridor, with secondary pockets in the Eastern Cape automotive belt and Limpopo's agricultural zones. Provincial distribution reflects both population density and industrial activity patterns unique to the South Africa Plastic Packaging Market.


Gauteng

Metro/Area Key Metric Key Driver
Johannesburg 18% of national market FMCG corporate procurement concentration
Pretoria/Tshwane USD 0.28 Billion Government procurement and pharmaceutical packaging
Ekurhuleni 3.25% CAGR O.R. Tambo air-freight export packaging corridor


Gauteng's dominance in the South Africa Plastic Packaging Market stems from its role as the decision-making hub for multinational FMCG companies including Unilever, Tiger Brands, and Pioneer Foods. The Gauteng Provincial Government's Green Economy Strategy allocates ZAR 450 million toward recycling infrastructure in the Sedibeng and West Rand districts, targeting a 40% diversion rate for post-consumer plastic by 2029 [24].

Western Cape

Metro/Area Key Metric Key Driver
Cape Town Metro 12% of national market Fresh produce packaging, retail innovation
Cape Winelands 3.68% CAGR Wine and spirits closure systems, labels
Saldanha/West Coast USD 0.06 Billion Seafood processing packaging


The Western Cape's position as the fastest-growing province in the South Africa Plastic Packaging Market reflects its agricultural export orientation. The province handles 55% of South Africa's deciduous fruit exports and 40% of wine shipments, each requiring specification-grade packaging that commands margins 20–30% above commodity applications [11].

KwaZulu-Natal

Metro/Area Key Metric Key Driver
eThekwini (Durban) 14% of national market Port-adjacent beverage and food converters
Pietermaritzburg 2.95% CAGR Dairy and processed-meat packaging
Richards Bay USD 0.04 Billion Industrial packaging for mineral exports


Durban's port proximity gives KwaZulu-Natal converters a logistics cost advantage for both imported resin receipt and finished-packaging export. SABMiller's (now AB InBev's) Prospecton brewery, one of the largest in Africa, anchors local PET preform and shrink-sleeve demand [14].

Eastern Cape

Metro/Area Key Metric Key Driver
Nelson Mandela Bay 5% of national market Automotive component protective packaging
East London/Buffalo City 2.80% CAGR Pharmaceutical blister packs


The Eastern Cape's automotive cluster — hosting Volkswagen, Mercedes-Benz, and Ford assembly plants — generates steady demand for VCI films, dunnage trays, and anti-static protective wraps used in component shipment along the N2 corridor to Durban port [25].

Rest of South Africa

Province Key Metric Key Driver
Limpopo USD 0.12 Billion Citrus and subtropical fruit packaging
Mpumalanga 3.10% CAGR Coal sector industrial packaging
Free State USD 0.08 Billion Grain and maize milling packaging
North West & Northern Cape 3% combined share Mining consumables


Rural provinces contribute a smaller but strategically important share of the South Africa Plastic Packaging Market. Limpopo's Letsitele and Hoedspruit valleys alone produce over 100 million cartons of citrus annually, with packaging specifications increasingly dictated by EU phytosanitary and sustainability requirements [11].


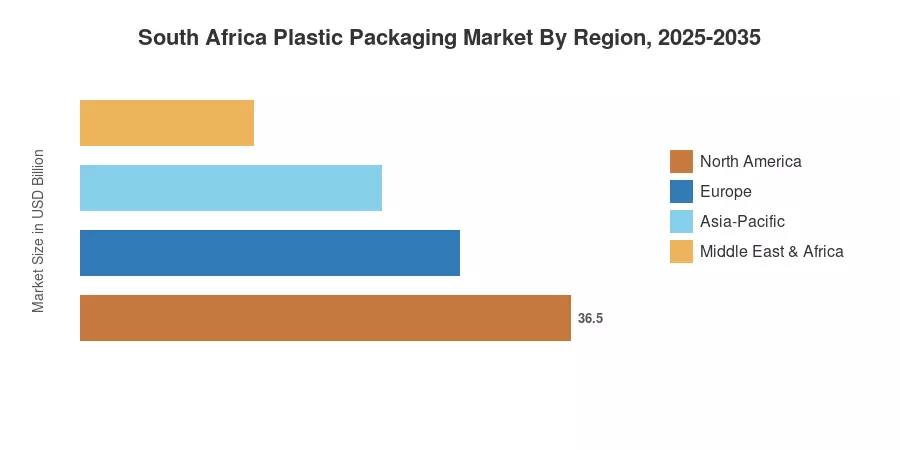
South Africa Plastic Packaging Market By Region, 2025-2035

Competitive Benchmarking

The South Africa Plastic Packaging Market exhibits medium concentration, with the top five players collectively controlling an estimated 38–45% of revenue. The Herfindahl-Hirschman Index sits in the 800–1,200 range, indicating a competitive but consolidating structure. Scale-driven cost advantages, backward integration into recycling, and customer lock-in through co-located packaging lines are the primary competitive moats.

Company Est. Revenue Share Range Key Offerings Strategic Positioning
Nampak Limited ~10–14% PET preforms, beverage cans, cartons Vertically integrated; largest African packaging group
Mpact Limited ~7–10% Corrugated, plastics (trays, bins) Recycling-integrated; circular economy leader
Polyoak Packaging ~5–8% Rigid containers, closures, pails Blow-molding specialist; dairy and chemical end-markets
RPC Astrapak (Berry Global) ~5–7% Injection-molded containers, films Global parent; technology transfer advantage
Bowler Metcalf Group ~4–6% Blow-molded bottles, household containers Integrated plastics and chemicals
Alpla Group ~3–5% PET preforms, HDPE bottles, closures Global footprint; in-house mold engineering
Sealed Air South Africa ~2–4% Protective packaging, shrink films Automation-led; e-commerce focus
Safripol (KAP Industrial) ~3–5% HDPE, PP resin and converted products Upstream integration; polymer self-sufficiency
Constantia Flexibles SA ~2–4% Flexible laminates, labels, foils Pharma and premium food focus
Plastop SA ~1–3% Closures, dispensing systems Niche closure specialist; export-oriented


Recent News & Developments

  • Nampak Limited (March 2025): Commissioned a ZAR 680 million solar microgrid at its Springs beverage-can and PET facility, reducing grid dependency by 65% and cutting Scope 2 emissions by an estimated 42,000 tonnes CO₂e annually [3].


  • Department of Forestry, Fisheries and the Environment (July 2024): Published updated EPR fee schedules for 2025–2027, increasing non-recyclable packaging levies by 22% and widening the fee differential versus recyclable formats [6].


  • Polyoak Packaging (January 2024): Opened a R210 million blow-molding plant in Durban's Prospecton industrial zone, adding 15,000 tonnes of rigid container capacity focused on dairy and edible-oil markets [14].
  • Woolworths Holdings (September 2023): Committed to 100% recyclable, reusable, or compostable own-brand packaging by 2028, accelerating specification changes across its 450-plus food supplier base [2].
  • PETCO South Africa (June 2023): Reported a national PET collection rate of 68% for 2022, positioning South Africa among the top five PET recycling countries globally and stimulating further investment in bottle-to-bottle infrastructure [8].


South Africa Plastic Packaging Market Report Scope

Parameter Detail
Market Scope South Africa Plastic Packaging Market — production, conversion, and end-use demand
Study Period 2021–2035
Historical Period 2021–2024
Base Year 2025
Forecast Period 2026–2035
CAGR (2026–2035) 3.08%
Market Size (2025) USD 2.84 Billion
Market Size (2035) USD 3.85 Billion
Fastest Growing Segment Personal and Home Care end-user (4.10% CAGR)
Companies Profiled 10
Valuation Currency USD Billion


FAQs

How does load-shedding affect packaging converter selection criteria for FMCG procurement managers?
Procurement teams increasingly weigh energy self-sufficiency — solar capacity, battery backup, and diesel reserves — alongside price and quality during converter audits. Facilities without verified backup power risk losing preferred-supplier status on time-sensitive FMCG contracts [18].
What minimum order quantities should new market entrants expect from South African converters?
Typical MOQs for custom-printed flexible pouches range from 50,000 to 100,000 units, while rigid blow-molded containers start at 20,000 units per SKU. Converters with digital printing capability can offer lower runs of 10,000–25,000 units at a 15–25% price premium [23].
How do EPR fee differentials influence packaging format decisions at the brand-owner level?
Mono-material packs classified as "recyclable" pay EPR levies up to 75% lower than multi-layer laminates under the current DFFE schedule. This gap makes material redesign economically viable even when converter pricing for mono-material films runs 8–12% higher [6].
What role does PETCO's deposit-return feasibility study play in shaping the South Africa Plastic Packaging Market investment outlook?
PETCO's pilot proposes a ZAR 0.50–1.00 deposit on PET beverage bottles, which would redirect collection economics and create captive rPET supply. Investors should monitor the 2026 policy decision, as approval would accelerate bottle-to-bottle recycling capex [8].
How are South African converters addressing the skills gap in polymer engineering and digital manufacturing?
Leading firms partner with CHIETA-accredited training providers and university polymer-science programs at Stellenbosch and Wits. Apprenticeship pipelines typically take 18–24 months to produce production-ready technicians [21].
What packaging specification trends should pharmaceutical companies monitor in the South Africa Plastic Packaging Market through 2035?
SAHPRA's updated stability-testing guidelines favor high-barrier PVC/PVDC and cold-form aluminum blisters for moisture-sensitive APIs. Converters investing in child-resistant closure tooling and serialization-ready packaging gain a compliance advantage [25].
How does the AfCFTA tariff phase-down create export opportunities for South Africa Plastic Packaging Market participants?
Phase II tariff reductions to zero on 90% of intra-African goods by 2031 open contract-manufacturing volumes in West and East Africa. FSSC 22000-certified South African facilities hold a quality advantage over regional competitors [22].    
Author
Author
Author Profile
Snehal Singh LinkedIn
Manager - Research
High acumen in analyzing complex macro & micro markets with more than 6 years of work experience in the field of market research. By implementing her analytical skills in forecasting and estimation into market research reports, she has expertise in Packaging, Construction, and Equipment domains. She handles a team size of 20-25 resources and ensures smooth running of the projects, associated marketing activities, and client servicing.
Download Free Sample

Kindly complete the form below to receive a free sample of this Report

Download PDF ×

We do not share your information with anyone. However, we may send you emails based on your report interest from time to time. You may contact us at any time to opt-out.
















