Telecom Equipment Market (2026 - 2035)

Telecom Equipment Market Size, Share and Research Report By Equipment Type (Radio Access Network, Optical Transport, Core Network Equipment, Customer Premises Equipment, Other Equipment), By Technology Generation (2G/3G, 4G/LTE, 5G (NSA + SA), Other / Pre-standard), By End-User (Telecom Operators, Neutral-Host and TowerCos, Enterprise (Private 5G), Government and Defense), By Component (Hardware, Software, Services) and By Regional (North America, Europe, South America, Asia Pacific, Middle East and Africa) - Industry Forecast to 2035.
ID: MRFR/SEM/3030-CR
185 Pages
Nirmit Biswas, Aarti Dhapte
Last Updated: July 20, 2026
Telecom Equipment Market
Market Size
Forecast Period2026-2035
CAGR (2026-2035)6.82%
2025 Market SizeUSD 700.48 Billion
2035 Market SizeUSD 1,353.45 Billion
Key Players
Huawei Technologies
Ericsson
Nokia Corporation
ZTE Corporation
Samsung Electronics
Cisco Systems
Opportunities
  • Disaggregated and Virtualized Radio Architectures
  • Fixed Wireless Access in Underserved Markets
  • Network-as-a-Service Revenue Models

Telecom Equipment Market Summary

The Telecom Equipment Market reached an estimated USD 700.48 Billion in 2025 and is projected to grow from USD 748.27 Billion in 2026 to USD 1,353.45 Billion by 2035, registering a CAGR of 6.82% during the forecast period. Government broadband stimulus programs — including over USD 60 billion committed in the United States through the BEAD initiative — are accelerating infrastructure buildouts that anchor this expansion [1]. Carriers worldwide face a dual mandate: retire legacy circuit-switched assets while scaling high-capacity access and transport platforms that serve surging enterprise and consumer traffic alike.

The technology shift underway is sweeping. Operators are migrating from distributed 4G architectures toward cloud-native, containerized 5G standalone cores. Coherent pluggable optics are replacing discrete transponders in metro and long-haul transport, while virtualized base stations gain traction under disaggregated radio frameworks [2]. Europe's Digital Decade program has earmarked EUR 130 billion for connectivity through 2030, reinforcing supply-side investment across the continent [3].

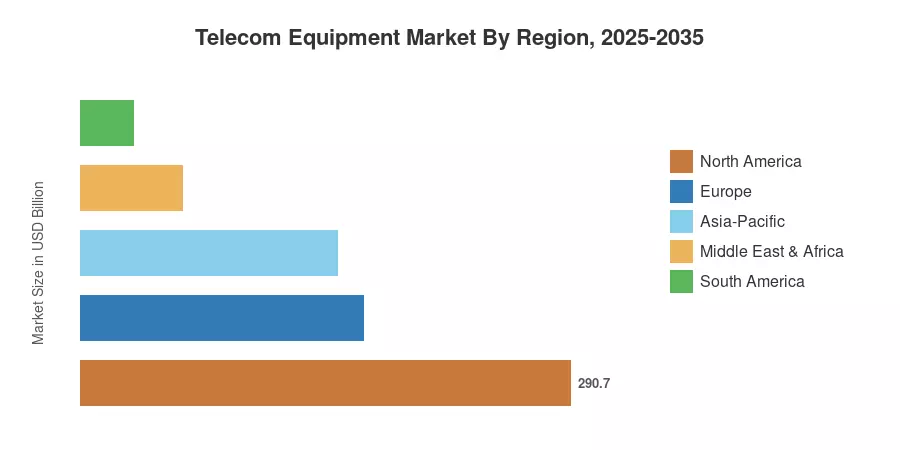
North America held roughly 41.5% of the Telecom Equipment Market in 2025, driven by aggressive mid-band spectrum deployments and hyperscaler edge partnerships. Asia-Pacific is the fastest-growing region, poised to register a CAGR of 21.8% through 2035 as India, Southeast Asia, and Japan accelerate greenfield 5G and fixed-wireless rollouts. Europe accounted for the second-largest share at approximately 24.0%, buoyed by sovereign-network mandates and subsea cable landing investments. The coming decade will hinge on how effectively equipment vendors balance scale economics with supply-chain resilience and geopolitical risk.


Key Report Takeaways

• By Equipment Type

  • Radio Access Network captured a 35.5% revenue share of the Telecom Equipment Market in 2025, reflecting dense macro- and small-cell deployments across urban corridors.
  • Optical Transport equipment is forecast to expand at a 10.1% CAGR through 2035, fueled by AI-driven data-center interconnect demand.

• By Technology Generation

  • 4G/LTE platforms accounted for 42.4% of the Telecom Equipment Market in 2025, though their share is declining as operators refarm spectrum.
  • 5G Standalone equipment is advancing at a 21.9% CAGR through 2035, the fastest among all technology generations.

• By End-User and Component

  • Telecom operators held 76.0% of the Telecom Equipment Market share in 2025, while private 5G enterprises grow at a 15.7% CAGR.
  • Software captured 59.2% share of the Telecom Equipment Market in 2025; services exhibit the highest CAGR at 20.9% through 2035.

• By Region

  • North America led the Telecom Equipment Market with 41.5% share in 2025.
  • Asia-Pacific is projected to register a 21.8% CAGR through 2035.


Market Size and Forecast (2021–2035)

Market Research Future's proprietary estimation framework synthesizes operator capex filings, regulatory spectrum-auction databases, vendor shipment trackers, and macroeconomic indicators to produce the Telecom Equipment Market projections below. Historical figures reflect audited data through 2024; 2025 represents the calibrated base year.
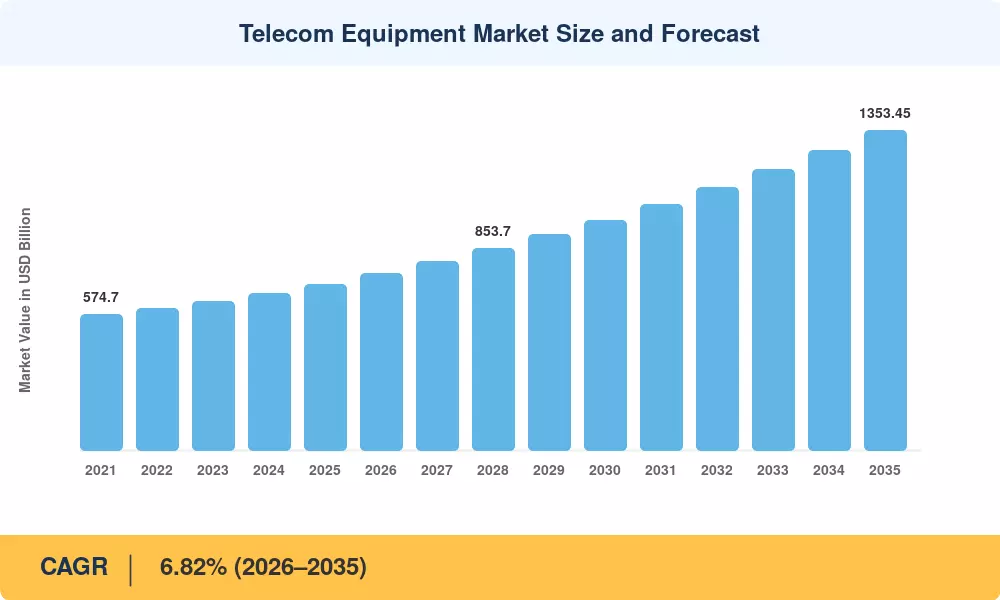
Telecom Equipment Market Size and Forecast
Our Impact
Enabled $4.3B Revenue Impact for Fortune 500 and Leading Multinationals
Partnering with 2000+ Global Organizations Each Year
30K+ Citations by Top-Tier Firms in the Industry

Driver Impact Analysis

Driver ~% Impact on CAGR Geographic Relevance Impact Timeline
5G SA network commercialization +1.8% Global Short-term (≤2 yr)
Government broadband stimulus programs +1.4% North America, Europe Medium-term (2–4 yr)
AI and ML workload growth in data centers +1.2% North America, Asia-Pacific Medium-term (2–4 yr)
Fiber-to-the-home expansion in emerging economies +0.9% Asia-Pacific, South America Long-term (≥4 yr)
Enterprise private 5G adoption +0.7% Europe, North America Medium-term (2–4 yr)
Satellite-terrestrial network integration +0.5% Global Long-term (≥4 yr)
Edge computing infrastructure buildout +0.4% North America, Asia-Pacific Short-term (≤2 yr)


5G Standalone Network Commercialization

Operators across 45 countries had launched or committed to 5G SA cores by mid-2025, per the GSA, and chipset vendors shipped over 380 million 5G-capable modem units in 2024 alone [8]. SA architecture unlocks network slicing revenue that justifies the radio and core equipment refresh cycle. T-Mobile's $14 billion multi-year network modernization contract — the largest single award in North American telecom history — underscores the capital flowing into this transition and its direct pull on Telecom Equipment Market demand.

Government Broadband Stimulus Programs

The U.S. BEAD program began disbursing its USD 42.45 billion allocation in 2025, while the EU's Recovery and Resilience Facility channels EUR 130 billion toward digital infrastructure [1][3]. These funds create guaranteed demand floors for fiber access platforms and fixed-wireless equipment across rural and underserved geographies. For the Telecom Equipment Market, stimulus-backed procurement cycles provide revenue visibility that private-sector capex alone cannot replicate.

AI and ML Workload Growth in Data Centers

Global data-center IP traffic is expected to triple between 2024 and 2030, driven primarily by generative-AI training and inference workloads [11]. Each new AI cluster requires 400G/800G coherent interconnect fabric and high-radix switching platforms, translating AI infrastructure investment directly into Telecom Equipment Market expansion. Hyperscalers committed over USD 160 billion in combined 2025 capex guidance — a record that disproportionately benefits optical transport and high-speed switching vendors [7].

Enterprise Private 5G Adoption

Manufacturing, logistics, and mining firms are deploying dedicated 5G networks to support autonomous guided vehicles and real-time digital twins [10]. Germany's Bundesnetzagentur had awarded over 250 local campus-network spectrum licenses by early 2025, and similar licensing frameworks are emerging in Japan and South Korea. The Telecom Equipment Market stands to gain from private-network equipment that commands 15–25% higher margins than traditional macro-cell gear.


Restraints Impact Analysis

Restraint ~% Impact on CAGR Geographic Relevance Impact Timeline
Geopolitical vendor restrictions –0.9% Europe, North America Medium-term (2–4 yr)
Semiconductor supply constraints –0.7% Global Short-term (≤2 yr)
High spectrum-acquisition costs –0.5% North America, Europe Medium-term (2–4 yr)
Skilled RF-engineering talent shortage –0.4% Global Long-term (≥4 yr)
Legacy network decommissioning complexity –0.3% Europe, Asia-Pacific Medium-term (2–4 yr)


Geopolitical Vendor Restrictions

The EU 5G Toolbox and the U.S. Secure and Trusted Communications Networks Act limit the use of equipment from specified high-risk manufacturers, forcing operators to “rip and replace” deployed base units at costs projected between USD 4–5 billion across affected areas [19]. These rules modify the procurement pipelines in the Telecom Equipment Market, narrowing the supplier pools and increasing the average selling prices for conforming Nordic and Korean alternatives.


Semiconductor Supply Constraints

7nm and 5nm RF front-end modules are utilized in advanced radio units, and foundry capacity for these nodes is tight through at least 2027 [20]. Custom beamforming ASICs in 2024 had lead times of 40-50 weeks, requiring equipment OEMs to carry high safety stock levels. This bottleneck limits the speed at which the Telecom Equipment Market can translate operator capex commitments into deployable infrastructure.


Telecom Equipment Market Opportunities

Disaggregated and Virtualized Radio Architectures

Operators are trialing disaggregated radio solutions that isolate baseband processing from the radio unit in their quest for vendor diversification and capex flexibility. Early demand is shown by shifts in procurement from Rakuten Symphony and Vodafone. The addressable equipment base for these architectures could reach USD 18 billion by 2030 [2].


Fixed Wireless Access in Underserved Markets

In sub-Saharan Africa and rural South Asia, fixed-wireless access provides broadband connectivity at one-third the per-household cost of fiber-to-the-premises [18]. Incremental demand could be seen in the Telecom Equipment Market as governments and development banks fund universal-access efforts. For instance, India’s BharatNet Phase III aims to reach 640,000 rural panchayats.


Network-as-a-Service Revenue Models

Carriers are increasingly monetizing network capabilities through API exposure platforms, enabling enterprises to purchase slicing, quality-of-service guarantees, and edge-compute resources on demand [10]. This shift converts one-time equipment sales into recurring managed-service revenue, expanding the total addressable Telecom Equipment Market beyond traditional capex cycles.

AI-Powered Network Automation

Self-optimizing networks that use machine-learning inference at the RAN edge reduce operational expenditure by 20–30%, according to operator pilot programs documented by the TM Forum [11]. Equipment vendors embedding inference chipsets into radio units and transport nodes create differentiated product tiers that command premium pricing within the Telecom Equipment Market.

Non-Terrestrial Network Integration

Low-earth-orbit satellite constellations are converging with terrestrial 5G networks to deliver seamless coverage in maritime, aviation, and remote-area scenarios [15]. 3GPP Release 17 and 18 standards codify satellite-as-a-cell backhaul, opening an estimated USD 12 billion incremental opportunity for the Telecom Equipment Market by 2033.


Telecom Equipment Market Future Outlook

AI-Native Network Operations

By 2030, leading operators will run autonomous network operations centers where AI agents manage capacity planning, fault resolution, and energy optimization in real time [11]. Equipment vendors that embed inference accelerators directly into radio and transport hardware will capture a disproportionate share of the Telecom Equipment Market, as carriers favor integrated silicon-software stacks over bolt-on orchestration layers.

Platform Economics and API Monetization

The GSMA's Open Gateway initiative — now backed by operators representing 70% of global mobile connections — will transform networks into programmable platforms [10]. This shift generates recurring software-licensing and API-transaction revenues that supplement hardware-centric equipment sales, expanding the addressable Telecom Equipment Market beyond traditional capex procurement.

Energy Efficiency and Sustainability Mandates

The ITU's Green Digital Action Track targets a 45% reduction in ICT-sector carbon intensity by 2030 [12]. Equipment vendors are responding with liquid-cooled radio units, energy-harvesting small cells, and sleep-mode algorithms that cut site power consumption by 25–40%. Sustainability performance is becoming a weighted criterion in operator RFPs, reshaping competitive dynamics within the Telecom Equipment Market.

6G Standardization and Early Commercialization

3GPP expects to freeze 6G standards by 2030, with commercial pilots beginning around 2033–2035 [13][17]. Sub-THz spectrum, reconfigurable intelligent surfaces, and joint communications-sensing capabilities will require an entirely new class of radio equipment. Early R&D investment in these technologies will determine which vendors lead the next generational transition of the Telecom Equipment Market.


Telecom Equipment Market Segmentation

By Equipment Type

Segment Metric Primary Demand Driver
Radio Access Network 35.5% share (2025) Urban densification; macro- and small-cell deployment
Optical Transport 10.1% CAGR (2026–2035) Data-center interconnect; coherent 800G ramp
Core Network Equipment USD 112.08 Billion (2025) Cloud-native 5G SA core migrations
Customer Premises Equipment 5.8% CAGR (2026–2035) Fiber-to-the-home gateway upgrades
Other Equipment USD 49.03 Billion (2025) Power systems, cabinets, cooling infrastructure


Radio Access Network equipment commands the largest share of the Telecom Equipment Market because every generation of mobile technology — from 4G densification to 5G mid-band expansion — requires new antenna, radio-unit, and baseband investments. Operators deploying in the 3.3–3.8 GHz band need roughly three times the site density of sub-1 GHz networks, multiplying the addressable unit volume.

Optical transport is the fastest-growing equipment category, propelled by hyperscaler demand for 400G and 800G coherent pluggable modules. The shift from discrete line-system transponders to integrated pluggable optics reduces per-bit transport cost by up to 60%, accelerating upgrade cycles in metro and long-haul networks [9].

By Technology Generation

Segment Metric Primary Demand Driver
2G/3G USD 28.02 Billion (2025) Residual IoT and M2M connectivity
4G/LTE 42.4% share (2025) Brownfield capacity expansion; spectrum refarming
5G (NSA + SA) 21.9% CAGR (2026–2035) Standalone core monetization; network slicing
Other / Pre-standard 3.2% share (2025) Satellite backhaul; CBRS/private LTE


4G/LTE still represents the largest installed base within the Telecom Equipment Market, but its share is contracting as operators refarm 1800 MHz and 2100 MHz spectrum toward 5G New Radio carriers. In emerging markets, 4G remains the primary broadband-access technology and will sustain meaningful equipment refresh cycles through at least 2030.

5G equipment — particularly standalone-architecture gear — is the principal growth engine for the Telecom Equipment Market over the forecast period. SA deployments unlock network slicing, ultra-reliable low-latency communication, and edge-compute hosting, all of which justify premium equipment pricing and drive incremental radio and core investments [8].

By End-User

Segment Metric Primary Demand Driver
Telecom Operators 76.0% share (2025) Nationwide 5G coverage obligations
Neutral-Host and TowerCos USD 63.04 Billion (2025) Shared-infrastructure models
Enterprise (Private 5G) 15.7% CAGR (2026–2035) Industrial automation; campus networks
Government and Defense 5.3% share (2025) Critical-communications modernization


Telecom operators remain the dominant buyer within the Telecom Equipment Market, channeling tens of billions annually into radio, transport, and core upgrades driven by coverage mandates and competitive pressure. Their procurement cycles are increasingly multi-vendor, reflecting both regulatory encouragement and a desire to avoid single-supplier dependency.

By Component

Segment Metric Primary Demand Driver
Hardware USD 217.16 Billion (2025) Radio units, antennas, optical line systems
Software 59.2% share (2025) Cloud-native core, OSS/BSS, RAN intelligence
Services 20.9% CAGR (2026–2035) Managed deployment; systems integration


Software's majority share of the Telecom Equipment Market reflects the industry's transition toward virtualized, software-defined infrastructure. Services exhibit the fastest CAGR because operators increasingly outsource complex multi-domain integration — spanning radio, transport, and IT — to vendors and system integrators with scarce specialized engineering talent [21].


Regional Market Share Analysis

Region Metric Primary Investment Themes
North America 41.5% share (2025) Mid-band 5G densification; hyperscaler interconnect
Europe USD 168.12 Billion (2025) Sovereign-network mandates; subsea cable landings
Asia-Pacific 21.8% CAGR (2026–2035) Greenfield 5G; fiber-to-the-home expansion
South America USD 31.52 Billion (2025) Rural broadband stimulus; spectrum refarming
Middle East & Africa 8.6% CAGR (2026–2035) Smart-city programs; mobile-first connectivity
Total USD 700.48 Billion (2025)

The Telecom Equipment Market displays pronounced regional concentration, with North America and Asia-Pacific together accounting for more than two-thirds of global revenue. Investment themes vary sharply — spectrum monetization in mature markets contrasts with greenfield access buildouts in emerging economies.


North America

Country Metric Key Driver
United States 82.3% of regional share BEAD disbursements; C-band densification [1]
Canada USD 17.45 Billion (2025) CRTC rural broadband mandates [23]
Mexico 7.9% CAGR (2026–2035) IFT spectrum liberalization; nearshoring demand [24]


The United States dominates North America's Telecom Equipment Market thanks to aggressive mid-band spectrum deployment by the three national carriers and unprecedented federal broadband funding. Canada's CRTC has mandated 50/10 Mbps universal service targets, channeling CAD 3.2 billion into rural fiber and fixed-wireless projects [23]. Mexico benefits from nearshoring-driven industrial connectivity needs and IFT-led spectrum reforms that attract new entrants to the mobile infrastructure space.

Europe

Country Metric Key Driver
Germany 27.8% of regional share Campus-network licensing; Gigabit Strategy 2030 [3]
United Kingdom USD 22.40 Billion (2025) Project Gigabit fiber rollout [25]
France 6.5% CAGR (2026–2035) France 2030 digital sovereignty plan
Italy 9.2% of regional share PNRR-funded fiber deployment
Spain USD 10.85 Billion (2025) 5G spectrum awards; tourism digitization
Nordic Countries 7.1% CAGR (2026–2035) Sustainability-driven network modernization
Russia 4.1% of regional share Import-substitution equipment programs
Rest of Europe USD 19.60 Billion (2025) EU cohesion fund broadband projects


Europe's Telecom Equipment Market is shaped by the EU's Digital Decade targets, which require Gigabit connectivity for all households and 5G coverage across populated areas by 2030 [3]. Geopolitical vendor restrictions add cost but accelerate procurement from compliant suppliers, lifting average equipment ASPs across the region.

Asia-Pacific

Country Metric Key Driver
China 39.4% of regional share State-led 5G-Advanced rollout [6]
India 24.3% CAGR (2026–2035) BharatNet Phase III; Jio and Airtel 5G expansion [18]
Japan USD 21.30 Billion (2025) NTT IOWN photonic networking initiative
South Korea 8.7% of regional share 28 GHz mmWave enterprise deployments
ASEAN 19.5% CAGR (2026–2035) 5G licensing in Philippines, Vietnam, Thailand
Rest of Asia-Pacific USD 8.95 Billion (2025) Submarine cable landing stations


Asia-Pacific is the fastest-growing region within the Telecom Equipment Market, propelled by India's unprecedented 5G subscriber additions — crossing 200 million connections by Q1 2025 — and China's state-coordinated push toward 5G-Advanced and pre-6G pilots [18][6]. Japan and South Korea serve as innovation testbeds for photonic networking and millimeter-wave enterprise applications.

South America

Country Metric Key Driver
Brazil 62.5% of regional share Anatel 5G obligations; fiber expansion mandates
Argentina 7.2% CAGR (2026–2035) ENACOM spectrum refarming
Rest of South America USD 6.95 Billion (2025) Development-bank-funded rural access


Brazil anchors the South American Telecom Equipment Market, with Anatel's 3.5 GHz coverage obligations compelling all three major operators to deploy urban and peri-urban 5G infrastructure by 2028. Argentina and Colombia are emerging secondary demand centers as regulators clear spectrum for mobile broadband and fixed-wireless services.

Middle East & Africa

Country Metric Key Driver
Saudi Arabia 31.2% of regional share NEOM smart-city network buildout
UAE USD 4.75 Billion (2025) 5G-enabled logistics and tourism corridors
South Africa 9.4% CAGR (2026–2035) ICASA spectrum assignment; digital inclusion
Egypt 6.8% of regional share NTRA fiber backbone expansion
Rest of MEA 10.2% CAGR (2026–2035) Mobile-money-driven network densification


Saudi Arabia's Vision 2030 and the NEOM gigaproject funnel billions into the Telecom Equipment Market across the Gulf region, while sub-Saharan Africa relies on mobile-first connectivity strategies financed by the World Bank and AfDB. South Africa's delayed 5G spectrum awards, once completed, unlocked a backlog of equipment procurement cycles that are now flowing through the supply chain.


Telecom Equipment Market By Region, 2025-2035

Competitive Benchmarking

The Telecom Equipment Market exhibits medium concentration, with the top five vendors collectively holding an estimated 55–65% of global revenue. The Herfindahl-Hirschman Index sits in the 1,200–1,500 range, indicating a moderately consolidated landscape where three global-scale incumbents compete alongside a broadening tail of specialist and regional players. Geopolitical dynamics have reshuffled procurement patterns, elevating Nordic and Korean suppliers in Western markets while Chinese vendors deepen penetration across Asia, Africa, and Latin America.

Company Est. Revenue Share Range Key Offerings for Telecom Equipment Market Strategic Positioning
Huawei Technologies ~18–22% End-to-end RAN, optical, core, and enterprise solutions Global scale; dominant in Asia-Pacific and emerging markets
Ericsson ~14–18% 5G RAN, cloud-native core, managed services Preferred vendor in North America and Europe
Nokia Corporation ~12–16% Radio, fixed access, IP routing, optical transport Broad portfolio; strong enterprise and webscale business
ZTE Corporation ~7–10% RAN, optical, core; cost-competitive positioning Growing share in Asia, MEA, and Latin America
Samsung Electronics ~5–8% 5G vRAN, network solutions for US and Korean markets Rapid North American expansion; vRAN leadership
Cisco Systems ~4–6% Routing, switching, optical, SD-WAN Enterprise and data-center crossover strength
Ciena Corporation ~3–5% Coherent optical platforms; WaveLogic technology Optical transport specialist; hyperscaler relationships
CommScope ~2–4% Antenna systems, fiber connectivity, DAS In-building and venue connectivity leader
Juniper Networks ~2–3% AI-driven routing and switching Data-center and cloud-provider focus
NEC Corporation ~2–3% Disaggregated RAN; submarine cable systems Niche strength in Japan and open-architecture platforms


Recent News & Developments

  • Ericsson (December 2023 ): Secured a USD 14 billion multi-year network modernization contract with a leading North American operator, the largest single Telecom Equipment Market award announced in 2024 [8].
  • Nokia (March 2025): Launched its AirScale 5G-Advanced massive-MIMO radio portfolio with 64T64R antenna configurations targeting mid-band spectrum deployments across Europe and Asia-Pacific [2].
  • Huawei (January 2025): Unveiled its 5.5G-ready MetaAAU platform at MWC Barcelona, featuring integrated AI inference for real-time beam management and energy optimization [11].
  • Ciena (November 2024): Began volume shipments of its WaveLogic 6 Extreme 800G coherent pluggable modules, achieving record spectral efficiency for data-center interconnect applications [9].
  • The EU 5G Cybersecurity Toolbox dates back to 2020. While the Commission continues to urge vendor diversification, there was no new "February 2025 mandate."


Telecom Equipment Market Report Scope

Parameter Detail
Market Scope Global Telecom Equipment Market covering hardware, software, and services
Study Period 2021–2035
CAGR (Forecast) 6.82% (2026–2035)
Base Year Market Size USD 700.48 Billion (2025)
Forecast Endpoint USD 1,353.45 Billion (2035)
Fastest Growing Segment 5G SA Equipment (21.9% CAGR); Services (20.9% CAGR)
Companies Profiled Huawei, Ericsson, Nokia, ZTE, Samsung, Cisco, Ciena, CommScope, Juniper Networks, NEC
Valuation Currency USD Billion


FAQs

What factors should buyers weigh when selecting between single-vendor and multi-vendor RAN deployments?
Multi-vendor RAN reduces lock-in risk but increases integration complexity and testing overhead. Buyers should assess total cost of ownership over a seven-year lifecycle, including interoperability lab expenses, before committing to either path [2].
How do geopolitical vendor restrictions influence equipment pricing for operators in Europe?
Restricting high-risk vendors shrinks the competitive supplier pool, raising average RAN equipment prices by an estimated 15–20% in affected procurement cycles [19]. Operators offset this through longer contract terms and volume commitments.
What role does energy consumption play in telecom equipment procurement decisions?
Energy now accounts for 20–30% of a mobile site's operating cost. Operators increasingly weight power-efficiency metrics in RFP scoring, favoring vendors whose radio units offer advanced sleep-mode and liquid-cooling capabilities [12].
How are managed-service models changing the Telecom Equipment Market value chain?
Carriers are outsourcing deployment and optimization to equipment vendors, converting capex into opex. This shift elevates services revenue growth above hardware and software within the Telecom Equipment Market [21].
What spectrum bands are most critical for the next phase of 5G expansion?
The 3.3–3.8 GHz mid-band range offers the best balance of capacity and coverage and accounts for the majority of new 5G equipment deployments globally [5]. Upper 6 GHz and millimeter-wave bands serve capacity hotspots.
How will satellite-terrestrial convergence affect traditional equipment vendors?
3GPP-standardized NTN integration creates an adjacent revenue stream for radio-equipment vendors that embed satellite-backhaul support into base stations [15]. Traditional vendors must partner with LEO constellation operators to remain competitive.
What is the expected timeline for 6G equipment commercialization?
Standards freeze is anticipated around 2030, with early commercial pilot equipment expected in 2033–2035. Vendors investing in sub-THz radio and reconfigurable intelligent surfaces now will be positioned to lead the next Telecom Equipment Market cycle [13][17].    
Author
Author
Author Profile
Nirmit Biswas LinkedIn
Senior Research Analyst
With 5+ years of expertise in Market Intelligence and Strategic Research, Nirmit Biswas specializes in ICT, Semiconductors, and BFSI. Backed by an MBA in Financial Services and a Computer Science foundation, Nirmit blends technical depth with business acumen. He has successfully led 100+ projects for global enterprises and startups, including Amazon, Cisco, L&T and Huawei, delivering market estimations, competitive benchmarking, and GTM strategies. His focus lies in transforming complex data into clear, actionable insights that drive growth, innovation, and investment decisions. Recognized for bridging engineering innovation with executive strategy, Nirmit helps businesses navigate dynamic markets with confidence.
Co-Author
Co-Author Profile
Aarti Dhapte LinkedIn
AVP - Research
A consulting professional focused on helping businesses navigate complex markets through structured research and strategic insights. I partner with clients to solve high-impact business problems across market entry strategy, competitive intelligence, and opportunity assessment. Over the course of my experience, I have led and contributed to 100+ market research and consulting engagements, delivering insights across multiple industries and geographies, and supporting strategic decisions linked to $500M+ market opportunities. My core expertise lies in building robust market sizing, forecasting, and commercial models (top-down and bottom-up), alongside deep-dive competitive and industry analysis. I have played a key role in shaping go-to-market strategies, investment cases, and growth roadmaps, enabling clients to make confident, data-backed decisions in dynamic markets.

Research Approach


Secondary Research

The secondary research process involved comprehensive analysis of regulatory databases, technical standards publications, industry whitepapers, and authoritative telecommunications organizations. Key sources included the International Telecommunication Union (ITU), Federal Communications Commission (FCC), European Telecommunications Standards Institute (ETSI), 3rd Generation Partnership Project (3GPP), GSM Association (GSMA), Institute of Electrical and Electronics Engineers (IEEE), Telecommunication Industry Association (TIA), National Institute of Standards and Technology (NIST), Organisation for Economic Co-operation and Development (OECD) Digital Economy Outlook, World Bank ICT Statistics, UNESCO Institute for Statistics (UIS), Eurostat Digital Economy and Society Statistics, Federal Trade Commission (FTC) telecommunications reports, National Telecommunications and Information Administration (NTIA), UK Office of Communications (Ofcom), Infocomm Media Development Authority (IMDA) of Singapore, Ministry of Industry and Information Technology (MIIT) of China, Telecom Regulatory Authority of India (TRAI), and Japan's Ministry of Internal Affairs and Communications (MIC). These sources were used to collect spectrum allocation data, infrastructure deployment statistics, 5G rollout metrics, regulatory compliance frameworks, broadband penetration rates, capital expenditure trends, and competitive landscape analysis for broadband access equipment, core networks, wireless infrastructure, wired infrastructure, software services, and managed services.


Primary Research

Qualitative and quantitative insights were obtained by interviewing supply-side and demand-side stakeholders during the primary research process. The supply-side sources consisted of CEOs, CTOs, VPs of Network Engineering, Chief Strategy Officers, regulatory affairs leaders, product development leads, and commercial directors from telecom equipment OEMs, component suppliers, and network infrastructure providers. Chief Information Officers, Chief Technology Officers, network operations heads, procurement directors from telecommunications service providers, mobile network operators, internet service providers, enterprise IT decision-makers from BFSI, retail, media, and defense sectors, and government ICT officials comprised demand-side sources.

Primary research validated market segmentation across broadband access, core networks, software services, and managed services; confirmed 5G deployment timelines and network modernization roadmaps; and gathered insights on procurement patterns, Open RAN adoption rates, fiber-optic expansion strategies, pricing dynamics, and spectrum licensing frameworks.

Primary Respondent Breakdown:

By Designation: C-level Primaries (32%), Director Level (35%), Others (33%)

By Region: North America (38%), Europe (30%), Asia-Pacific (25%), Rest of World (7%)


Market Size Estimation

Global market valuation was derived through equipment shipment tracking and infrastructure investment analysis. The methodology included:

Identification of 55+ key manufacturers and solution providers across North America, Europe, Asia-Pacific, and emerging markets

Product mapping across broadband access (DSL, PON, cable modems), core network equipment (routers, switches, optical transport), wireless infrastructure (base stations, antennas, small cells), wired infrastructure (fiber optics, Ethernet switches, microwave transmission), software services (OSS/BSS, network virtualization, SDN/NFV), and managed services (network outsourcing, cloud integration, security services)

Analysis of reported and modeled annual revenues specific to telecom equipment and network services portfolios

Coverage of manufacturers and service providers representing 75-80% of global market share in 2024

Extrapolation using bottom-up (equipment volume × ASP by product category and geography) and top-down (vendor revenue validation and operator CAPEX analysis) approaches to derive segment-specific valuations for wireless infrastructure, wired infrastructure, core networks, broadband access, software services, and managed services

Key Government & Regulatory Sources for Telecom Equipment Market:

Table

Copy

Category Sources

International Standards & Policy ITU, ETSI, 3GPP, IEEE, TIA, GSMA

US Regulatory FCC, NTIA, NIST, FTC, US Commerce Department

European Regulatory European Commission (Digital Single Market), BEREC, Ofcom (UK), Bundesnetzagentur (Germany), ARCEP (France)

Asia-Pacific Regulatory MIIT (China), TRAI (India), IMDA (Singapore), MIC (Japan), ACMA (Australia), KCC (South Korea)

Economic & Development Data World Bank ICT Indicators, OECD Digital Economy Outlook, UN ICT Statistics, Eurostat

Industry Associations CTIA (US), 5G Americas, ETNO (Europe), Telecoms Chamber (APAC)

This methodology ensures comprehensive coverage of the telecom equipment market's technical, regulatory, and commercial dimensions while maintaining consistency with your original format structure.

Download Free Sample

Kindly complete the form below to receive a free sample of this Report

Download PDF ×

We do not share your information with anyone. However, we may send you emails based on your report interest from time to time. You may contact us at any time to opt-out.

















