Threat Intelligence Market

Key Players: CrowdStrike, Recorded Future (Mastercard), Palo Alto Networks, IBM Security, Mandiant (Google Cloud), Anomali, Check Point Software, Cisco Systems

Threat Intelligence Market

Threat Intelligence Market Size, Share and Research Report By Component (Solutions, Services), By Deployment (On-Premise, Cloud, Hybrid), By Threat-Intelligence Type (Strategic, Tactical, Operational, Technical), By Organization Size (Large Enterprises, Small and Medium-Sized Enterprises), By End-User Industry (IT & Telecommunications, BFSI, Healthcare, Government & Defense, Retail & E-Commerce, Energy & Utilities, Others) and By Regional (North America, Europe, South America, Asia Pacific, Middle East and Africa) - Industry Forecast to 2035
ID: MRFR/ICT/2775-HCR
200 Pages
Aarti Dhapte
Last Updated: June 22, 2026

Threat Intelligence Market Summary

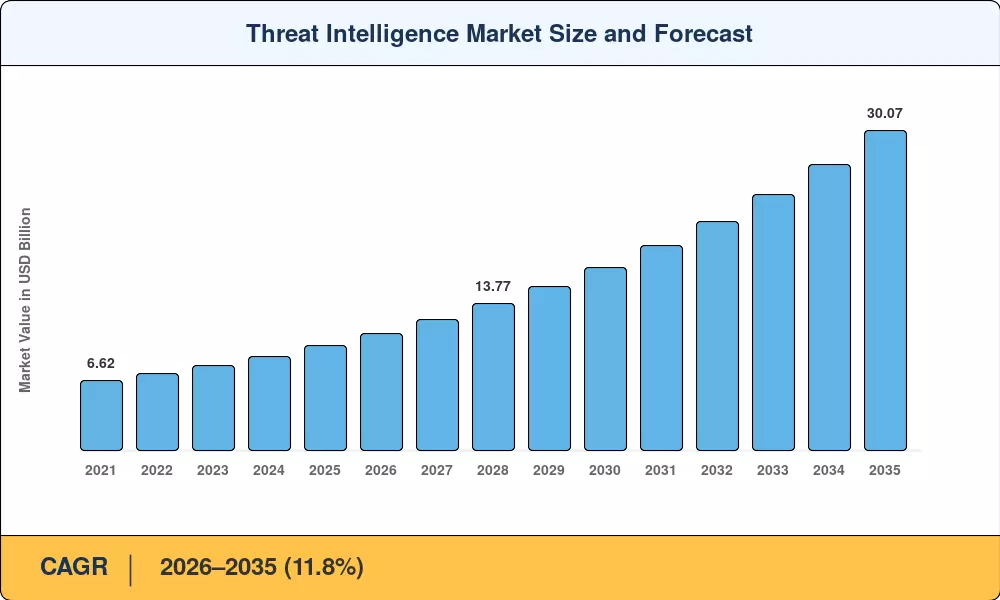
The 9 reached USD 9.86 billion in 2025 and is projected to climb to USD 30.07 billion by 2035, registering an 11.8% CAGR during 2026–2035. Two catalysts are powering this trajectory: the EU's NIS2 Directive, which compels roughly 160,000 entities across Europe to formalize intelligence-sharing programs [2], and the U.S. Securities and Exchange Commission's 2024 cyber-incident disclosure mandate, which pushed boardroom spending on proactive intelligence to record levels [7]. The Threat Intelligence Market is no longer a niche procurement line — it sits at the center of enterprise risk management.

AI-enhanced, context-aware intelligence solutions that can correlate indicators across cloud, endpoint, and operational-technology settings are replacing legacy signature-based protections. Global cybersecurity spending surpassed USD 215 billion in 2024 [12], and a growing share of that budget now flows toward intelligence functions that reduce mean-time-to-detect. Compared to peers who relied on ad hoc feeds, companies that implemented integrated intelligence platforms reduced breach costs by an average of USD 1.3 million [3].

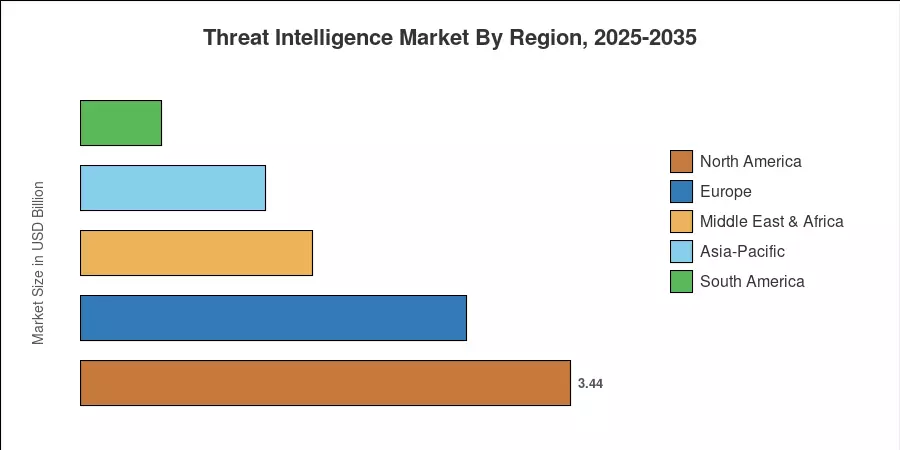
Due to a rich vendor ecosystem and federal mandates, North America has approximately 34.9% of the threat intelligence market. Due to NIS2 transposition spending, Europe comes in second at USD 2.71 billion in 2025. With a 16.5% CAGR, the Middle East and Africa area is the fastest-growing geography as Gulf states make significant investments in their own cyber-defense infrastructure. Through digital transformation initiatives in South Korea, Japan, and India, the Asia-Pacific region expands in size, indicating ten years of consistent demand.


Key Report Takeaways

• By Component & Deployment

  • Solutions accounted for 59.2% of the Threat Intelligence Market in 2025, reflecting enterprise demand for unified analytics consoles and automated enrichment engines.
  • Cloud deployment is expanding at a 17.5% CAGR through 2035 as organizations migrate from on-premise appliances to SaaS-delivered intelligence.
  • The Services segment is on track for a 15.1% CAGR, led by managed intelligence retainers and incident-response advisory engagements.

• By End-User

  • IT and Telecommunications captured 22.1% of the Threat Intelligence Market share in 2025, driven by carrier-grade visibility requirements.
  • BFSI is the fastest-growing end-user vertical at a 15.8% CAGR, propelled by fraud-intelligence convergence and cyber-insurance mandates.
  • Organization Size


  • Large enterprises held 62.5% of the market in 2025; SME adoption is accelerating at a 13.8% CAGR as managed-service bundles lower entry barriers.

• By Geography

  • North America dominated with 34.9% of global revenue in 2025.
  • The Middle East & Africa region leads growth at a 16.5% CAGR, fueled by Saudi Arabia's Vision 2030 cybersecurity directives.


Market Size and Forecast (2021–2035)

Market Research Future's sizing methodology triangulates vendor revenues, enterprise procurement surveys, and regulatory compliance spending trackers. Historical values (2021–2024) rely on audited annual filings and spending benchmarks [12], while the forecast period (2026–2035) applies a calibrated compound growth model validated against comparable industry assessments [19].

Threat Intelligence Market Size and Forecast
Our Impact
Enabled $4.3B Revenue Impact for Fortune 500 and Leading Multinationals
Partnering with 2000+ Global Organizations Each Year
30K+ Citations by Top-Tier Firms in the Industry

Driver Impact Analysis

Driver ~% Impact on CAGR Geographic Relevance Impact Timeline
Cloud migration & hybrid infrastructure growth ~18–22% Global Short-term (≤2 yr)
AI-powered adversarial tactics ~15–18% Global Medium-term (2–4 yr)
Regulatory mandates (NIS2, SEC disclosure) ~12–15% NA, Europe Short-term (≤2 yr)
Ransomware & nation-state escalation ~10–14% Global Long-term (≥4 yr)
Cyber-insurance intelligence requirements ~8–10% NA, Europe Medium-term (2–4 yr)
OT/IoT attack-surface expansion ~7–9% APAC, MEA Medium-term (2–4 yr)
MSSP-driven demand aggregation ~5–7% Global Long-term (≥4 yr)


Cloud Migration and Hybrid Infrastructure Growth

Enterprise workloads running in public or hybrid cloud environments exceeded 65% in 2024 [12], and each additional cloud provider an organization adopts multiplies the telemetry that must be correlated. The Threat Intelligence Market benefits directly because cloud-native architectures demand real-time feed ingestion, API-level enrichment, and cross-tenant detection logic that traditional on-premise tools cannot deliver at scale.


Regulatory Mandates

The NIS2 Directive requires critical-infrastructure operators across 27 EU member states to maintain structured risk management frameworks and submit an initial "early warning" within 24 hours of detecting a significant cyber incident [2]. In the United States, the SEC's cybersecurity disclosure rule (effective for annual reports ending on or after December 15, 2023) forces publicly listed firms to explicitly detail their processes for assessing, identifying, and managing material cyber threats under Item 106 of Form 10-K [7]. Together, these frameworks convert voluntary threat intelligence adoption and robust monitoring architecture into mandatory compliance obligations.


Ransomware and Nation-State Threat Escalation

Ransomware payments exceeded USD 1.1 billion globally in 2023 [4], and cryptocurrency laundering through decentralized mixers is funding increasingly sophisticated cartel operations. The Threat Intelligence Market captures this demand as organizations invest in dark web intelligence monitoring and early-warning feeds that track ransomware negotiation sites, leaked credentials, and extortion timelines.


Restraints Impact Analysis

Restraint ~% Impact on CAGR Geographic Relevance Impact Timeline
Cross-border data-sharing restrictions –3 to –5% Europe, APAC Long-term (≥4 yr)
Intelligence analyst talent shortage –2 to –4% Global Medium-term (2–4 yr)
Legacy SIEM/SOAR integration complexity –2 to –3% Global Short-term (≤2 yr)
False-positive fatigue & noise challenges –1 to –3% Global Medium-term (2–4 yr)
Public-sector budget constraints –1 to –2% SA, MEA Long-term (≥4 yr)


Cross-Border Data-Sharing Restrictions

GDPR Article 49 derogations, China's Data Security Law, and India's DPDP Act 2023 each impose jurisdictional controls on threat-indicator transfers. Security teams often receive incomplete feeds because indicator enrichment servers may not process personal data outside designated boundaries, degrading correlation quality for multinational deployments [2].

Intelligence Analyst Talent Shortage

The World Economic Forum estimated a shortfall of 4 million cybersecurity professionals worldwide in 2024, with threat-intelligence analyst roles among the hardest to fill [9]. Without trained personnel to contextualize machine-generated alerts, even the most sophisticated platforms produce limited operational value — a gap that automation can narrow but not fully close.

Legacy Integration Complexity

Many enterprises still operate decade-old SIEM deployments that lack native STIX/TAXII ingestion or bidirectional API support. The 2024 Wave assessment found that 38% of intelligence-platform buyers cited integration effort as the primary adoption barrier, extending average deployment timelines to nine months [11].


Threat Intelligence Market Opportunities

Managed Threat Intelligence for SMEs

Small and mid-sized enterprises represent 37.5% of the Threat Intelligence Market's addressable base yet remain under-penetrated. MSSP-bundled intelligence subscriptions — priced per seat rather than per feed — could unlock a segment growing at a 13.8% CAGR.

OT/ICS-Specific Intelligence Platforms

Industrial control systems in energy, water, and manufacturing face escalating targeting from state-sponsored groups. Vendors building sector-specific indicator libraries and protocol-aware analytics stand to capture a differentiated niche that general-purpose platforms overlook.

Cyber-Insurance Intelligence Integration

Insurers are increasingly conditioning underwriting and premium adjustments on real-time threat intelligence telemetry. Cyber risk platforms that produce machine-readable exposure and security scores consumable by actuarial models create a highly scalable, two-sided revenue opportunity: subscription-based monitoring software for the insured enterprise, and structural data-licensing fees from the insurance carriers underwriting the portfolios


Emerging-Market Digital Transformation

Rigid regulatory tailwinds across the Middle East and Asia-Pacific are creating greenfield opportunities for intelligence vendors willing to localize feeds and support regional languages. For instance, India's CERT-In framework strictly mandates that organizations report specified cybersecurity incidents within a tight six-hour window of detection. Concurrently, Saudi Arabia’s National Cybersecurity Authority (NCA) directives—coupled with Vision 2030 mega-projects—have driven the Kingdom's total domestic cybersecurity market past USD 2.4 billion, forcing critical infrastructure and private operators to deploy advanced telemetry architectures aggressively.

Intelligence-as-a-Service Monetization

Vendors packaging curated threat-hunting platforms with outcome-based pricing — charging per investigated alert rather than per data volume — are redefining the procurement model. This shift converts threat intelligence from a cost center into a measurable risk-reduction service, attracting CFO-level budget approval.


Threat Intelligence Market Future Outlook

AI-Autonomous Threat Detection and Response

By 2030, industry research from firms project that up to 60% of core Security Operations Center (SOC) workloads and alert triage tasks will shift to autonomous workflows powered by generative AI co-pilots and agentic security platforms. The Threat Intelligence Market will consequently pivot away from delivering legacy, raw indicator feeds, focusing instead on supplying decision-grade, context-rich intelligence packages that downstream AI automation engines can parse natively—compressing enterprise response windows from hours to seconds.

Platform Consolidation and XDR Convergence

Aggressive vendor consolidation is fundamentally reshaping the competitive landscape. Extended Detection and Response (XDR) and unified security operations platforms are rapidly absorbing standalone intelligence modules. General corporate strategy tracking from McKinsey indicates a massive shift from human-scale to machine-scale security architectures, with buyers looking to consolidate their distinct point solutions. This push could contract independent vendor landscapes by as much as 30% through 2030, delivering tighter platform integration but introducing distinct vendor-lock risks.


Geopolitical Intelligence and Supply-Chain Risk Mapping

Escalating technology decoupling between Western and Chinese ecosystems will increase demand for geopolitical-context intelligence that maps supplier dependencies, sanctions exposure, and intellectual-property exfiltration risk. Intelligence vendors with multilingual collection capabilities and diplomatic-source networks will command premium pricing.

Quantum Computing and Post-Quantum Cryptographic Readiness

The National Institute of Standards and Technology (NIST) finalized its first three foundational post-quantum cryptography (PQC) standards in August 2024, triggering an extensive migration clock that extends through 2035 under government mandates like CNSA 2.0. Threat intelligence platforms must evolve to track adversary quantum-capability timelines, actively flag "Harvest Now, Decrypt Later" exfiltration campaigns, and certify their own data-at-rest protections against quantum-scale computing threats—introducing a fundamentally new dimension to technical threat tracking.


Threat Intelligence Market Segmentation

By Component

Segment Key Metric Primary Demand Driver
Solutions 59.2% share (2025) Unified analytics platform demand
Services 15.1% CAGR (2026–2035) Managed intelligence retainers


Solutions remain the backbone of the Threat Intelligence Market, encompassing threat-intelligence platforms, indicator-management systems, and automated enrichment tools. Enterprises favor integrated suites that consolidate feed aggregation, scoring, and dissemination within a single console. The Services segment, covering managed intelligence subscriptions, advisory consulting, and intelligence-led penetration testing, is growing faster as resource-constrained organizations outsource specialized analytical functions.

By Deployment

Segment Key Metric Primary Demand Driver
On-Premise 50.4% share (2025) Data-sovereignty requirements
Cloud 17.5% CAGR (2026–2035) SaaS-first procurement policies
Hybrid USD 0.72 Billion (2025) Multi-environment correlation needs


On-premise deployments still lead in defense, government, and highly regulated banking environments where data residency rules prohibit external processing. Cloud-delivered intelligence, however, is catching up fast — its 17.5% CAGR reflects the advantages of elastic scaling, global feed distribution, and lower infrastructure overhead. Hybrid models bridge the gap, keeping sensitive enrichment on-premise while leveraging cloud-based collection and analytics.

By Threat-Intelligence Type

Segment Key Metric Primary Demand Driver
Strategic 36.0% share (2025) Board-level risk reporting
Tactical USD 1.87 Billion (2025) Firewall and IDS rule updates
Operational 15.0% CAGR (2026–2035) Campaign-tracking and attribution
Technical USD 1.42 Billion (2025) IOC feed integration


Strategic intelligence commands the largest revenue share because C-suite and board audiences increasingly demand geopolitical-context briefings that inform capital-allocation decisions. Operational intelligence, tracking at a 15.0% CAGR, is rising sharply as security teams prioritize campaign-level attribution and adversary-behavior profiling to preempt targeted attacks rather than reacting after compromise.

By Organization Size

Segment Key Metric Primary Demand Driver
Large Enterprises 62.5% share (2025) Dedicated SOC operations
Small and Medium-Sized Enterprises 13.8% CAGR (2026–2035) MSSP-bundled subscriptions


Large enterprises control the majority of spending because they maintain in-house SOC teams and custom intelligence workflows. The SME segment's accelerating CAGR reflects a structural shift: managed-security providers are packaging intelligence feeds into affordable per-seat subscriptions, removing the technical and financial barriers that previously excluded mid-market buyers from the Threat Intelligence Market.

By End-User Industry

Segment Key Metric Primary Demand Driver
IT & Telecommunications 22.1% share (2025) Carrier-grade network visibility
BFSI 15.8% CAGR (2026–2035) Fraud-intelligence convergence
Healthcare USD 1.18 Billion (2025) Patient-data protection mandates
Government & Defense 12.0% CAGR (2026–2035) National security directives
Retail & E-Commerce USD 0.67 Billion (2025) Payment-fraud mitigation
Energy & Utilities 13.4% CAGR (2026–2035) OT/SCADA threat monitoring


IT and Telecommunications firms account for the largest vertical share because they operate expansive networks that serve as both targets and conduits for threat propagation. BFSI is the fastest-growing vertical within the Threat Intelligence Market, driven by regulatory expectations around real-time fraud intelligence, anti-money-laundering integration, and insurer requirements that tie coverage to demonstrated threat-visibility capabilities.


Regional Market Share Analysis

Region Key Metric Primary Investment Themes
North America 34.9% share (2025) Federal mandates, cyber-insurance adoption
Europe USD 2.71 Billion (2025) NIS2 compliance, GDPR-driven intelligence sharing
Asia-Pacific 13.2% CAGR (2026–2035) Digital transformation, telecom-sector demand
South America USD 0.57 Billion (2025) Financial-sector fraud intelligence
Middle East & Africa 16.5% CAGR (2026–2035) National cybersecurity strategies, oil & gas protection
Total USD 9.86 Billion (2025)

The Threat Intelligence Market spans five core regions, each shaped by distinct regulatory environments, threat profiles, and maturity levels. North America leads on absolute spend; the Middle East & Africa region registers the fastest expansion.


North America

Country Key Metric Key Driver
United States 82.1% of regional share Federal civilian & DoD intelligence budgets
Canada 11.5% CAGR Critical Infrastructure Protection Act
Mexico USD 0.14 Billion (2025) Banking-sector regulatory modernization


The United States accounts for the vast majority of North American spending, propelled by CISA's Cybersecurity Performance Goals and a USD 13 billion federal cyber budget in fiscal 2025 [7]. Canada's Critical Cyber Systems Protection Act, effective in 2024, mirrors NIS2's reporting timelines and drives procurement among energy and transportation operators.

Europe

Country Key Metric Key Driver
Germany 24.3% of regional share BSI IT-Security Act 2.0
United Kingdom 21.8% of regional share National Cyber Strategy 2022–2030
France USD 0.38 Billion (2025) ANSSI certification mandates
Italy 10.9% CAGR National Cybersecurity Agency launches
Spain USD 0.19 Billion (2025) Banking-sector DORA compliance
Nordic Countries 12.4% CAGR Defense and critical-infrastructure programs
Russia USD 0.11 Billion (2025) Domestic platform substitution
Rest of Europe 14.2% of regional share EU-wide NIS2 transposition


NIS2 transposition deadlines have triggered a compliance surge across the continent, with Germany and the UK jointly representing nearly half of Europe's intelligence spend. France's ANSSI now requires intelligence-capability certifications for critical-infrastructure operators, adding a procurement layer that favors established platform vendors [2].

Asia-Pacific

Country Key Metric Key Driver
China 31.5% of regional share Cybersecurity Law enforcement
India 14.6% CAGR CERT-In six-hour reporting mandate
Japan USD 0.43 Billion (2025) Defense modernization under the 2022 NSS
South Korea 13.1% CAGR K-Cyber Shield initiative
ASEAN USD 0.26 Billion (2025) Cross-border financial crime intelligence
Rest of Asia-Pacific 11.8% of regional share Telecom-sector expansion


India's CERT-In directive requiring six-hour breach notification has made intelligence automation a necessity rather than a luxury. Japan's revised National Security Strategy earmarked JPY 1 trillion for cyber-defense modernization through 2027, positioning the Threat Intelligence Market for sustained procurement cycles in Northeast Asia [16].

South America

Country Key Metric Key Driver
Brazil 58.6% of regional share Central Bank Resolution 4,893
Argentina 12.3% CAGR Fintech regulation expansion
Rest of South America USD 0.12 Billion (2025) Utility-sector digitization


Brazil dominates the region, where Central Bank Resolution 4,893 mandates cybersecurity risk programs for all regulated financial institutions. Argentina's fintech boom is creating new intelligence procurement channels, although limited local vendor presence means multinational platforms capture most contracts.

Middle East & Africa

Country Key Metric Key Driver
Saudi Arabia 28.4% of regional share NCA cybersecurity mandates
UAE 15.7% CAGR Smart-city and critical-infrastructure programs
South Africa USD 0.09 Billion (2025) Financial-sector regulation (POPIA)
Egypt 14.8% CAGR National telecom cybersecurity directive
Rest of MEA 23.1% of regional share Oil & gas sector defense spending


Saudi Arabia's National Cybersecurity Authority issued binding intelligence-sharing frameworks in 2024, driving double-digit procurement growth across government and energy verticals [20]. The UAE's investment in smart-city infrastructure — including Abu Dhabi's Falcon Eye program — creates adjacent demand for intelligence platforms that monitor IoT and SCADA threat surfaces.


Threat Intelligence Market By Region, 2025-2035

Competitive Benchmarking

The Threat Intelligence Market exhibits medium concentration, with the top five vendors capturing an estimated 35–42% of global revenue. The Herfindahl-Hirschman Index sits in the moderately competitive range, indicating that while large platform vendors set pricing benchmarks, specialist providers maintain relevance in sector-specific and regional niches. Consolidation accelerated in 2024–2025, headlined by Mastercard's USD 2.65 billion acquisition of Recorded Future [13].

Company Est. Revenue Share Range Key Offerings Strategic Positioning
CrowdStrike ~8–11% Falcon Intelligence, Recon, OverWatch AI-native endpoint-to-cloud intelligence platform
Recorded Future (Mastercard) ~7–10% Intelligence Cloud, Brand Intelligence Largest independent intelligence graph; payments-sector synergy
Palo Alto Networks ~6–9% Cortex XSIAM, Unit 42, AutoFocus XDR-integrated intelligence with consulting arm
IBM Security ~5–8% X-Force Threat Intelligence Index, QRadar Enterprise-grade intelligence tied to SIEM/SOAR stack
Mandiant (Google Cloud) ~5–7% Mandiant Advantage, Chronicle Incident-response pedigree with hyperscaler distribution
Anomali ~3–5% ThreatStream, Match, Lens STIX/TAXII-native platform with government focus
Check Point Software ~3–5% ThreatCloud AI, Infinity Platform Firewall-adjacent intelligence with broad SME reach
Cisco Systems ~3–5% Talos Intelligence, SecureX Network-layer telemetry and ISP-grade feed collection
ThreatConnect ~2–4% TIP, Intelligence-Driven Defense Orchestration-centric platform for mature SOC teams
Fortinet ~2–4% FortiGuard Labs, FortiRecon Integrated intelligence within security-fabric architecture


Recent News & Developments


  • SecurityScorecard (May 2026)--Acquired British internet scanning and threat intelligence startup Driftnet to expand its global threat tracking, vulnerability monitoring, and external exposure capabilities.
  • Cisco (May 2026)--Announced intent to acquire Astrix Security for $400 million, integrating its identity tools into Splunk to track autonomous AI threat actors.
  • KELA (June 2025)--Partnered with Sysmex to deploy its continuous threat exposure platform, ULTRA RED, improving real-time visibility and incident response capabilities across IT assets.


Threat Intelligence Market Report Scope

Parameter Detail
Market Scope Global Threat Intelligence Market — solutions, services, and managed intelligence.
Study Period 2021–2035
CAGR Window 2026–2035 (11.8%)
Base-Year Market Size USD 9.86 Billion (2025)
Forecast Endpoint USD 30.07 Billion (2035)
Fastest Growing Segment Cloud deployment (17.5% CAGR); Middle East & Africa (16.5% CAGR)
Companies Profiled 10+ (CrowdStrike, Recorded Future, Palo Alto Networks, IBM, Mandiant, and others)
Valuation Currency USD Billion


FAQs

How does the Threat Intelligence Market address alert fatigue inside SOC operations?

Modern platforms use AI-based triage to score and correlate alerts before they reach analysts, cutting actionable alert volume by up to 70% [1]. This reduces burnout and accelerates mean-time-to-respond.

What integration standards should procurement teams evaluate in the Threat Intelligence Market?

Buyers should prioritize STIX 2.1 and TAXII 2.0 compatibility, which ensures bidirectional feed exchange with most SIEM, SOAR, and XDR platforms [17]. Native API connectors further reduce deployment friction.

How is the Threat Intelligence Market influencing cyber-insurance underwriting?

Insurers now request live intelligence telemetry as part of policy applications, linking premium pricing to demonstrated detection maturity [6]. Platforms producing machine-readable risk scores gain dual-revenue exposure.

What role do managed security service providers play in intelligence distribution?

MSSPs aggregate multi-vendor feeds and deliver curated intelligence to resource-constrained organizations on per-seat pricing models [11]. This channel is the primary SME on-ramp.

How do open-source intelligence feeds compare to commercial platforms for mid-market buyers?

Open-source feeds provide baseline indicator coverage but lack curation, scoring, and SLA-backed freshness guarantees [8]. Commercial platforms justify their premium through contextual enrichment and dedicated analyst support.

What staffing considerations apply when operationalizing threat intelligence?

Organizations typically need at least two dedicated intelligence analysts per SOC shift to contextualize automated outputs [9]. Without trained staff, even premium platforms generate limited operational value.

How does geopolitical instability shape vendor-selection decisions in the Threat Intelligence Market?

Buyers in contested regions increasingly favor vendors with multilingual collection networks and local data-residency options [10]. Geopolitical context capability is now a top-five evaluation criterion.    
Author
Author
Author Profile
Aarti Dhapte LinkedIn
AVP - Research
A consulting professional focused on helping businesses navigate complex markets through structured research and strategic insights. I partner with clients to solve high-impact business problems across market entry strategy, competitive intelligence, and opportunity assessment. Over the course of my experience, I have led and contributed to 100+ market research and consulting engagements, delivering insights across multiple industries and geographies, and supporting strategic decisions linked to $500M+ market opportunities. My core expertise lies in building robust market sizing, forecasting, and commercial models (top-down and bottom-up), alongside deep-dive competitive and industry analysis. I have played a key role in shaping go-to-market strategies, investment cases, and growth roadmaps, enabling clients to make confident, data-backed decisions in dynamic markets.

Research Approach


Secondary Research

The secondary research process involved comprehensive analysis of regulatory databases, cybersecurity frameworks, peer-reviewed journals, industry security reports, and authoritative technology organizations. Key sources included the Cybersecurity and Infrastructure Security Agency (CISA), National Institute of Standards and Technology (NIST), European Union Agency for Cybersecurity (ENISA), UK National Cyber Security Centre (NCSC), Australian Cyber Security Centre (ACSC), MITRE Corporation (ATT&CK Framework), ISO/IEC 27001 Standards Body, FIRST (Forum of Incident Response and Security Teams), SANS Institute, Center for Internet Security (CIS), Cloud Security Alliance (CSA), Internet Crime Complaint Center (IC3), European Cybersecurity Agency Reports, World Economic Forum (WEF) Global Cybersecurity Outlook, European Union Cybersecurity Act Databases, and national cyber defense agency reports from key markets.

Threat landscape statistics, regulatory compliance data (GDPR, HIPAA, PCI-DSS, NIS2 Directive), security incident reports, malware trend analyses, and technology adoption patterns across the Cloud Security, Network Security, Endpoint Security, and Application Security domains were gathered using these sources.


Primary Research

Qualitative and quantitative insights were obtained by interviewing supply-side and demand-side stakeholders during the primary research process. The supply-side sources consist of CEOs, CTOs, CISOs, VPs of Product Development, Heads of Threat Research, Chief Product Officers, and commercial directors from cybersecurity service providers, managed security service providers (MSSPs), and threat intelligence platform vendors. The demand-side sources consisted of Chief Information Security Officers, SOC Managers, Threat Intelligence Analysts, Security Operations Directors, and Cybersecurity Procurement Leads from BFSI institutions, government defense agencies, healthcare organizations, IT & telecommunications operators, and retail enterprises. Market segmentation was validated across Solutions, Services, and Platforms through primary research. AI/ML integration roadmaps were confirmed, and insights were garnered on the dynamics of MSSP partnership dynamics, cloud versus on-premises deployment preferences, pricing strategies, and threat intelligence feed adoption patterns.

Primary Respondent Breakdown:

By Designation: C-level Primaries (32%), Director Level (31%), Others (37%)

By Region: North America (32%), Europe (30%), Asia-Pacific (28%), Rest of World (10%)


Market Size Estimation

Revenue mapping and enterprise adoption analysis were employed to determine the global market valuation, which encompassed the projected value chain from USD 8.06 Billion (2024) to USD 30 Billion (2035). The methodology comprised the following:

The identification of over 45 significant threat intelligence vendors and solution providers in North America, Europe, Asia-Pacific, and Latin America, including IBM, CrowdStrike, Palo Alto Networks, Fortinet, Recorded Future, ThreatConnect, BAE Systems, and emerging AI-native platforms.

Product mapping across Platforms (TIPS, SOAR integration), Services (managed threat intelligence, consulting), and Solutions (threat feeds, threat intelligence platforms)

Cloud-based (projected to reach USD 12 billion by 2035), on-premises, and hybrid architectures are differentiated in the deployment model analysis.

Revenue modeling that is specific to the BFSI, Government, Healthcare, IT & Telecom, and Retail sectors

Analysis of annual revenues specific to threat intelligence portfolios, which encompasses vendors that account for 70-75% of the global market share in 2024, as reported and modeled.

Derive segment-specific valuations by Component, Deployment Model, Application, and End-Use Industry through extrapolation using bottom-up (enterprise count × threat intelligence adoption rate × average spend by company size and vertical) and top-down (vendor revenue validation and MSSP service revenue triangulation) approaches.

Download Free Sample

Kindly complete the form below to receive a free sample of this Report

Download PDF ×

We do not share your information with anyone. However, we may send you emails based on your report interest from time to time. You may contact us at any time to opt-out.