Segmentation Quick Reference
| Dimension | Sub-Segments | Dominant Segment | Fastest Growing Segment |
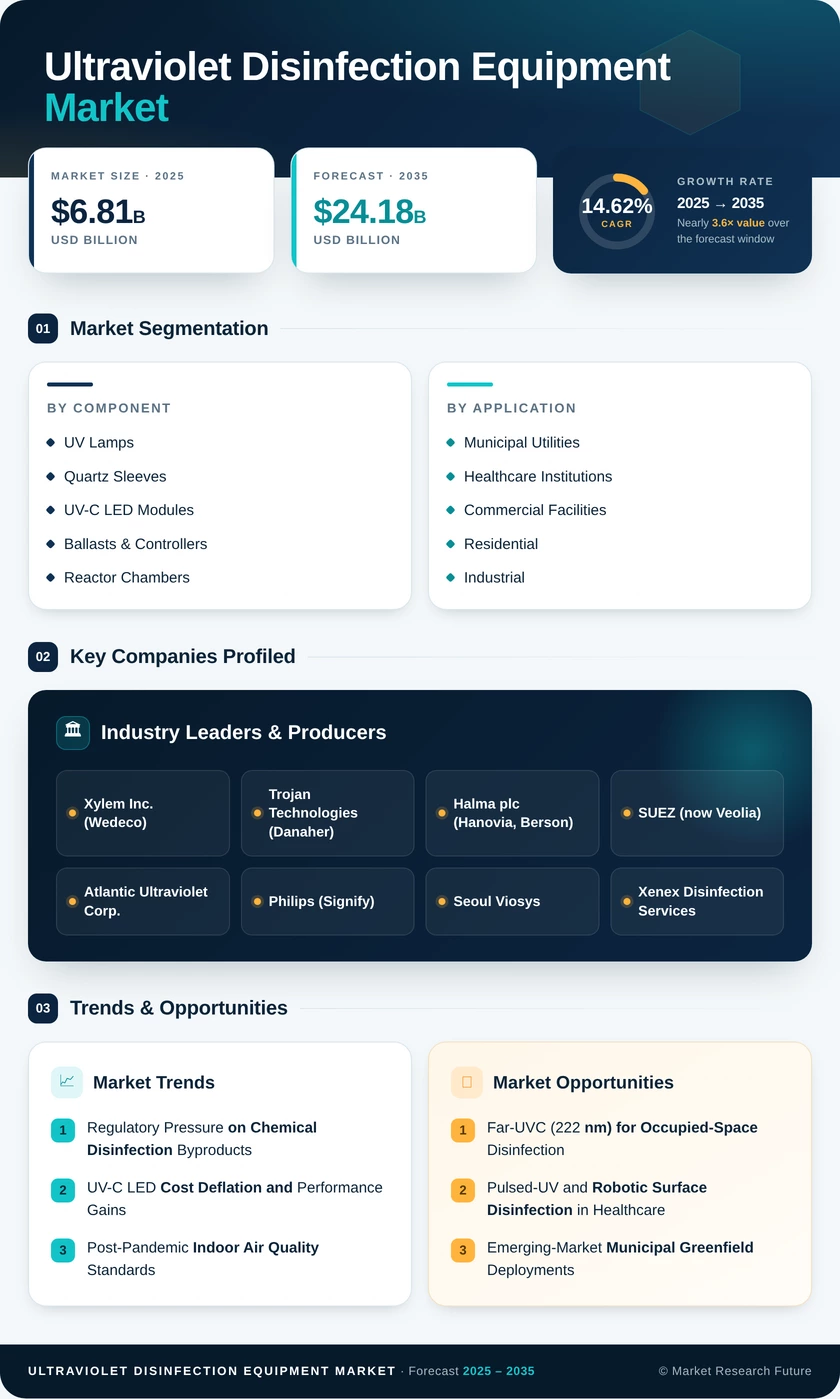
| Component | UV Lamps, Quartz Sleeves, UV-C LED Modules, Ballasts & Controllers, Reactor Chambers | UV Lamps | UV-C LED Modules |
| Application | Water & Wastewater, Air Disinfection, Surface Disinfection, Food & Beverage Processing, Ultraviolet Disinfection Equipment Market & Biotech | Water & Wastewater | Air Disinfection |
| End User | Municipal Utilities, Healthcare Institutions, Commercial Facilities, Residential, Industrial | Municipal Utilities | Residential |
| Power Rating | Low-Power (<10 kW), Medium-Power (10–999 kW), High-Power (≥1,000 kW) | Medium-Power | Low-Power |
| Wavelength Type | UV-A, UV-B, UV-C, Vacuum-UV | UV-C | Vacuum-UV |
| Mobility | Fixed Systems, Portable Systems | Fixed Systems | Portable Systems |
Market Segmentation Overview
By Component
| Sub-Segment | Key Trend |
| UV Lamps | Ongoing aftermarket replacement demand from 350,000+ installed amalgam and low-pressure reactors globally |
| Quartz Sleeves | Premium-grade fused-silica sleeves gaining share due to higher UV transmittance and longer service life |
| UV-C LED Modules | Rapid cost deflation and miniaturization enabling point-of-use residential and portable applications |
| Ballasts & Controllers | Smart-ballast platforms integrating IoT dose sensors for real-time compliance monitoring |
| Reactor Chambers | Larger-diameter stainless-steel chambers being specified for high-flow municipal plants |
UV Lamps remain the revenue anchor due to the sheer scale of the global installed base, while UV-C LED Modules are reshaping the competitive landscape with every successive generation of higher-efficiency chips.
By Application
| Sub-Segment | Key Trend |
| Water & Wastewater | EPA PFAS and EU DBP regulations driving accelerated municipal UV reactor procurement |
| Air Disinfection | ASHRAE 241 and local building codes mandating UV-C in commercial HVAC systems |
| Surface Disinfection | Pulsed-UV robotic platforms expanding from acute-care hospitals to ambulatory and long-term care settings |
| Food & Beverage Processing | FDA FSMA produce-safety rule increasing UV adoption for fresh-cut produce and juice processing lines |
| Ultraviolet Disinfection Equipment Market & Biotech | USP <1229.7> validation guidelines standardizing UV use in cleanroom and water-for-injection systems |
Water & Wastewater dominates by absolute value, but Air Disinfection is closing the gap as post-pandemic indoor-air-quality standards become codified into building regulations worldwide.
By End User
| Sub-Segment | Key Trend |
| Municipal Utilities | Largest single buyer category, driven by regulatory compliance timelines and population-growth pressures |
| Healthcare Institutions | Pulsed-UV robots and HVAC-integrated UV gaining budget priority as HAI penalties increase |
| Commercial Facilities | LEED v5 and WELL v3 IEQ credits incentivizing landlords to retrofit in-duct UV systems |
| Residential | Affordable UV-C LED point-of-entry units entering retail channels, driven by consumer health awareness |
| Industrial | Semiconductor ultra-pure water and pharmaceutical process water requiring validated UV treatment stages |
Municipal Utilities set the volume baseline, while the Residential segment — starting from a smaller base — is compounding fastest as consumer-grade UV-C LED products reach price parity with conventional filtration systems.
By Power Rating
| Sub-Segment | Key Trend |
| Low-Power (<10 kW) | Point-of-use and small commercial systems benefiting most from LED cost deflation |
| Medium-Power (10–999 kW) | Workhorse segment for mid-size municipal and industrial UV reactors |
| High-Power (≥1,000 kW) | Large-scale municipal and industrial installations serving populations above 500,000 |
Medium-Power units form the largest revenue pool, serving the bulk of mid-capacity municipal and industrial plants worldwide.
By Wavelength Type
| Sub-Segment | Key Trend |
| UV-A | Limited disinfection application; primarily used in photocatalytic and curing processes |
| UV-B | Niche applications in medical phototherapy and horticultural pest management |
| UV-C | Dominant germicidal wavelength (254 nm LP-Hg, 265 nm LED) for water, air, and surface disinfection |
| Vacuum-UV | Emerging for advanced oxidation processes and TOC reduction in ultra-pure water |
UV-C holds the overwhelming majority of market share due to its proven germicidal efficacy, while Vacuum-UV is the fastest-growing wavelength segment as advanced oxidation applications expand.
By Mobility
| Sub-Segment | Key Trend |
| Fixed Systems | Permanent reactor installations in treatment plants, HVAC ducts, and cleanrooms |
| Portable Systems | Mobile UV towers and robotic units for healthcare terminal cleaning and emergency response |
Fixed Systems dominate revenue due to the scale of infrastructure-embedded UV installations, but Portable Systems are the growth leader as hospitals and disaster-response agencies expand mobile UV fleets.