US Benzalkonium Chloride Market

ID: MRFR/CnM/16870-HCR
100 Pages
Garvit Vyas
Last Updated: April 06, 2026
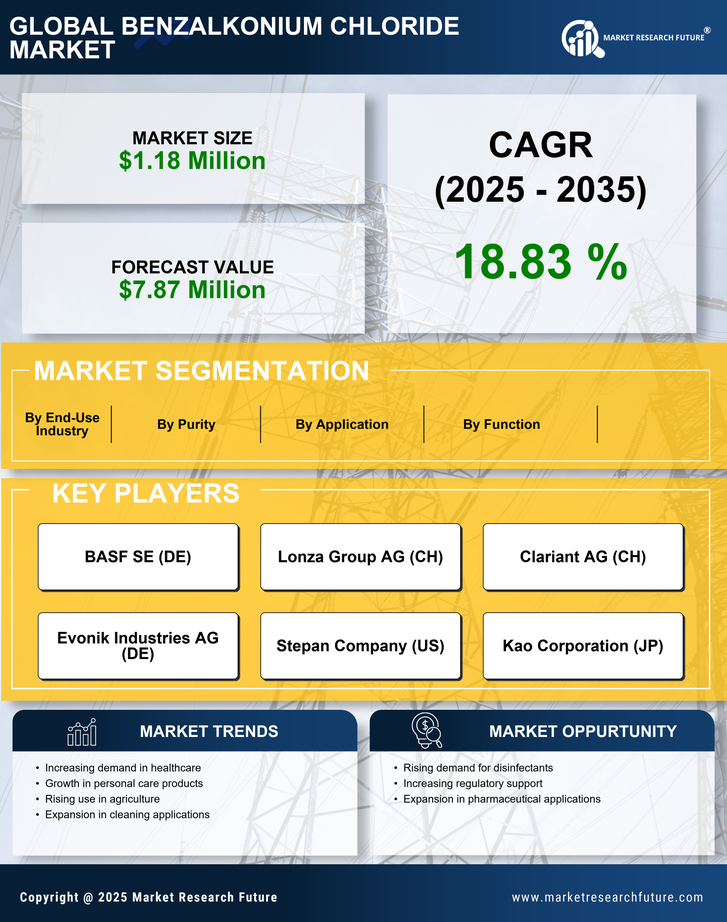
US Benzalkonium Chloride Market Research Report By Concentration (50%, 80%, Others), By Function (Biocide, Cationic Surfactant, Preservative, Phase Transfer Agent), By Application (Corrosion Inhibition, Pharmaceutical Formulations, Enhanced Oil Extraction, Formulation of Cleaner Sanitizers, Water Treatment, Timber Protection, Others), By End-Use Industry (Pharmaceuticals, Oil & Gas, Personal Care & Cosmetics, Chemicals, Pulp & Paper, Food & Beverage, Textile, Plastics & Polymer, Others) – Forecast to 2035
Download PDF ×

We do not share your information with anyone. However, we may send you emails based on your report interest from time to time. You may contact us at any time to opt-out.

  1. 1 SECTION I: EXECUTIVE SUMMARY AND KEY HIGHLIGHTS
    1. 1.1 EXECUTIVE SUMMARY
      1. 1.1.1 Market Overview
      2. 1.1.2 Key Findings
      3. 1.1.3 Market Segmentation
      4. 1.1.4 Competitive Landscape
      5. 1.1.5 Challenges and Opportunities
      6. 1.1.6 Future Outlook
  2. 2 SECTION II: SCOPING, METHODOLOGY AND MARKET STRUCTURE
    1. 2.1 MARKET INTRODUCTION
      1. 2.1.1 Definition
      2. 2.1.2 Scope of the study
        1. 2.1.2.1 Research Objective
        2. 2.1.2.2 Assumption
        3. 2.1.2.3 Limitations
    2. 2.2 RESEARCH METHODOLOGY
      1. 2.2.1 Overview
      2. 2.2.2 Data Mining
      3. 2.2.3 Secondary Research
      4. 2.2.4 Primary Research
        1. 2.2.4.1 Primary Interviews and Information Gathering Process
        2. 2.2.4.2 Breakdown of Primary Respondents
      5. 2.2.5 Forecasting Model
      6. 2.2.6 Market Size Estimation
        1. 2.2.6.1 Bottom-Up Approach
        2. 2.2.6.2 Top-Down Approach
      7. 2.2.7 Data Triangulation
      8. 2.2.8 Validation
  3. 3 SECTION III: QUALITATIVE ANALYSIS
    1. 3.1 MARKET DYNAMICS
      1. 3.1.1 Overview
      2. 3.1.2 Drivers
      3. 3.1.3 Restraints
      4. 3.1.4 Opportunities
    2. 3.2 MARKET FACTOR ANALYSIS
      1. 3.2.1 Value chain Analysis
      2. 3.2.2 Porter's Five Forces Analysis
        1. 3.2.2.1 Bargaining Power of Suppliers
        2. 3.2.2.2 Bargaining Power of Buyers
        3. 3.2.2.3 Threat of New Entrants
        4. 3.2.2.4 Threat of Substitutes
        5. 3.2.2.5 Intensity of Rivalry
      3. 3.2.3 COVID-19 Impact Analysis
        1. 3.2.3.1 Market Impact Analysis
        2. 3.2.3.2 Regional Impact
        3. 3.2.3.3 Opportunity and Threat Analysis
  4. 4 SECTION IV: QUANTITATIVE ANALYSIS
    1. 4.1 Food, Beverages & Nutrition, BY Purity (USD Million)
      1. 4.1.1 50%
      2. 4.1.2 80%
      3. 4.1.3 Others
    2. 4.2 Food, Beverages & Nutrition, BY Function (USD Million)
      1. 4.2.1 Biocide
      2. 4.2.2 Cationic Surfactant
      3. 4.2.3 Preservative
      4. 4.2.4 Phase Transfer Agent
    3. 4.3 Food, Beverages & Nutrition, BY Application (USD Million)
      1. 4.3.1 Corrosion Inhibition
      2. 4.3.2 Pharmaceutical Formulations
      3. 4.3.3 Enhanced Oil Extraction
      4. 4.3.4 Formulation of Cleaner Sanitizers
      5. 4.3.5 Water Treatment
      6. 4.3.6 Timber Protection
      7. 4.3.7 Others
    4. 4.4 Food, Beverages & Nutrition, BY End-Use Industry (USD Million)
      1. 4.4.1 Pharmaceuticals
      2. 4.4.2 Oil & Gas
      3. 4.4.3 Personal Care & Cosmetics
      4. 4.4.4 Chemicals
      5. 4.4.5 Pulp & Paper
      6. 4.4.6 Food & Beverage
      7. 4.4.7 Textile
      8. 4.4.8 Plastics & Polymer
      9. 4.4.9 Others
  5. 5 SECTION V: COMPETITIVE ANALYSIS
    1. 5.1 Competitive Landscape
      1. 5.1.1 Overview
      2. 5.1.2 Competitive Analysis
      3. 5.1.3 Market share Analysis
      4. 5.1.4 Major Growth Strategy in the Food, Beverages & Nutrition
      5. 5.1.5 Competitive Benchmarking
      6. 5.1.6 Leading Players in Terms of Number of Developments in the Food, Beverages & Nutrition
      7. 5.1.7 Key developments and growth strategies
        1. 5.1.7.1 New Product Launch/Service Deployment
        2. 5.1.7.2 Merger & Acquisitions
        3. 5.1.7.3 Joint Ventures
      8. 5.1.8 Major Players Financial Matrix
        1. 5.1.8.1 Sales and Operating Income
        2. 5.1.8.2 Major Players R&D Expenditure. 2023
    2. 5.2 Company Profiles
      1. 5.2.1 BASF SE (DE)
        1. 5.2.1.1 Financial Overview
        2. 5.2.1.2 Products Offered
        3. 5.2.1.3 Key Developments
        4. 5.2.1.4 SWOT Analysis
        5. 5.2.1.5 Key Strategies
      2. 5.2.2 Lonza Group AG (CH)
        1. 5.2.2.1 Financial Overview
        2. 5.2.2.2 Products Offered
        3. 5.2.2.3 Key Developments
        4. 5.2.2.4 SWOT Analysis
        5. 5.2.2.5 Key Strategies
      3. 5.2.3 Clariant AG (CH)
        1. 5.2.3.1 Financial Overview
        2. 5.2.3.2 Products Offered
        3. 5.2.3.3 Key Developments
        4. 5.2.3.4 SWOT Analysis
        5. 5.2.3.5 Key Strategies
      4. 5.2.4 Evonik Industries AG (DE)
        1. 5.2.4.1 Financial Overview
        2. 5.2.4.2 Products Offered
        3. 5.2.4.3 Key Developments
        4. 5.2.4.4 SWOT Analysis
        5. 5.2.4.5 Key Strategies
      5. 5.2.5 Stepan Company (US)
        1. 5.2.5.1 Financial Overview
        2. 5.2.5.2 Products Offered
        3. 5.2.5.3 Key Developments
        4. 5.2.5.4 SWOT Analysis
        5. 5.2.5.5 Key Strategies
      6. 5.2.6 Kao Corporation (JP)
        1. 5.2.6.1 Financial Overview
        2. 5.2.6.2 Products Offered
        3. 5.2.6.3 Key Developments
        4. 5.2.6.4 SWOT Analysis
        5. 5.2.6.5 Key Strategies
      7. 5.2.7 Solvay SA (BE)
        1. 5.2.7.1 Financial Overview
        2. 5.2.7.2 Products Offered
        3. 5.2.7.3 Key Developments
        4. 5.2.7.4 SWOT Analysis
        5. 5.2.7.5 Key Strategies
      8. 5.2.8 Huntsman Corporation (US)
        1. 5.2.8.1 Financial Overview
        2. 5.2.8.2 Products Offered
        3. 5.2.8.3 Key Developments
        4. 5.2.8.4 SWOT Analysis
        5. 5.2.8.5 Key Strategies
      9. 5.2.9 Albemarle Corporation (US)
        1. 5.2.9.1 Financial Overview
        2. 5.2.9.2 Products Offered
        3. 5.2.9.3 Key Developments
        4. 5.2.9.4 SWOT Analysis
        5. 5.2.9.5 Key Strategies
    3. 5.3 Appendix
      1. 5.3.1 References
      2. 5.3.2 Related Reports
  6. 6 LIST OF FIGURES
    1. 6.1 MARKET SYNOPSIS
    2. 6.2 US MARKET ANALYSIS BY PURITY
    3. 6.3 US MARKET ANALYSIS BY FUNCTION
    4. 6.4 US MARKET ANALYSIS BY APPLICATION
    5. 6.5 US MARKET ANALYSIS BY END-USE INDUSTRY
    6. 6.6 KEY BUYING CRITERIA OF FOOD, BEVERAGES & NUTRITION
    7. 6.7 RESEARCH PROCESS OF MRFR
    8. 6.8 DRO ANALYSIS OF FOOD, BEVERAGES & NUTRITION
    9. 6.9 DRIVERS IMPACT ANALYSIS: FOOD, BEVERAGES & NUTRITION
    10. 6.10 RESTRAINTS IMPACT ANALYSIS: FOOD, BEVERAGES & NUTRITION
    11. 6.11 SUPPLY / VALUE CHAIN: FOOD, BEVERAGES & NUTRITION
    12. 6.12 FOOD, BEVERAGES & NUTRITION, BY PURITY, 2024 (% SHARE)
    13. 6.13 FOOD, BEVERAGES & NUTRITION, BY PURITY, 2024 TO 2035 (USD Million)
    14. 6.14 FOOD, BEVERAGES & NUTRITION, BY FUNCTION, 2024 (% SHARE)
    15. 6.15 FOOD, BEVERAGES & NUTRITION, BY FUNCTION, 2024 TO 2035 (USD Million)
    16. 6.16 FOOD, BEVERAGES & NUTRITION, BY APPLICATION, 2024 (% SHARE)
    17. 6.17 FOOD, BEVERAGES & NUTRITION, BY APPLICATION, 2024 TO 2035 (USD Million)
    18. 6.18 FOOD, BEVERAGES & NUTRITION, BY END-USE INDUSTRY, 2024 (% SHARE)
    19. 6.19 FOOD, BEVERAGES & NUTRITION, BY END-USE INDUSTRY, 2024 TO 2035 (USD Million)
    20. 6.20 BENCHMARKING OF MAJOR COMPETITORS
  7. 7 LIST OF TABLES
    1. 7.1 LIST OF ASSUMPTIONS
  8. 7.1.1
    1. 7.2 US MARKET SIZE ESTIMATES; FORECAST
      1. 7.2.1 BY PURITY, 2025-2035 (USD Million)
      2. 7.2.2 BY FUNCTION, 2025-2035 (USD Million)
      3. 7.2.3 BY APPLICATION, 2025-2035 (USD Million)
      4. 7.2.4 BY END-USE INDUSTRY, 2025-2035 (USD Million)
    2. 7.3 PRODUCT LAUNCH/PRODUCT DEVELOPMENT/APPROVAL
  9. 7.3.1
    1. 7.4 ACQUISITION/PARTNERSHIP
  10. 7.4.1

US Food, Beverages & Nutrition Market Segmentation

Food, Beverages & Nutrition By Purity (USD Million, 2025-2035)

  • 50%
  • 80%
  • Others

Food, Beverages & Nutrition By Function (USD Million, 2025-2035)

  • Biocide
  • Cationic Surfactant
  • Preservative
  • Phase Transfer Agent

Food, Beverages & Nutrition By Application (USD Million, 2025-2035)

  • Corrosion Inhibition
  • Pharmaceutical Formulations
  • Enhanced Oil Extraction
  • Formulation of Cleaner Sanitizers
  • Water Treatment
  • Timber Protection
  • Others

Food, Beverages & Nutrition By End-Use Industry (USD Million, 2025-2035)

  • Pharmaceuticals
  • Oil & Gas
  • Personal Care & Cosmetics
  • Chemicals
  • Pulp & Paper
  • Food & Beverage
  • Textile
  • Plastics & Polymer
  • Others