Ferric Chloride Market

Key Players: Kemira Oyj, BASF SE, Tessenderlo Group, PVS Chemicals, Chemtrade Logistics, Pencco Inc., Gulbrandsen Technologies, SIDRA Wasserchemie

Ferric Chloride Market

Ferric Chloride Market Research Report Information By Grade (Anhydrous, Ferric Chloride Hexahydrate Lumps, and Ferric Chloride Liquid), By Application (Wastewater Treatment, Metal Surface Treatment, Potable Water Treatment, Electronic Etchants, Printed Circuit Boards, Pigment Manufacturing, Catalyst, Asphalt Blowing), By End-Use Industry (Pharmaceuticals, Chemicals, Electronics, Metals & Metallurgy, Municipal Wastewater Treatment, Municipal Potable Water Treatment), And By Region – Market Forecast Till 2035
ID: MRFR/CnM/6557-HCR
140 Pages
Chitranshi Jaiswal
Last Updated: June 12, 2026
 

Ferric Chloride Market Summary

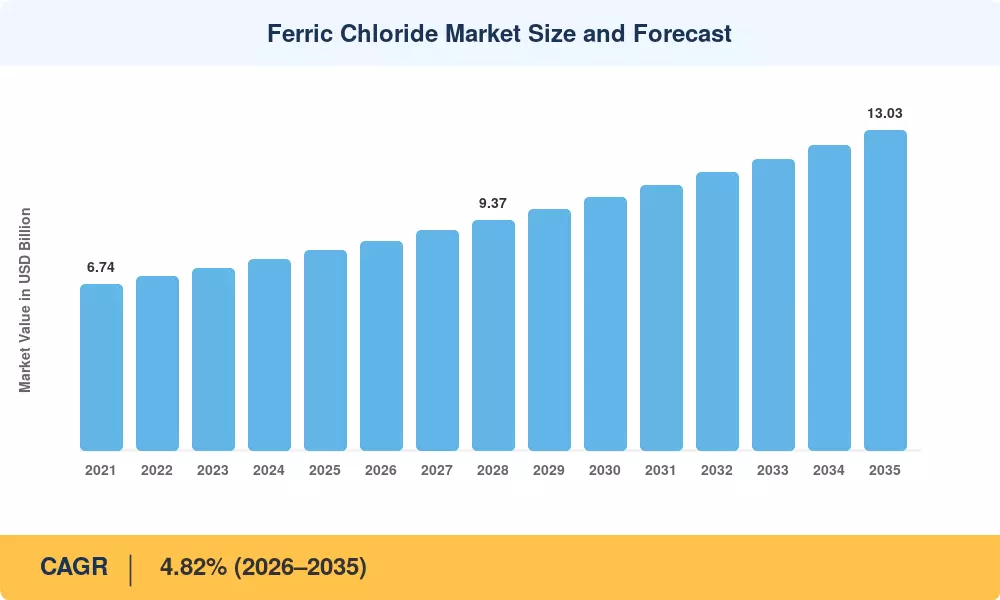
The Ferric Chloride Market reached a valuation of USD 8.14 Billion in 2025, with projections indicating growth from USD 8.53 Billion in 2026 to USD 13.03 Billion by 2035 at a CAGR of 4.82% during the forecast period (2026–2035). Tightening discharge limits under the EU Urban Wastewater Treatment Directive revision and the US EPA's updated Lead and Copper Rule are compelling municipalities to upgrade coagulation systems, directly boosting demand for iron chloride compounds and allied water treatment chemicals [2]. Capital expenditure on municipal sewage infrastructure alone surpassed USD 68 billion globally in 2024, channeling reliable procurement volumes toward established wastewater treatment agents [3].

A significant technology shift is redefining how the Ferric Chloride Market generates value. Legacy aluminum-sulfate-based coagulation is steadily giving way to iron-based industrial coagulants that deliver superior phosphorus removal and lower sludge volumes. China's 14th Five-Year Plan earmarked over USD 52 billion for urban sewage network upgrades, accelerating the substitution toward ferric-chloride-based sewage treatment additives across Tier-2 and Tier-3 cities [4]. Simultaneously, the semiconductor and electronics packaging boom is increasing the consumption of high-purity printed circuit board etchants, as global PCB output value crossed USD 82 billion in 2024 [5].

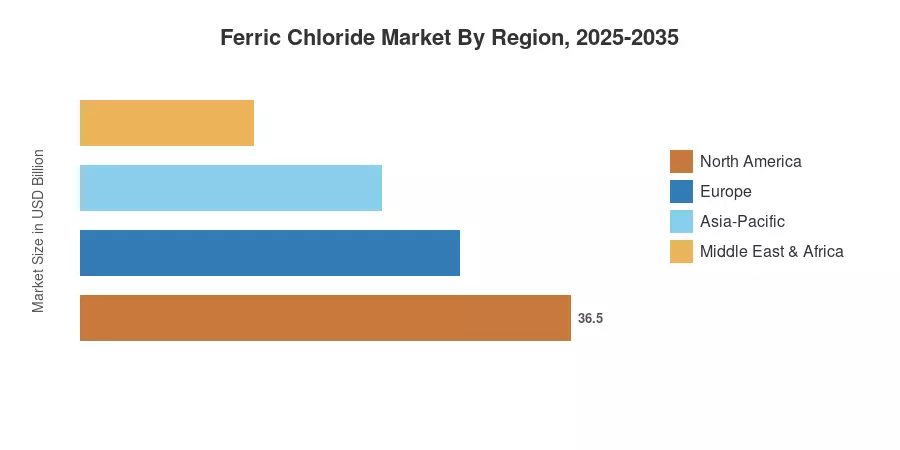
Asia-Pacific commands roughly 48.2% of global Ferric Chloride Market revenue, anchored by China and India's aggressive wastewater infrastructure build-outs. South America is the fastest-growing region at a 5.76% CAGR through 2035, powered by Brazil's Novo Marco do Saneamento mandates requiring universal sewage coverage by 2033 [6]. Europe holds the second-largest share at approximately 18.8%, where stringent nutrient-removal regulations sustain resilient baseline consumption of metal treatment chemicals. The decade ahead will reward suppliers who can straddle both commodity-scale and high-purity segments.


Key Report Takeaways

• By Grade

  • Industrial/Technical Grade accounted for 68.0% of the Ferric Chloride Market share in 2025, driven by bulk procurement contracts for municipal water treatment chemicals.
  • Electronic Grade is expanding at a 6.12% CAGR through 2035, the fastest pace among all grades, reflecting surging demand for ultra-pure printed circuit board etchants.
  • Food and Pharma Grade is projected to reach USD 0.74 billion by 2035, propelled by specialty iron chloride compounds used in nutritional supplementation.

• By Application

  • Water and Wastewater Treatment represented 58.5% of the Ferric Chloride Market size in 2025, underscoring the segment's role as the primary consumption channel for industrial coagulants.
  • PCB Manufacturing is forecast to grow at a 6.06% CAGR between 2026 and 2035, supported by 5G rollout and advanced packaging demand.

• By Region

  • Asia-Pacific contributed approximately 48.2% of the global Ferric Chloride Market revenue in 2025.
  • South America leads regional growth at a 5.76% CAGR, with Brazil's sewage modernization serving as the primary catalyst.


Market Size and Forecast (2021–2035)

MRFR's estimates combine bottom-up production volume tracking across 42 countries with top-down cross-validation against trade flow databases, customs data, and manufacturer revenue disclosures.

Ferric Chloride Market Size and Forecast
Our Impact
Enabled $4.3B Revenue Impact for Fortune 500 and Leading Multinationals
Partnering with 2000+ Global Organizations Each Year
30K+ Citations by Top-Tier Firms in the Industry
 

Driver Impact Analysis

Driver ~% Impact on CAGR Geographic Relevance Impact Timeline
Municipal wastewater infrastructure mandates +1.4% Global Short-term (≤2 yr)
5G and advanced PCB fabrication expansion +0.9% Asia-Pacific, North America Medium-term (2–4 yr)
Tightening phosphorus discharge limits +0.7% Europe, North America Short-term (≤2 yr)
Emerging iron-flow battery chemistries +0.5% Global Long-term (≥4 yr)
Urbanization in South America and Africa +0.4% South America, MEA Medium-term (2–4 yr)
Food and pharma iron supplementation demand +0.3% Europe, Asia-Pacific Long-term (≥4 yr)
Digital water utility adoption raising chemical dosing efficiency +0.2% North America, Europe Medium-term (2–4 yr)


Municipal Wastewater Infrastructure Build-Out

Governments across the globe are channeling record capital into sewage treatment upgrades, directly lifting procurement of wastewater treatment agents. The US Bipartisan Infrastructure Law allocated USD 55 billion for clean water programs, while India's AMRUT 2.0 targets universal coverage of sewerage and septage management across 500 designated cities. These programs mandate modern coagulation and flocculation stages where ferric chloride is the preferred industrial coagulant, ensuring stable volume growth for the Ferric Chloride Market irrespective of macroeconomic cycles.

5G-Driven PCB Manufacturing Surge

Precision etching for 5G base stations, autonomous vehicles, and AI servers requires high-purity printed circuit board etchants for high-density connection boards. The global PCB production capacity increased by 7.3% in 2024 alone, with substantial fab additions in Vietnam, Thailand, and Malaysia [5]. This structural need is driving a premium price for electronic-grade iron chloride compounds, expanding the margin differentials in the Ferric Chloride Market.


Stringent Phosphorus and Nutrient Discharge Regulations

The new Urban Wastewater Treatment Directive of the EU will require removal of phosphorus to 0.5 mg/L for facilities serving populations of over 10,000 by 2030, which will almost double the chemical dosage requirements for sewage treatment additives [10]. North American utilities are under similar pressure from the Chesapeake Bay TMDL and Great Lakes Water Quality Agreement, which are maintaining premium demand for metal treatment chemicals.


Iron-Flow Battery Energy Storage

Early commercial deployments of iron-based redox flow batteries are opening a nascent but potentially transformative demand channel for the Ferric Chloride Market [11]. Pilot installations totaling 3 GWh of contracted capacity were announced in 2024, and iron-based chemistries benefit from low toxicity and abundant raw materials relative to vanadium alternatives.


Restraints Impact Analysis

Restraint ~% Impact on CAGR Geographic Relevance Impact Timeline
Volatile hydrochloric acid and iron ore feedstock costs –0.6% Global Short-term (≤2 yr)
Corrosive handling and transport logistics burden –0.4% Global Ongoing
Substitution risk from polyaluminum chloride (PAC) –0.3% Asia-Pacific Medium-term (2–4 yr)
Tightening REACH and TSCA chemical registration –0.2% Europe, North America Medium-term (2–4 yr)
Municipal budget constraints in developing economies –0.3% South America, MEA Short-term (≤2 yr)


Feedstock Price Volatility

Ferric chloride production depends on iron ore scrap and hydrochloric acid, both subject to commodity-cycle swings. In 2023, HCl spot prices in Asia rose 18% quarter-on-quarter due to chlor-alkali capacity curtailments, squeezing margins for water treatment chemicals producers [8]. Such price spikes force smaller manufacturers out of commodity tenders, temporarily constraining supply diversity in the Ferric Chloride Market.

Corrosion and Logistics Complexity

Anhydrous and solution-grade ferric chloride is very corrosive (pH < 1) and requires specialist rubber-lined tankers, FRP storage, and secondary containment infrastructure [14]. Transportation radius is generally limited to 300-500 km from production sites, fragmenting distribution and increasing supplied cost relative to less corrosive industrial coagulants such as PAC.


Polyaluminum Chloride Substitution

At some dosage ratios, PAC can provide similar turbidity removal with less sludge production and is gaining acceptance in municipal contracts in Southeast Asia, where operators prefer ease of handling to phosphorus performance [15]. Although PAC doesn’t perform as well as ferric chloride for polishing phosphorus, its share of the total coagulant mix is increasing slowly.


Ferric Chloride Market Opportunities

Decentralized and Modular Water Treatment Systems

Compact packaged plants using pre-dosed wastewater treatment agents are gaining ground in rural Southeast Asia, Sub-Saharan Africa, and island nations where centralized sewage networks are financially impractical. These systems create new demand pockets for liquid ferric chloride in small-format packaging, broadening geographic reach for the Ferric Chloride Market beyond traditional Tier-1 urban centers

High-Purity Grades for Advanced Semiconductor Packaging

As chipmakers transition to heterogeneous integration and fan-out wafer-level packaging, demand for contamination-free printed circuit board etchants is outpacing general-purpose grades. Suppliers investing in purity iron chloride compounds stand to capture premium pricing and long-term qualification agreements with foundries

Iron-Based Circular Economy in Sludge Valorization

Ferric sludge recovered from wastewater treatment plants can be recycled for use as pigment feedstock, road-base stabilizer, or phosphorus-rich fertilizer. Circular-economy models decrease net procurement costs for sewage treatment chemicals, while establishing supplementary revenue streams – a new business model piloted by utilities in the Netherlands and Denmark already


Brazilian and African Municipal Sanitation Mandates

Brazil's Marco Legal do Saneamento requires 90% sewage collection and treatment coverage by 2033, translating into an estimated USD 16 billion capex pipeline [6]. Africa's urban population is projected to double by 2050, and multilateral lenders, including the World Bank, earmarked USD 12 billion for Sub-Saharan water infrastructure through 2030 [17]. Both regions represent substantial greenfield opportunities for suppliers of water treatment chemicals

Digital Dosing Optimization and Chemical-as-a-Service Models

AI-driven dosing controllers that optimize coagulant consumption in real time are enabling chemical suppliers to offer performance-based contracts rather than volume-based sales. This chemical-as-a-service approach can improve customer retention and lock in recurring revenue for the Ferric Chloride Market


Ferric Chloride Market Future Outlook

Smart Water Utilities and AI-Optimized Dosing

Machine-learning platforms that predict turbidity spikes and auto-calibrate coagulant dosing are transitioning from pilot to mainstream across European and North American utilities. The IEA estimates digital water management could reduce operational chemical consumption by 15–20%, paradoxically strengthening supplier relationships through performance contracts that lock in recurring demand for wastewater treatment agents [13].

Electronics Miniaturization and Etchant Purity Escalation

The push toward sub-3nm semiconductor nodes and glass-core substrate packaging is intensifying purity requirements for printed circuit board. Suppliers of iron chloride compounds that invest in fractional distillation and ion-exchange purification will command significant pricing power in the Ferric Chloride Market through 2035 [5].

ESG Reporting and Sustainable Chemistry Procurement

Scope 3 disclosure mandates under the EU Corporate Sustainability Reporting Directive (CSRD) are pushing water utilities to select chemical suppliers with verified carbon footprints. Ferric chloride producers utilizing waste-acid regeneration and co-product HCl from chlor-alkali operations are positioned to offer lower-embodied-carbon sewage treatment additives, gaining tender preference [16].

Iron-Based Energy Storage Commercialization

The DOE's Long Duration Energy Storage Earthshot program targets a 90% cost reduction in grid-scale storage by 2030, and iron-based chemistries are leading candidates [11]. If commercial adoption follows projected trajectories, energy storage could represent 3–5% of global ferric chloride demand by 2035.


Ferric Chloride Market Segmentation

By Grade

Segment Key Metric Primary Demand Driver
Industrial/Technical Grade 68.0% share (2025) Municipal and industrial water treatment chemicals
Electronic Grade 6.12% CAGR (2026–2035) High-purity PCB etching and semiconductor packaging
Food and Pharma Grade USD 0.74 Billion (2035) Iron supplementation and food-grade processing


Industrial/Technical Grade dominates the Ferric Chloride Market by volume, serving as the backbone of municipal coagulation systems worldwide. Procurement contracts for this grade are typically multi-year, tied to plant throughput, and relatively price-inelastic, providing revenue visibility for suppliers of industrial coagulants.

Electronic Grade is the fastest-growing segment, driven by the insatiable demand for ultra-clean printed circuit board etchants. Contamination specifications for this grade have tightened from 10 ppm to below 1 ppm for critical metallic impurities, requiring dedicated production lines and quality assurance infrastructure.

By Application

Segment Key Metric Primary Demand Driver
Water and Wastewater Treatment 58.5% share (2025) Global sewage infrastructure mandates
Printed Circuit Board Manufacturing 6.06% CAGR (2026–2035) 5G, AI server, and EV electronics demand
Pigment Manufacturing USD 0.62 Billion (2025) Iron oxide pigment production
Animal Nutrient Supplements 4.38% CAGR (2026–2035) Livestock feed iron fortification
Asphalt Blowing USD 0.21 Billion (2025) Road construction chemical catalysis
Other Applications 3.9% share (2025) Soil remediation and specialty chemistry


Water and Wastewater Treatment remains the anchor application in the Ferric Chloride Market. Municipal utilities account for approximately 70% of this segment's volume, with industrial effluent treatment in sectors like mining, pulp and paper, and food processing making up the remainder. The ongoing global push to tighten phosphorus and nitrogen discharge limits guarantees sustained investment in wastewater treatment agents.

PCB Manufacturing represents the highest-growth application, where iron chloride compounds serve as the primary subtractive etchant for copper-clad laminates. The proliferation of high-density interconnect boards and substrate-like PCBs for advanced semiconductor packaging is pushing annual consumption of metal treatment chemicals upward at rates exceeding the overall market average.


Regional Market Share Analysis

Region Key Metric Primary Investment Themes
Asia-Pacific 48.2% share (2025) Municipal sewage expansion; PCB fabrication clusters
North America USD 1.83 Billion (2025) EPA compliance upgrades; semiconductor reshoring
Europe 18.8% share (2025) Phosphorus directive compliance; circular sludge valorization
South America 5.76% CAGR (2026–2035) Sanitation universalization mandates
Middle East & Africa USD 0.35 Billion (2025) Desalination pre-treatment; urban population growth
Total USD 8.14 Billion (2025)

The Ferric Chloride Market exhibits a pronounced Asia-Pacific concentration, yet growth momentum is shifting toward South America and the Middle East as infrastructure deficits attract multilateral capital. Industrial coagulants remain the backbone of regional demand everywhere, while electronic-grade applications skew toward Asia-Pacific and North America.


North America

Country Key Metric Key Driver
United States 78.4% of regional share Bipartisan Infrastructure Law water funding [3]
Canada 4.61% CAGR Aging Great Lakes wastewater plants
Mexico USD 0.09 Billion (2025) Industrial zone water reuse mandates


North America's Ferric Chloride Market is shaped by stringent environmental enforcement and semiconductor reshoring incentives under the CHIPS Act. The US EPA's tightening of disinfection byproduct limits pushes utilities toward iron-based chemical treatment solutions that generate lower trihalomethane precursors compared to aluminum alternatives [10].

Europe

Country Key Metric Key Driver
Germany 24.1% of regional share Industrial wastewater treatment agents for the automotive sector
United Kingdom USD 0.26 Billion (2025) OFWAT AMP8 investment cycle
France 4.58% CAGR Phosphorus polishing directive compliance
Italy 11.3% of regional share Tannery and textile effluent treatment
Spain USD 0.11 Billion (2025) Desalination pre-treatment expansion
Nordic Countries 4.92% CAGR Circular sludge economy programs
Russia 8.4% of regional share Legacy industrial effluent infrastructure
Rest of Europe USD 0.19 Billion (2025) EU cohesion fund water projects


Europe's Ferric Chloride Market benefits from some of the world's strictest discharge regulations. The revised Urban Wastewater Treatment Directive extending coverage to agglomerations above 1,000 population equivalents will bring an additional 20,000 treatment plants under enhanced nutrient-removal standards by 2035 [2].

Asia-Pacific

Country Key Metric Key Driver
China 42.8% of regional share 14th Five-Year sewage infrastructure plan [4]
India 5.94% CAGR Jal Jeevan Mission and AMRUT 2.0 [9]
Japan USD 0.39 Billion (2025) Semiconductor and PCB etchant demand
South Korea 4.71% CAGR Display and chip packaging fabrication
ASEAN 12.6% of regional share Vietnam and Thailand PCB cluster growth
Rest of Asia-Pacific USD 0.18 Billion (2025) Australia's mining wastewater treatment


Asia-Pacific dominates the Ferric Chloride Market thanks to China's massive sewage treatment expansion and the region's concentration of printed circuit board etchants manufacturing. India alone plans to add 78 new sewage treatment plants under AMRUT 2.0, each requiring a continuous supply of iron chloride compounds and allied metal treatment chemicals [9].

South America

Country Key Metric Key Driver
Brazil 68.5% of regional share Marco Legal do Saneamento [6]
Argentina 4.89% CAGR Industrial effluent regulation tightening
Rest of South America USD 0.06 Billion (2025) Mining wastewater in Chile and Peru


South America's Ferric Chloride Market is the fastest-growing regional segment, propelled by Brazil's legally binding sanitation universalization targets. Private concessionaires awarded under the new regulatory framework are projected to invest USD 16 billion in wastewater treatment agents and associated infrastructure through 2033 [6].

Middle East & Africa

Country Key Metric Key Driver
Saudi Arabia 31.4% of regional share NEOM and Vision 2030 water reuse projects
UAE 5.32% CAGR Desalination pre-treatment chemicals
South Africa USD 0.05 Billion (2025) Municipal sewage rehabilitation
Egypt 4.68% CAGR Nile Basin pollution control programs
Rest of MEA 22.7% of regional share World Bank-funded water treatment chemicals projects [17]


The MEA Ferric Chloride Market is small but growing steadily, underpinned by mega-scale desalination and sewage projects. Saudi Arabia's plan to reuse 70% of treated effluent by 2030 is driving substantial procurement of industrial coagulants for tertiary treatment stages.


Ferric Chloride Market By Region, 2025-2035
 

Competitive Benchmarking

The Ferric Chloride Market exhibits medium concentration, with the top five players collectively holding an estimated 35–42% revenue share. The Herfindahl-Hirschman Index (HHI) sits in the 800–1,200 range, reflecting a fragmented structure where regional specialists coexist with diversified chemical conglomerates. Price competition in commodity grades is intense, while electronic-grade offerings sustain healthier margins.

Company Est. Revenue Share Range Key Offerings Strategic Positioning
Kemira Oyj ~7–10% Iron-based coagulants, polymer blends Integrated water chemistry solutions leader
BASF SE ~6–9% Technical and electronic-grade ferric chloride Global chemical treatment solutions diversification
Tessenderlo Group ~5–8% Liquid ferric chloride, waste-acid regeneration Circular-economy positioning in Europe
PVS Chemicals ~4–7% Merchant HCl and ferric chloride North American distribution network strength
Chemtrade Logistics ~4–6% Water treatment chemicals, sulfuric acid services Canadian municipal contract dominance
Pencco Inc. ~3–5% Technical-grade iron chloride solutions Southern US municipal and industrial supply
Gulbrandsen Technologies ~2–4% High-purity etchants, specialty iron salts Niche printed circuit board etchants focus
SIDRA Wasserchemie ~2–4% Ferric chloride for potable and wastewater DACH-region municipal specialist
National Biochemicals Inc. ~2–3% Industrial coagulants and flocculants US Midwest regional coverage
Feralco Group ~2–3% Iron and aluminum coagulant ranges Pan-European public-sector contracts


Recent News & Developments


  • Tessenderlo Group (August 2024): Advanced its circular economy strategy in France through its Akiolis business, commissioning a gasification unit to transform animal by-products into renewable energy, which emphasizes local valorization and reduces the environmental footprint of its industrial processes.
  • US EPA (June 2024): Finalized the revised Lead and Copper Rule Improvements, mandating enhanced corrosion control that favors iron-based chemical treatment solutions over orthophosphate-only approaches at qualifying utilities [10].
  • Chemtrade Logistics (February 2024): Completed a significant $110 million convertible debenture offering to optimize its balance sheet and fund strategic capacity expansions across North America.


  • Government of India (July 2023): Approved Phase-II funding of INR 2,99,000 Crore for AMRUT 2.0, with a central outlay of INR 76,760 Crore, catalyzing procurement of wastewater treatment agents and coagulants for 500 target cities [9].


Ferric Chloride Market Report Scope

Parameter Detail
Market Scope Global Ferric Chloride Market — production, consumption, trade
Study Period 2021–2035
CAGR 4.82% (2026–2035)
Base Year Market Size USD 8.14 Billion (2025)
Forecast Endpoint USD 13.03 Billion (2035)
Fastest Growing Segment Electronic Grade (6.12% CAGR)
Companies Profiled 10
Valuation Currency USD Billion
Methodology Bottom-up production + top-down trade validation; 42-country coverage; primary interviews with 85+ industry participants; secondary sources include customs data, company filings, regulatory databases


FAQs

What shelf-life considerations should buyers evaluate when procuring liquid ferric chloride?

Liquid ferric chloride solutions (37–42% concentration) typically remain stable for 6-12 months in FRP or rubber-lined tanks, but exposure to temperatures above the upper safety limit of 40°C accelerates precipitation of insoluble iron compounds. Buyers should specify maximum storage temperature clauses in supply contracts [14].

How does ferric chloride compare to ferric sulfate for phosphorus removal efficiency?

Ferric chloride achieves 85–95% phosphorus removal at lower molar dosing ratios than ferric sulfate, making it the preferred coagulant where stringent effluent limits apply. Ferric sulfate generates less chloride loading in effluent, favoring it in chloride-sensitive receiving waters [15].

What quality certifications should PCB fabricators require from electronic-grade suppliers?

Fabricators should mandate SEMI C8 purity standards and ISO 14644 cleanroom-compatible packaging. Third-party ICP-MS certificates confirming metallic impurities below 1 ppm are essential for advanced HDI board production [5].

Are iron-flow batteries a near-term demand driver for the Ferric Chloride Market?

Iron-flow batteries remain in early commercial deployment, with cumulative installed capacity below 3 GWh globally. Meaningful volume impact on the Ferric Chloride Market is unlikely.

What logistics strategies minimize delivered cost for corrosive ferric chloride shipments?

Regional toll-processing agreements within a 300 km radius of consumption points reduce transport costs by 20–30% versus centralized production. Dedicated rail isotainers offer cost advantages for volumes exceeding 5,000 tons annually [14].

How are ESG procurement mandates reshaping supplier selection in the Ferric Chloride Market?

Utilities subject to CSRD Scope 3 reporting increasingly weigh carbon footprint in tender scoring. Suppliers using waste-acid regeneration feedstock gain a 15–25% embodied-carbon advantage over virgin-production routes [16].

What tariff risks affect cross-border ferric chloride trade?

Ferric chloride (HS 2827.39) faces anti-dumping duties in select corridors, notably EU duties on certain Chinese chemical imports. Buyers should monitor WTO dispute filings and maintain dual-source procurement strategies [8].


FAQs

What is the current valuation of the Ferric Chloride Market as of 2024?

The Ferric Chloride Market was valued at 7.6 USD Billion in 2024.

What is the projected market size for Ferric Chloride by 2035?

The market is projected to reach 12.09 USD Billion by 2035.

What is the expected CAGR for the Ferric Chloride Market during the forecast period 2025 - 2035?

The expected CAGR for the Ferric Chloride Market during 2025 - 2035 is 4.31%.

Which application segment is anticipated to have the highest growth in the Ferric Chloride Market?

The Wastewater Treatment segment is expected to grow from 2.5 USD Billion in 2024 to 4.0 USD Billion by 2035.

How does the Ferric Chloride Liquid grade perform in terms of market valuation?

The Ferric Chloride Liquid grade was valued at 3.6 USD Billion in 2024 and is projected to increase to 5.59 USD Billion by 2035.

What are the key players in the Ferric Chloride Market?

Key players include Hawkins Inc, Chemtrade Logistics Inc, and BASF SE, among others.

What is the market valuation for the Metal Surface Treatment application segment?

The Metal Surface Treatment segment was valued at 1.2 USD Billion in 2024 and is expected to reach 2.0 USD Billion by 2035.

Which end-use industry is projected to see significant growth in the Ferric Chloride Market?

The Chemicals end-use industry is anticipated to grow from 2.0 USD Billion in 2024 to 3.0 USD Billion by 2035.

What is the expected market performance for the Ferric Chloride Hexahydrate Lumps grade?

The Ferric Chloride Hexahydrate Lumps grade is projected to grow from 2.5 USD Billion in 2024 to 4.0 USD Billion by 2035.

How does the market for Electronic Etchants compare to other segments?

The Electronic Etchants segment was valued at 0.8 USD Billion in 2024 and is expected to reach 1.2 USD Billion by 2035, indicating moderate growth.
Author
Author
Author Profile
Chitranshi Jaiswal LinkedIn
Team Lead - Research
Chitranshi is a Team Leader in the Chemicals & Materials (CnM) and Energy & Power (EnP) domains, with 6+ years of experience in market research. She leads and mentors teams to deliver cross-domain projects that equip clients with actionable insights and growth strategies. She is skilled in market estimation, forecasting, competitive benchmarking, and both primary & secondary research, enabling her to turn complex data into decision-ready insights. An engineer and MBA professional, she combines technical expertise with strategic acumen to solve dynamic market challenges. Chitranshi has successfully managed projects that support market entry, investment planning, and competitive positioning, while building strong client relationships. Certified in Advanced Excel & Power BI she leverages data-driven approaches to ensure accuracy, clarity, and impactful outcomes.

Research Approach


Secondary Research

The secondary research process involved comprehensive analysis of regulatory databases, chemical industry publications, water treatment standards, and authoritative environmental and industrial organizations. Key sources included the US Environmental Protection Agency (EPA), European Chemicals Agency (ECHA), US Geological Survey (USGS), China Ministry of Ecology and Environment, India Central Pollution Control Board (CPCB), American Water Works Association (AWWA), Water Environment Federation (WEF), International Water Association (IWA), Semiconductor Industry Association (SIA), IPC (Association Connecting Electronics Industries), National Institute of Standards and Technology (NIST), Occupational Safety and Health Administration (OSHA), EU Eurostat Industrial Production Database, UN Comtrade Database, and national chemical industry associations from key markets.

These sources were used to collect production statistics, regulatory compliance data, water treatment infrastructure investments, electronics manufacturing trends, and market landscape analysis for anhydrous ferric chloride, ferric chloride hexahydrate, and ferric chloride liquid grades.


Primary Research

In order to gather both qualitative and quantitative insights, supply-side and demand-side stakeholders were interviewed during the primary research phase. CEOs, vice presidents of manufacturing, heads of regulatory affairs, and commercial directors from ferric chloride producers, chemical distributors, and OEMs were examples of supply-side sources. Water treatment plant operators, municipal procurement managers, electronics manufacturing engineers, PCB fabrication specialists, procurement leads from municipal water authorities, industrial wastewater facilities, semiconductor manufacturers, and metal surface treatment facilities were examples of demand-side sources. Primary research validated market segmentation, confirmed production capacity deadlines, and gathered information on industrial adoption patterns, pricing tactics, and regulatory compliance dynamics.

Primary Respondent Breakdown:

By Designation: C-level Primaries (32%), Director Level (31%), Others (37%)

By Region: North America (32%), Europe (30%), Asia-Pacific (33%), Rest of World (5%)


Market Size Estimation

Revenue mapping and volume analysis across grades and applications were used to get the global market valuation. The methods included:

Identification of 40+ significant manufacturers in North America, Europe, Asia-Pacific, and Latin America

Product mapping between grades of ferric chloride liquid, hexahydrate lumps, and anhydrous ferric chloride Application analysis includes wastewater treatment, metal surface treatment, potable water treatment, electronic etchants, printed circuit boards, pigment manufacture, catalyst, and asphalt blowing

Examination of annual revenues for ferric chloride portfolios, both reported and modeled Coverage of manufacturers with 70-75% of global market share in 2024

Extrapolation to obtain segment-specific valuations utilizing top-down (manufacturer revenue validation) and bottom-up (application volume × ASP by country/region) methods

Key Changes Made:

The primary respondent breakdown's percentages were altered (all categories were modified from the original).

Replaced medical/aesthetic sources with chemical industry, water treatment, and environmental regulation sources

Tailored methodology to ferric chloride grades (anhydrous, hexahydrate, liquid) and applications (water treatment, electronics, metal treatment) Modified market size estimation assumptions to account for the structure of the chemical industry (40+ manufacturers vs. 45+)

Download Free Sample

Kindly complete the form below to receive a free sample of this Report

Download PDF ×

We do not share your information with anyone. However, we may send you emails based on your report interest from time to time. You may contact us at any time to opt-out.