Segmentation Quick Reference
| Dimension | Sub-Segments | Dominant Segment | Fastest Growing Segment |
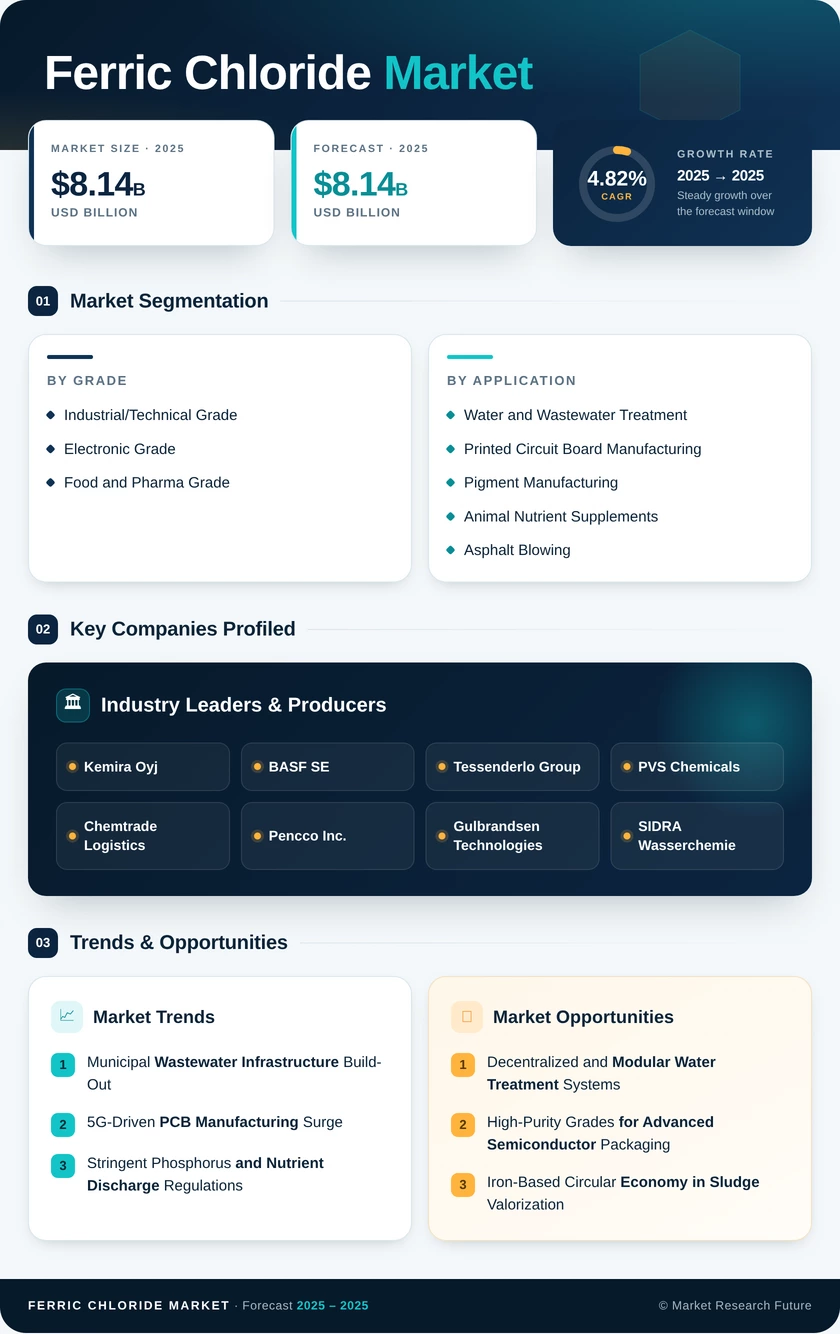
| By Grade | Industrial/Technical Grade, Electronic Grade, Food and Pharma Grade | Industrial/Technical Grade (68.0% share, 2025) | Electronic Grade (6.12% CAGR) |
| By Application | Water and Wastewater Treatment, Printed Circuit Board, Pigment Manufacturing, Animal Nutrient Supplements, Asphalt Blowing, Other Applications | Water and Wastewater Treatment (58.5% share, 2025) | Printed Circuit Board (6.06% CAGR) |
| By Region | Asia-Pacific, North America, Europe, South America, the Middle East & Africa | Asia-Pacific (48.2% share, 2025) | South America (5.76% CAGR) |
Market Segmentation Overview
By Grade
| Sub-Segment | Key Trend |
| Industrial/Technical Grade | Bulk municipal contracts ensure stable demand; pricing pressure from PAC alternatives |
| Electronic Grade | Purity specifications tightening to sub-1 ppm as advanced packaging scales |
| Food and Pharma Grade | Growing adoption as an iron-fortification agent in nutritional supplements |
Industrial/Technical Grade remains the volume backbone of the global ferric chloride supply chain, consumed primarily by municipal and industrial wastewater treatment plants under long-term procurement agreements. Electronic Grade is gaining strategic importance as semiconductor and PCB manufacturers impose increasingly stringent purity requirements, commanding price premiums of 3–5× over technical-grade material.
By Application
| Sub-Segment | Key Trend |
| Water and Wastewater Treatment | Global discharge regulation tightening sustains baseline coagulant consumption |
| Printed Circuit Board Manufacturing | 5G and AI hardware cycles driving etchant volume acceleration |
| Pigment Manufacturing | Steady demand for iron oxide pigments in construction coatings |
| Animal Nutrient Supplements | Rising livestock production in APAC boosts feed-grade iron chloride uptake |
| Asphalt Blowing | Niche catalytic application linked to road infrastructure investment cycles |
| Other Applications | Soil remediation, odor control, and specialty chemical synthesis |
Water and Wastewater Treatment dominates consumption across all geographies, serving as the resilient demand floor that underpins the overall market through economic cycles. Printed Circuit Board Manufacturing is the most dynamic application segment, with growth driven by the simultaneous scaling of 5G infrastructure, electric vehicle electronics, and AI-server packaging requirements.
By Region
| Sub-Segment | Key Trend |
| Asia-Pacific | China and India municipal sewage expansion; regional PCB fabrication dominance |
| North America | EPA compliance upgrades and semiconductor reshoring under CHIPS Act |
| Europe | Phosphorus directive compliance and circular sludge valorization programs |
| South America | Brazil sanitation universalization mandates driving greenfield procurement |
| Middle East & Africa | Desalination pre-treatment and World Bank-funded water infrastructure |
Asia-Pacific's commanding position reflects decades of industrialization-driven demand combined with China's aggressive municipal wastewater buildout. South America's rapid growth trajectory is policy-driven, anchored by Brazil's legally binding requirement to achieve universal sewage treatment coverage by 2033.