US Blood Collection Market Segmentation
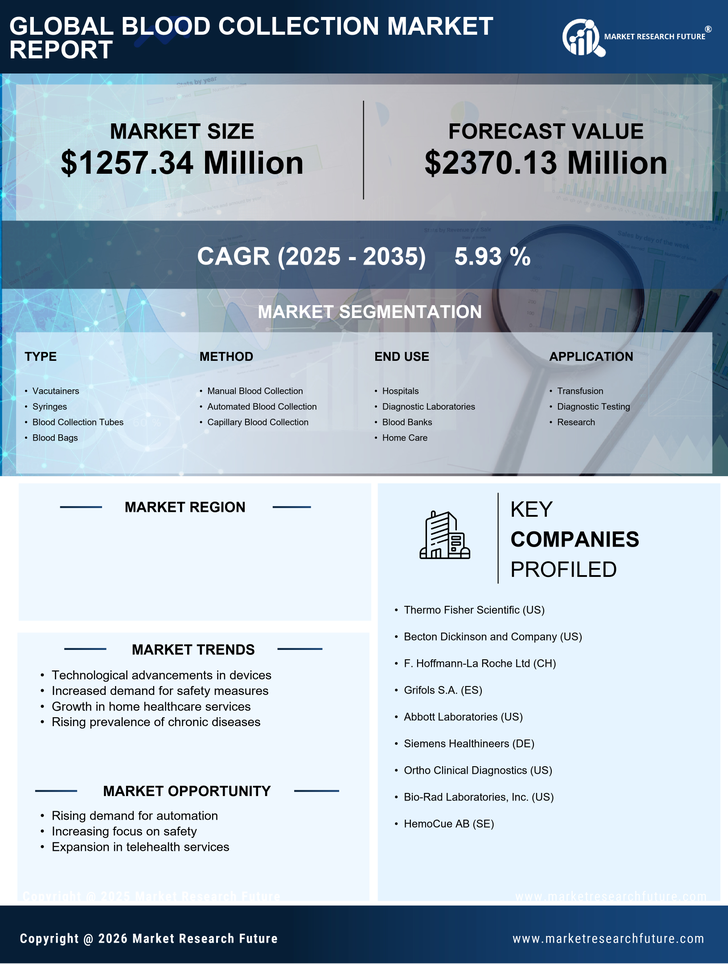
US Blood Collection Market By Type (USD Million, 2025-2035)
- Vacutainers
- Syringes
- Blood Collection Tubes
- Blood Bags
US Blood Collection Market By Method (USD Million, 2025-2035)
- Manual Blood Collection
- Automated Blood Collection
- Capillary Blood Collection
US Blood Collection Market By End Use (USD Million, 2025-2035)
- Hospitals
- Diagnostic Laboratories
- Blood Banks
- Home Care
US Blood Collection Market By Application (USD Million, 2025-2035)
- Transfusion
- Diagnostic Testing
- Research