Request Free Sample ×

Kindly complete the form below to receive a free sample of this Report

* Please use a valid business email

Leading companies partner with us for data-driven Insights

clients tt-cursor
Hero Background

US Business Travel Market

ID: MRFR/AD/15689-HCR
100 Pages
Triveni Bhoyar
Last Updated: April 06, 2026
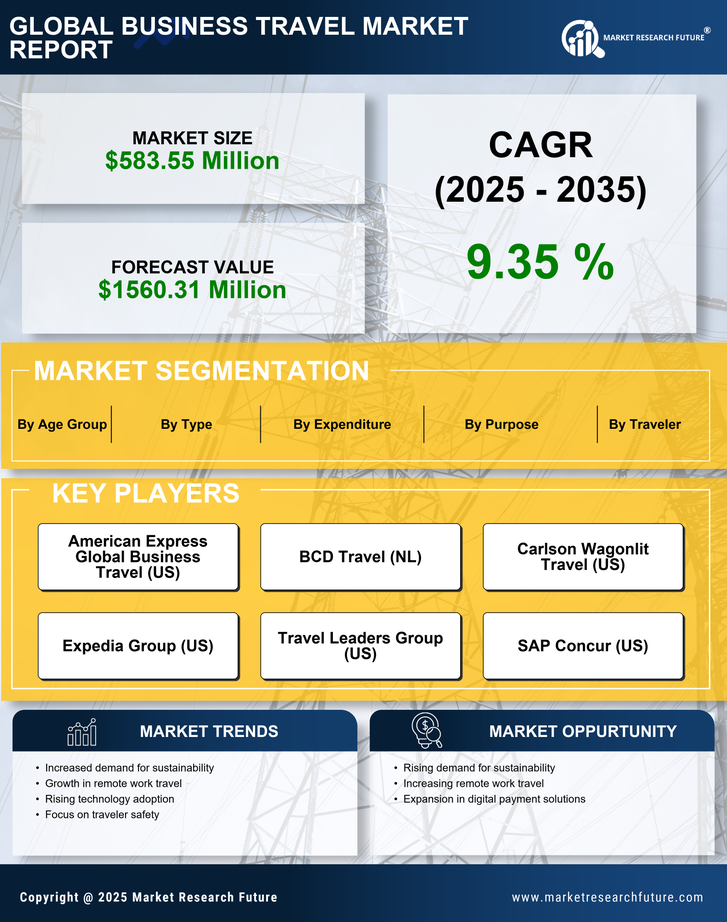
US Business Travel Market Size, Share, Industry Trend & Analysis Research Report By Type (Managed Business Travel, Unmanaged Business Travel), By Purpose (Marketing, Internal Meetings, Trade Shows, Product Launch, Others), By Service (Food and Lodging, Recreation Activities), By Industry (Government, Corporate), By Traveler (Group Travel, Solo Travel, Service), By Age Group (Travelers Below 40 Years, Travelers Above 40 Years), By Expenditure (Marketing Travel Fare, Lodging, Dining, Others) - Forecast to 2035
Download PDF ×

We do not share your information with anyone. However, we may send you emails based on your report interest from time to time. You may contact us at any time to opt-out.

  1. 1 SECTION I: EXECUTIVE SUMMARY AND KEY HIGHLIGHTS
    1. 1.1 EXECUTIVE SUMMARY
      1. 1.1.1 Market Overview
      2. 1.1.2 Key Findings
      3. 1.1.3 Market Segmentation
      4. 1.1.4 Competitive Landscape
      5. 1.1.5 Challenges and Opportunities
      6. 1.1.6 Future Outlook
  2. 2 SECTION II: SCOPING, METHODOLOGY AND MARKET STRUCTURE
    1. 2.1 MARKET INTRODUCTION
      1. 2.1.1 Definition
      2. 2.1.2 Scope of the study
        1. 2.1.2.1 Research Objective
        2. 2.1.2.2 Assumption
        3. 2.1.2.3 Limitations
    2. 2.2 RESEARCH METHODOLOGY
      1. 2.2.1 Overview
      2. 2.2.2 Data Mining
      3. 2.2.3 Secondary Research
      4. 2.2.4 Primary Research
        1. 2.2.4.1 Primary Interviews and Information Gathering Process
        2. 2.2.4.2 Breakdown of Primary Respondents
      5. 2.2.5 Forecasting Model
      6. 2.2.6 Market Size Estimation
        1. 2.2.6.1 Bottom-Up Approach
        2. 2.2.6.2 Top-Down Approach
      7. 2.2.7 Data Triangulation
      8. 2.2.8 Validation
  3. 3 SECTION III: QUALITATIVE ANALYSIS
    1. 3.1 MARKET DYNAMICS
      1. 3.1.1 Overview
      2. 3.1.2 Drivers
      3. 3.1.3 Restraints
      4. 3.1.4 Opportunities
    2. 3.2 MARKET FACTOR ANALYSIS
      1. 3.2.1 Value chain Analysis
      2. 3.2.2 Porter's Five Forces Analysis
        1. 3.2.2.1 Bargaining Power of Suppliers
        2. 3.2.2.2 Bargaining Power of Buyers
        3. 3.2.2.3 Threat of New Entrants
        4. 3.2.2.4 Threat of Substitutes
        5. 3.2.2.5 Intensity of Rivalry
      3. 3.2.3 COVID-19 Impact Analysis
        1. 3.2.3.1 Market Impact Analysis
        2. 3.2.3.2 Regional Impact
        3. 3.2.3.3 Opportunity and Threat Analysis
  4. 4 SECTION IV: QUANTITATIVE ANALYSIS
    1. 4.1 Automobile, BY Type (USD Million)
      1. 4.1.1 Managed Business Travel
      2. 4.1.2 Unmanaged Business Travel
    2. 4.2 Automobile, BY Purpose (USD Million)
      1. 4.2.1 Marketing
      2. 4.2.2 Internal Meetings
      3. 4.2.3 Trade Shows
      4. 4.2.4 Product Launch
      5. 4.2.5 Others
    3. 4.3 Automobile, BY Expenditure (USD Million)
      1. 4.3.1 Marketing Travel Fare
      2. 4.3.2 Lodging
      3. 4.3.3 Dining
      4. 4.3.4 Others
    4. 4.4 Automobile, BY Age Group (USD Million)
      1. 4.4.1 Travelers Below 40 Years
      2. 4.4.2 Travelers Above 40 Years
    5. 4.5 Automobile, BY Traveler (USD Million)
      1. 4.5.1 Group Travel
      2. 4.5.2 Solo Travel
      3. 4.5.3 Service
    6. 4.6 Automobile, BY Service (USD Million)
      1. 4.6.1 Food and Lodging
      2. 4.6.2 Recreation Activities
    7. 4.7 Automobile, BY Industry (USD Million)
      1. 4.7.1 Government
      2. 4.7.2 Corporate
  5. 5 SECTION V: COMPETITIVE ANALYSIS
    1. 5.1 Competitive Landscape
      1. 5.1.1 Overview
      2. 5.1.2 Competitive Analysis
      3. 5.1.3 Market share Analysis
      4. 5.1.4 Major Growth Strategy in the Automobile
      5. 5.1.5 Competitive Benchmarking
      6. 5.1.6 Leading Players in Terms of Number of Developments in the Automobile
      7. 5.1.7 Key developments and growth strategies
        1. 5.1.7.1 New Product Launch/Service Deployment
        2. 5.1.7.2 Merger & Acquisitions
        3. 5.1.7.3 Joint Ventures
      8. 5.1.8 Major Players Financial Matrix
        1. 5.1.8.1 Sales and Operating Income
        2. 5.1.8.2 Major Players R&D Expenditure. 2023
    2. 5.2 Company Profiles
      1. 5.2.1 American Express Global Business Travel (US)
        1. 5.2.1.1 Financial Overview
        2. 5.2.1.2 Products Offered
        3. 5.2.1.3 Key Developments
        4. 5.2.1.4 SWOT Analysis
        5. 5.2.1.5 Key Strategies
      2. 5.2.2 BCD Travel (NL)
        1. 5.2.2.1 Financial Overview
        2. 5.2.2.2 Products Offered
        3. 5.2.2.3 Key Developments
        4. 5.2.2.4 SWOT Analysis
        5. 5.2.2.5 Key Strategies
      3. 5.2.3 Carlson Wagonlit Travel (US)
        1. 5.2.3.1 Financial Overview
        2. 5.2.3.2 Products Offered
        3. 5.2.3.3 Key Developments
        4. 5.2.3.4 SWOT Analysis
        5. 5.2.3.5 Key Strategies
      4. 5.2.4 Expedia Group (US)
        1. 5.2.4.1 Financial Overview
        2. 5.2.4.2 Products Offered
        3. 5.2.4.3 Key Developments
        4. 5.2.4.4 SWOT Analysis
        5. 5.2.4.5 Key Strategies
      5. 5.2.5 Travel Leaders Group (US)
        1. 5.2.5.1 Financial Overview
        2. 5.2.5.2 Products Offered
        3. 5.2.5.3 Key Developments
        4. 5.2.5.4 SWOT Analysis
        5. 5.2.5.5 Key Strategies
      6. 5.2.6 SAP Concur (US)
        1. 5.2.6.1 Financial Overview
        2. 5.2.6.2 Products Offered
        3. 5.2.6.3 Key Developments
        4. 5.2.6.4 SWOT Analysis
        5. 5.2.6.5 Key Strategies
      7. 5.2.7 Egencia (US)
        1. 5.2.7.1 Financial Overview
        2. 5.2.7.2 Products Offered
        3. 5.2.7.3 Key Developments
        4. 5.2.7.4 SWOT Analysis
        5. 5.2.7.5 Key Strategies
      8. 5.2.8 ATPI (GB)
        1. 5.2.8.1 Financial Overview
        2. 5.2.8.2 Products Offered
        3. 5.2.8.3 Key Developments
        4. 5.2.8.4 SWOT Analysis
        5. 5.2.8.5 Key Strategies
      9. 5.2.9 Frosch (US)
        1. 5.2.9.1 Financial Overview
        2. 5.2.9.2 Products Offered
        3. 5.2.9.3 Key Developments
        4. 5.2.9.4 SWOT Analysis
        5. 5.2.9.5 Key Strategies
    3. 5.3 Appendix
      1. 5.3.1 References
      2. 5.3.2 Related Reports
  6. 6 LIST OF FIGURES
    1. 6.1 MARKET SYNOPSIS
    2. 6.2 US MARKET ANALYSIS BY TYPE
    3. 6.3 US MARKET ANALYSIS BY PURPOSE
    4. 6.4 US MARKET ANALYSIS BY EXPENDITURE
    5. 6.5 US MARKET ANALYSIS BY AGE GROUP
    6. 6.6 US MARKET ANALYSIS BY TRAVELER
    7. 6.7 US MARKET ANALYSIS BY SERVICE
    8. 6.8 US MARKET ANALYSIS BY INDUSTRY
    9. 6.9 KEY BUYING CRITERIA OF AUTOMOBILE
    10. 6.10 RESEARCH PROCESS OF MRFR
    11. 6.11 DRO ANALYSIS OF AUTOMOBILE
    12. 6.12 DRIVERS IMPACT ANALYSIS: AUTOMOBILE
    13. 6.13 RESTRAINTS IMPACT ANALYSIS: AUTOMOBILE
    14. 6.14 SUPPLY / VALUE CHAIN: AUTOMOBILE
    15. 6.15 AUTOMOBILE, BY TYPE, 2024 (% SHARE)
    16. 6.16 AUTOMOBILE, BY TYPE, 2024 TO 2035 (USD Million)
    17. 6.17 AUTOMOBILE, BY PURPOSE, 2024 (% SHARE)
    18. 6.18 AUTOMOBILE, BY PURPOSE, 2024 TO 2035 (USD Million)
    19. 6.19 AUTOMOBILE, BY EXPENDITURE, 2024 (% SHARE)
    20. 6.20 AUTOMOBILE, BY EXPENDITURE, 2024 TO 2035 (USD Million)
    21. 6.21 AUTOMOBILE, BY AGE GROUP, 2024 (% SHARE)
    22. 6.22 AUTOMOBILE, BY AGE GROUP, 2024 TO 2035 (USD Million)
    23. 6.23 AUTOMOBILE, BY TRAVELER, 2024 (% SHARE)
    24. 6.24 AUTOMOBILE, BY TRAVELER, 2024 TO 2035 (USD Million)
    25. 6.25 AUTOMOBILE, BY SERVICE, 2024 (% SHARE)
    26. 6.26 AUTOMOBILE, BY SERVICE, 2024 TO 2035 (USD Million)
    27. 6.27 AUTOMOBILE, BY INDUSTRY, 2024 (% SHARE)
    28. 6.28 AUTOMOBILE, BY INDUSTRY, 2024 TO 2035 (USD Million)
    29. 6.29 BENCHMARKING OF MAJOR COMPETITORS
  7. 7 LIST OF TABLES
    1. 7.1 LIST OF ASSUMPTIONS
  8. 7.1.1
    1. 7.2 US MARKET SIZE ESTIMATES; FORECAST
      1. 7.2.1 BY TYPE, 2025-2035 (USD Million)
      2. 7.2.2 BY PURPOSE, 2025-2035 (USD Million)
      3. 7.2.3 BY EXPENDITURE, 2025-2035 (USD Million)
      4. 7.2.4 BY AGE GROUP, 2025-2035 (USD Million)
      5. 7.2.5 BY TRAVELER, 2025-2035 (USD Million)
      6. 7.2.6 BY SERVICE, 2025-2035 (USD Million)
      7. 7.2.7 BY INDUSTRY, 2025-2035 (USD Million)
    2. 7.3 PRODUCT LAUNCH/PRODUCT DEVELOPMENT/APPROVAL
  9. 7.3.1
    1. 7.4 ACQUISITION/PARTNERSHIP
  10. 7.4.1

US Automobile Market Segmentation

Automobile By Type (USD Million, 2025-2035)

  • Managed Business Travel
  • Unmanaged Business Travel

Automobile By Purpose (USD Million, 2025-2035)

  • Marketing
  • Internal Meetings
  • Trade Shows
  • Product Launch
  • Others

Automobile By Expenditure (USD Million, 2025-2035)

  • Marketing Travel Fare
  • Lodging
  • Dining
  • Others

Automobile By Age Group (USD Million, 2025-2035)

  • Travelers Below 40 Years
  • Travelers Above 40 Years

Automobile By Traveler (USD Million, 2025-2035)

  • Group Travel
  • Solo Travel
  • Service

Automobile By Service (USD Million, 2025-2035)

  • Food and Lodging
  • Recreation Activities

Automobile By Industry (USD Million, 2025-2035)

  • Government
  • Corporate