US Craft Soda Market Segmentation
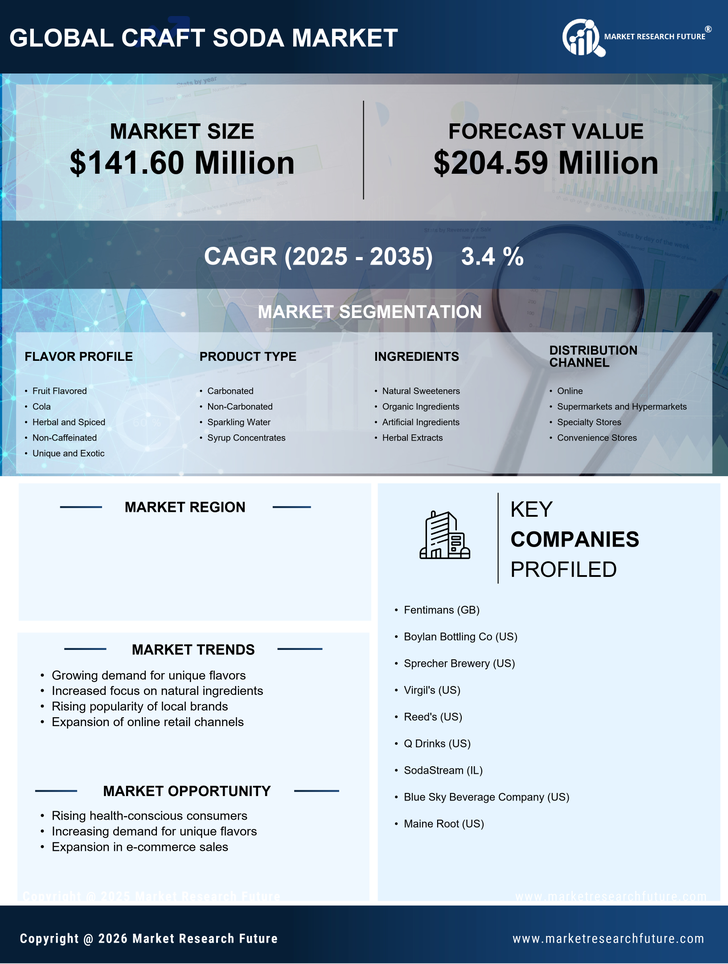
US Craft Soda Market By Flavor Profile (USD Million, 2025-2035)
- Fruit Flavored
- Cola
- Herbal and Spiced
- Non-Caffeinated
- Unique and Exotic
US Craft Soda Market By Product Type (USD Million, 2025-2035)
- Carbonated
- Non-Carbonated
- Sparkling Water
- Syrup Concentrates
US Craft Soda Market By Ingredients (USD Million, 2025-2035)
- Natural Sweeteners
- Organic Ingredients
- Artificial Ingredients
- Herbal Extracts
US Craft Soda Market By Distribution Channel (USD Million, 2025-2035)
- Online
- Supermarkets and Hypermarkets
- Specialty Stores
- Convenience Stores