US Halal Foods Beverages Market Segmentation
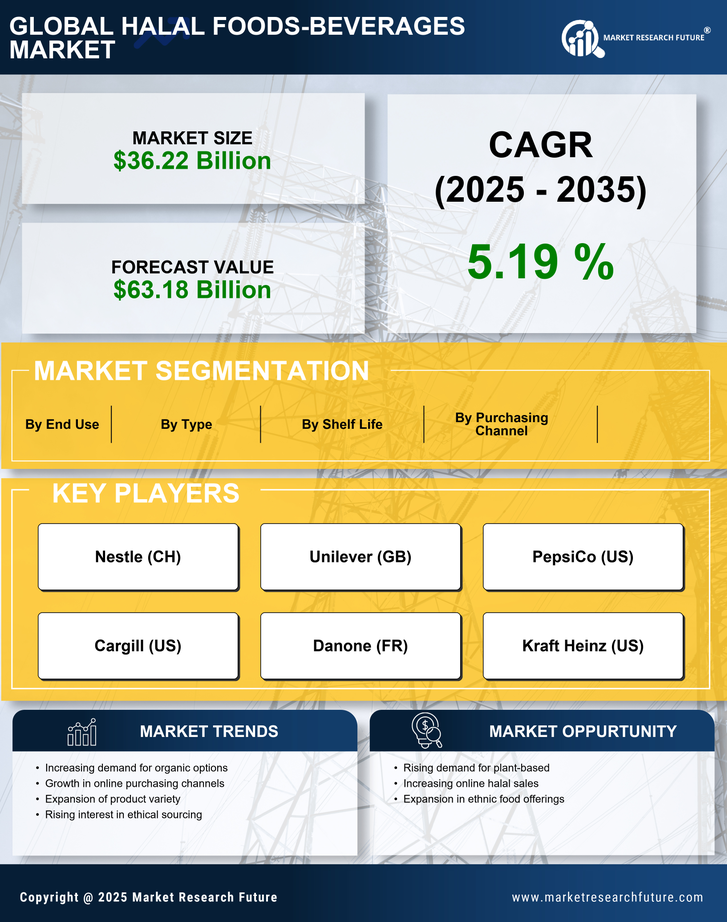
US Halal Foods Beverages Market By Type (USD Billion, 2025-2035)
- Meat
- Dairy
- Cereals
- Snacks
- Beverages
US Halal Foods Beverages Market By Purchasing Channel (USD Billion, 2025-2035)
- Online
- Supermarkets
- Convenience Stores
- Specialty Stores
US Halal Foods Beverages Market By Shelf Life (USD Billion, 2025-2035)
- Perishable
- Non-Perishable
- Frozen
- Chilled
US Halal Foods Beverages Market By End Use (USD Billion, 2025-2035)
- Residential
- Commercial
- Institutional