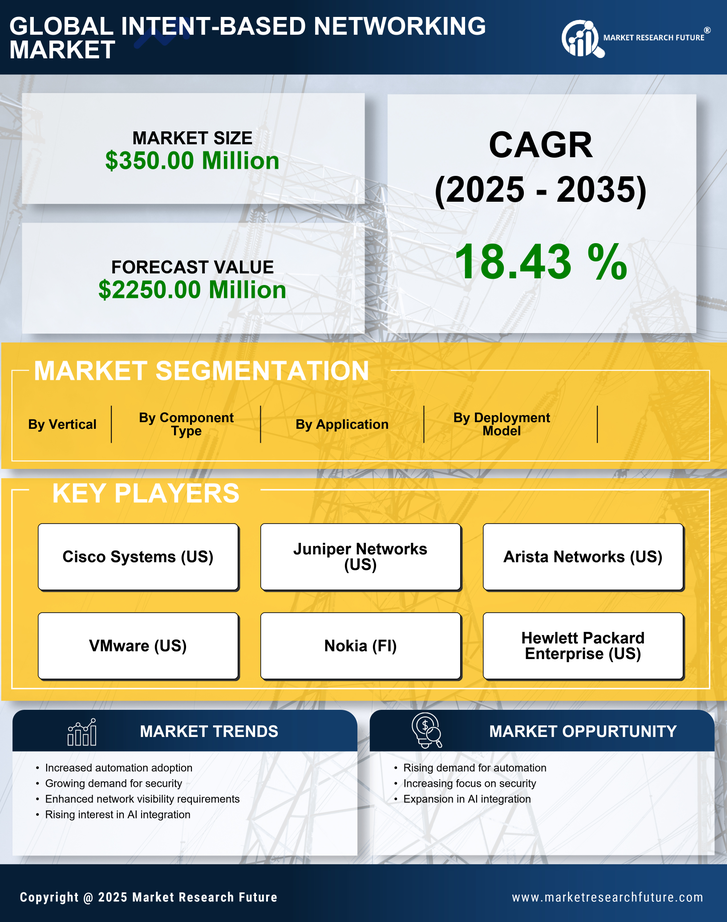
US Intent Based Networking Market

ID: MRFR/SEM/17240-HCR
200 Pages
Ankit Gupta
Last Updated: April 06, 2026
US Intent-Based Networking Market Size, Share and Research Report By Component Type (Networking Hardware Components, Software, Service), By Deployment Model (On-Premise, On Cloud), By Application (Healthcare, Government, Manufacturing, Telecom, Defense, BFSI) and By Vertical (Construction, Building, Telecomm, Healthcare) - Industry Forecast Till 2035
Download PDF ×

We do not share your information with anyone. However, we may send you emails based on your report interest from time to time. You may contact us at any time to opt-out.

  1. 1 SECTION I: EXECUTIVE SUMMARY AND KEY HIGHLIGHTS
    1. 1.1 EXECUTIVE SUMMARY
      1. 1.1.1 Market Overview
      2. 1.1.2 Key Findings
      3. 1.1.3 Market Segmentation
      4. 1.1.4 Competitive Landscape
      5. 1.1.5 Challenges and Opportunities
      6. 1.1.6 Future Outlook
  2. 2 SECTION II: SCOPING, METHODOLOGY AND MARKET STRUCTURE
    1. 2.1 MARKET INTRODUCTION
      1. 2.1.1 Definition
      2. 2.1.2 Scope of the study
        1. 2.1.2.1 Research Objective
        2. 2.1.2.2 Assumption
        3. 2.1.2.3 Limitations
    2. 2.2 RESEARCH METHODOLOGY
      1. 2.2.1 Overview
      2. 2.2.2 Data Mining
      3. 2.2.3 Secondary Research
      4. 2.2.4 Primary Research
        1. 2.2.4.1 Primary Interviews and Information Gathering Process
        2. 2.2.4.2 Breakdown of Primary Respondents
      5. 2.2.5 Forecasting Model
      6. 2.2.6 Market Size Estimation
        1. 2.2.6.1 Bottom-Up Approach
        2. 2.2.6.2 Top-Down Approach
      7. 2.2.7 Data Triangulation
      8. 2.2.8 Validation
  3. 3 SECTION III: QUALITATIVE ANALYSIS
    1. 3.1 MARKET DYNAMICS
      1. 3.1.1 Overview
      2. 3.1.2 Drivers
      3. 3.1.3 Restraints
      4. 3.1.4 Opportunities
    2. 3.2 MARKET FACTOR ANALYSIS
      1. 3.2.1 Value chain Analysis
      2. 3.2.2 Porter's Five Forces Analysis
        1. 3.2.2.1 Bargaining Power of Suppliers
        2. 3.2.2.2 Bargaining Power of Buyers
        3. 3.2.2.3 Threat of New Entrants
        4. 3.2.2.4 Threat of Substitutes
        5. 3.2.2.5 Intensity of Rivalry
      3. 3.2.3 COVID-19 Impact Analysis
        1. 3.2.3.1 Market Impact Analysis
        2. 3.2.3.2 Regional Impact
        3. 3.2.3.3 Opportunity and Threat Analysis
  4. 4 SECTION IV: QUANTITATIVE ANALYSIS
    1. 4.1 Semiconductor & Electronics, BY Component Type (USD Million)
      1. 4.1.1 Networking Hardware Components
      2. 4.1.2 Software
      3. 4.1.3 Service
    2. 4.2 Semiconductor & Electronics, BY Deployment Model (USD Million)
      1. 4.2.1 On-Premise
      2. 4.2.2 On Cloud
    3. 4.3 Semiconductor & Electronics, BY Application (USD Million)
      1. 4.3.1 Healthcare
      2. 4.3.2 Government
      3. 4.3.3 Manufacturing
      4. 4.3.4 Telecom
      5. 4.3.5 Defense
      6. 4.3.6 BFSI
    4. 4.4 Semiconductor & Electronics, BY Vertical (USD Million)
      1. 4.4.1 Construction
      2. 4.4.2 Building
      3. 4.4.3 Telecom
      4. 4.4.4 Healthcare
  5. 5 SECTION V: COMPETITIVE ANALYSIS
    1. 5.1 Competitive Landscape
      1. 5.1.1 Overview
      2. 5.1.2 Competitive Analysis
      3. 5.1.3 Market share Analysis
      4. 5.1.4 Major Growth Strategy in the Semiconductor & Electronics
      5. 5.1.5 Competitive Benchmarking
      6. 5.1.6 Leading Players in Terms of Number of Developments in the Semiconductor & Electronics
      7. 5.1.7 Key developments and growth strategies
        1. 5.1.7.1 New Product Launch/Service Deployment
        2. 5.1.7.2 Merger & Acquisitions
        3. 5.1.7.3 Joint Ventures
      8. 5.1.8 Major Players Financial Matrix
        1. 5.1.8.1 Sales and Operating Income
        2. 5.1.8.2 Major Players R&D Expenditure. 2023
    2. 5.2 Company Profiles
      1. 5.2.1 Cisco Systems (US)
        1. 5.2.1.1 Financial Overview
        2. 5.2.1.2 Products Offered
        3. 5.2.1.3 Key Developments
        4. 5.2.1.4 SWOT Analysis
        5. 5.2.1.5 Key Strategies
      2. 5.2.2 Juniper Networks (US)
        1. 5.2.2.1 Financial Overview
        2. 5.2.2.2 Products Offered
        3. 5.2.2.3 Key Developments
        4. 5.2.2.4 SWOT Analysis
        5. 5.2.2.5 Key Strategies
      3. 5.2.3 Arista Networks (US)
        1. 5.2.3.1 Financial Overview
        2. 5.2.3.2 Products Offered
        3. 5.2.3.3 Key Developments
        4. 5.2.3.4 SWOT Analysis
        5. 5.2.3.5 Key Strategies
      4. 5.2.4 VMware (US)
        1. 5.2.4.1 Financial Overview
        2. 5.2.4.2 Products Offered
        3. 5.2.4.3 Key Developments
        4. 5.2.4.4 SWOT Analysis
        5. 5.2.4.5 Key Strategies
      5. 5.2.5 Nokia (FI)
        1. 5.2.5.1 Financial Overview
        2. 5.2.5.2 Products Offered
        3. 5.2.5.3 Key Developments
        4. 5.2.5.4 SWOT Analysis
        5. 5.2.5.5 Key Strategies
      6. 5.2.6 Hewlett Packard Enterprise (US)
        1. 5.2.6.1 Financial Overview
        2. 5.2.6.2 Products Offered
        3. 5.2.6.3 Key Developments
        4. 5.2.6.4 SWOT Analysis
        5. 5.2.6.5 Key Strategies
      7. 5.2.7 Extreme Networks (US)
        1. 5.2.7.1 Financial Overview
        2. 5.2.7.2 Products Offered
        3. 5.2.7.3 Key Developments
        4. 5.2.7.4 SWOT Analysis
        5. 5.2.7.5 Key Strategies
      8. 5.2.8 Cumulus Networks (US)
        1. 5.2.8.1 Financial Overview
        2. 5.2.8.2 Products Offered
        3. 5.2.8.3 Key Developments
        4. 5.2.8.4 SWOT Analysis
        5. 5.2.8.5 Key Strategies
    3. 5.3 Appendix
      1. 5.3.1 References
      2. 5.3.2 Related Reports
  6. 6 LIST OF FIGURES
    1. 6.1 MARKET SYNOPSIS
    2. 6.2 US MARKET ANALYSIS BY COMPONENT TYPE
    3. 6.3 US MARKET ANALYSIS BY DEPLOYMENT MODEL
    4. 6.4 US MARKET ANALYSIS BY APPLICATION
    5. 6.5 US MARKET ANALYSIS BY VERTICAL
    6. 6.6 KEY BUYING CRITERIA OF SEMICONDUCTOR & ELECTRONICS
    7. 6.7 RESEARCH PROCESS OF MRFR
    8. 6.8 DRO ANALYSIS OF SEMICONDUCTOR & ELECTRONICS
    9. 6.9 DRIVERS IMPACT ANALYSIS: SEMICONDUCTOR & ELECTRONICS
    10. 6.10 RESTRAINTS IMPACT ANALYSIS: SEMICONDUCTOR & ELECTRONICS
    11. 6.11 SUPPLY / VALUE CHAIN: SEMICONDUCTOR & ELECTRONICS
    12. 6.12 SEMICONDUCTOR & ELECTRONICS, BY COMPONENT TYPE, 2024 (% SHARE)
    13. 6.13 SEMICONDUCTOR & ELECTRONICS, BY COMPONENT TYPE, 2024 TO 2035 (USD Million)
    14. 6.14 SEMICONDUCTOR & ELECTRONICS, BY DEPLOYMENT MODEL, 2024 (% SHARE)
    15. 6.15 SEMICONDUCTOR & ELECTRONICS, BY DEPLOYMENT MODEL, 2024 TO 2035 (USD Million)
    16. 6.16 SEMICONDUCTOR & ELECTRONICS, BY APPLICATION, 2024 (% SHARE)
    17. 6.17 SEMICONDUCTOR & ELECTRONICS, BY APPLICATION, 2024 TO 2035 (USD Million)
    18. 6.18 SEMICONDUCTOR & ELECTRONICS, BY VERTICAL, 2024 (% SHARE)
    19. 6.19 SEMICONDUCTOR & ELECTRONICS, BY VERTICAL, 2024 TO 2035 (USD Million)
    20. 6.20 BENCHMARKING OF MAJOR COMPETITORS
  7. 7 LIST OF TABLES
    1. 7.1 LIST OF ASSUMPTIONS
  8. 7.1.1
    1. 7.2 US MARKET SIZE ESTIMATES; FORECAST
      1. 7.2.1 BY COMPONENT TYPE, 2025-2035 (USD Million)
      2. 7.2.2 BY DEPLOYMENT MODEL, 2025-2035 (USD Million)
      3. 7.2.3 BY APPLICATION, 2025-2035 (USD Million)
      4. 7.2.4 BY VERTICAL, 2025-2035 (USD Million)
    2. 7.3 PRODUCT LAUNCH/PRODUCT DEVELOPMENT/APPROVAL
  9. 7.3.1
    1. 7.4 ACQUISITION/PARTNERSHIP
  10. 7.4.1

US Semiconductor & Electronics Market Segmentation

Semiconductor & Electronics By Component Type (USD Million, 2025-2035)

  • Networking Hardware Components
  • Software
  • Service

Semiconductor & Electronics By Deployment Model (USD Million, 2025-2035)

  • On-Premise
  • On Cloud

Semiconductor & Electronics By Application (USD Million, 2025-2035)

  • Healthcare
  • Government
  • Manufacturing
  • Telecom
  • Defense
  • BFSI

Semiconductor & Electronics By Vertical (USD Million, 2025-2035)

  • Construction
  • Building
  • Telecom
  • Healthcare