US Optical position sensor Market Segmentation
US Optical position sensor Market By Type (USD Million, 2025-2035)
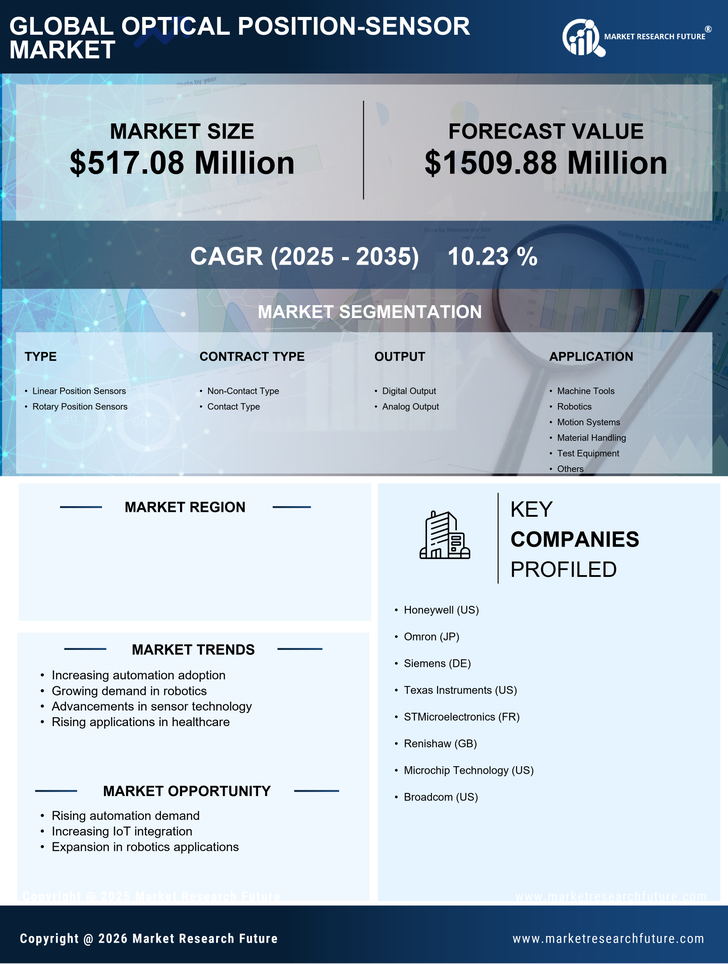
- Linear Position Sensors
- Rotary Position Sensors
US Optical position sensor Market By Contract Type (USD Million, 2025-2035)
- Non-Contact Type
- Contact Type
US Optical position sensor Market By Output (USD Million, 2025-2035)
- Digital Output
- Analog Output
US Optical position sensor Market By Application (USD Million, 2025-2035)
- Machine Tools
- Robotics
- Motion Systems
- Material Handling
- Test Equipment
- Others
US Optical position sensor Market By End-User (USD Million, 2025-2035)
- Manufacturing
- Automotive
- Aerospace
- Packaging
- US Optical position sensor Market
- Electronics
- Others