Request Free Sample ×

Kindly complete the form below to receive a free sample of this Report

* Please use a valid business email

Leading companies partner with us for data-driven Insights

clients tt-cursor
Hero Background

US RF Test Equipment Market

ID: MRFR/SEM/11646-HCR
200 Pages
Apoorva Priyadarshi
Last Updated: April 06, 2026
US RF Test Equipment Market Size, Share and Research Report By Connectivity (Oscilloscope, Spectrum Analyzers, Signal Generators, Network Analyzers, others), By Form Factor (Bench-Top, Portable, Modular), By Frequency (Between 1 GHz to 6 GHz, More than 6 GHz, Less than 1 GHz) and By End User (IT & Telecommunications, Aerospace & Defense, Consumer Electronics, Automotive, Academic & Research Institutions, Industrial, Medical, others) - Industry Forecast Till 2035
Download PDF ×

We do not share your information with anyone. However, we may send you emails based on your report interest from time to time. You may contact us at any time to opt-out.

  1. 1 SECTION I: EXECUTIVE SUMMARY AND KEY HIGHLIGHTS
    1. 1.1 EXECUTIVE SUMMARY
      1. 1.1.1 Market Overview
      2. 1.1.2 Key Findings
      3. 1.1.3 Market Segmentation
      4. 1.1.4 Competitive Landscape
      5. 1.1.5 Challenges and Opportunities
      6. 1.1.6 Future Outlook
  2. 2 SECTION II: SCOPING, METHODOLOGY AND MARKET STRUCTURE
    1. 2.1 MARKET INTRODUCTION
      1. 2.1.1 Definition
      2. 2.1.2 Scope of the study
        1. 2.1.2.1 Research Objective
        2. 2.1.2.2 Assumption
        3. 2.1.2.3 Limitations
    2. 2.2 RESEARCH METHODOLOGY
      1. 2.2.1 Overview
      2. 2.2.2 Data Mining
      3. 2.2.3 Secondary Research
      4. 2.2.4 Primary Research
        1. 2.2.4.1 Primary Interviews and Information Gathering Process
        2. 2.2.4.2 Breakdown of Primary Respondents
      5. 2.2.5 Forecasting Model
      6. 2.2.6 Market Size Estimation
        1. 2.2.6.1 Bottom-Up Approach
        2. 2.2.6.2 Top-Down Approach
      7. 2.2.7 Data Triangulation
      8. 2.2.8 Validation
  3. 3 SECTION III: QUALITATIVE ANALYSIS
    1. 3.1 MARKET DYNAMICS
      1. 3.1.1 Overview
      2. 3.1.2 Drivers
      3. 3.1.3 Restraints
      4. 3.1.4 Opportunities
    2. 3.2 MARKET FACTOR ANALYSIS
      1. 3.2.1 Value chain Analysis
      2. 3.2.2 Porter's Five Forces Analysis
        1. 3.2.2.1 Bargaining Power of Suppliers
        2. 3.2.2.2 Bargaining Power of Buyers
        3. 3.2.2.3 Threat of New Entrants
        4. 3.2.2.4 Threat of Substitutes
        5. 3.2.2.5 Intensity of Rivalry
      3. 3.2.3 COVID-19 Impact Analysis
        1. 3.2.3.1 Market Impact Analysis
        2. 3.2.3.2 Regional Impact
        3. 3.2.3.3 Opportunity and Threat Analysis
  4. 4 SECTION IV: QUANTITATIVE ANALYSIS
    1. 4.1 Semiconductor & Electronics, BY Connectivity (USD Million)
      1. 4.1.1 Oscilloscopes
      2. 4.1.2 Spectrum Analyzers
      3. 4.1.3 Signal Generators
      4. 4.1.4 Network Analyzers
      5. 4.1.5 Others
    2. 4.2 Semiconductor & Electronics, BY Form Factor (USD Million)
      1. 4.2.1 Bench-Top
      2. 4.2.2 Portable
      3. 4.2.3 Modular
    3. 4.3 Semiconductor & Electronics, BY Frequency (USD Million)
      1. 4.3.1 Less than 1 GHz
      2. 4.3.2 Between 1 and 6 GHz
      3. 4.3.3 More than 6 GHz
    4. 4.4 Semiconductor & Electronics, BY End User (USD Million)
      1. 4.4.1 IT & Telecommunications
      2. 4.4.2 Aerospace & Defense
      3. 4.4.3 Consumer Electronics
      4. 4.4.4 Automotive
      5. 4.4.5 Academic & Research Institutions
      6. 4.4.6 Industrial
      7. 4.4.7 Medical
      8. 4.4.8 Others
  5. 5 SECTION V: COMPETITIVE ANALYSIS
    1. 5.1 Competitive Landscape
      1. 5.1.1 Overview
      2. 5.1.2 Competitive Analysis
      3. 5.1.3 Market share Analysis
      4. 5.1.4 Major Growth Strategy in the Semiconductor & Electronics
      5. 5.1.5 Competitive Benchmarking
      6. 5.1.6 Leading Players in Terms of Number of Developments in the Semiconductor & Electronics
      7. 5.1.7 Key developments and growth strategies
        1. 5.1.7.1 New Product Launch/Service Deployment
        2. 5.1.7.2 Merger & Acquisitions
        3. 5.1.7.3 Joint Ventures
      8. 5.1.8 Major Players Financial Matrix
        1. 5.1.8.1 Sales and Operating Income
        2. 5.1.8.2 Major Players R&D Expenditure. 2023
    2. 5.2 Company Profiles
      1. 5.2.1 Keysight Technologies (US)
        1. 5.2.1.1 Financial Overview
        2. 5.2.1.2 Products Offered
        3. 5.2.1.3 Key Developments
        4. 5.2.1.4 SWOT Analysis
        5. 5.2.1.5 Key Strategies
      2. 5.2.2 Rohde & Schwarz (DE)
        1. 5.2.2.1 Financial Overview
        2. 5.2.2.2 Products Offered
        3. 5.2.2.3 Key Developments
        4. 5.2.2.4 SWOT Analysis
        5. 5.2.2.5 Key Strategies
      3. 5.2.3 Anritsu Corporation (JP)
        1. 5.2.3.1 Financial Overview
        2. 5.2.3.2 Products Offered
        3. 5.2.3.3 Key Developments
        4. 5.2.3.4 SWOT Analysis
        5. 5.2.3.5 Key Strategies
      4. 5.2.4 Tektronix (US)
        1. 5.2.4.1 Financial Overview
        2. 5.2.4.2 Products Offered
        3. 5.2.4.3 Key Developments
        4. 5.2.4.4 SWOT Analysis
        5. 5.2.4.5 Key Strategies
      5. 5.2.5 National Instruments (US)
        1. 5.2.5.1 Financial Overview
        2. 5.2.5.2 Products Offered
        3. 5.2.5.3 Key Developments
        4. 5.2.5.4 SWOT Analysis
        5. 5.2.5.5 Key Strategies
      6. 5.2.6 Viavi Solutions (US)
        1. 5.2.6.1 Financial Overview
        2. 5.2.6.2 Products Offered
        3. 5.2.6.3 Key Developments
        4. 5.2.6.4 SWOT Analysis
        5. 5.2.6.5 Key Strategies
      7. 5.2.7 Cobham Wireless (GB)
        1. 5.2.7.1 Financial Overview
        2. 5.2.7.2 Products Offered
        3. 5.2.7.3 Key Developments
        4. 5.2.7.4 SWOT Analysis
        5. 5.2.7.5 Key Strategies
      8. 5.2.8 Spirent Communications (GB)
        1. 5.2.8.1 Financial Overview
        2. 5.2.8.2 Products Offered
        3. 5.2.8.3 Key Developments
        4. 5.2.8.4 SWOT Analysis
        5. 5.2.8.5 Key Strategies
      9. 5.2.9 LitePoint (US)
        1. 5.2.9.1 Financial Overview
        2. 5.2.9.2 Products Offered
        3. 5.2.9.3 Key Developments
        4. 5.2.9.4 SWOT Analysis
        5. 5.2.9.5 Key Strategies
    3. 5.3 Appendix
      1. 5.3.1 References
      2. 5.3.2 Related Reports
  6. 6 LIST OF FIGURES
    1. 6.1 MARKET SYNOPSIS
    2. 6.2 US MARKET ANALYSIS BY CONNECTIVITY
    3. 6.3 US MARKET ANALYSIS BY FORM FACTOR
    4. 6.4 US MARKET ANALYSIS BY FREQUENCY
    5. 6.5 US MARKET ANALYSIS BY END USER
    6. 6.6 KEY BUYING CRITERIA OF SEMICONDUCTOR & ELECTRONICS
    7. 6.7 RESEARCH PROCESS OF MRFR
    8. 6.8 DRO ANALYSIS OF SEMICONDUCTOR & ELECTRONICS
    9. 6.9 DRIVERS IMPACT ANALYSIS: SEMICONDUCTOR & ELECTRONICS
    10. 6.10 RESTRAINTS IMPACT ANALYSIS: SEMICONDUCTOR & ELECTRONICS
    11. 6.11 SUPPLY / VALUE CHAIN: SEMICONDUCTOR & ELECTRONICS
    12. 6.12 SEMICONDUCTOR & ELECTRONICS, BY CONNECTIVITY, 2024 (% SHARE)
    13. 6.13 SEMICONDUCTOR & ELECTRONICS, BY CONNECTIVITY, 2024 TO 2035 (USD Million)
    14. 6.14 SEMICONDUCTOR & ELECTRONICS, BY FORM FACTOR, 2024 (% SHARE)
    15. 6.15 SEMICONDUCTOR & ELECTRONICS, BY FORM FACTOR, 2024 TO 2035 (USD Million)
    16. 6.16 SEMICONDUCTOR & ELECTRONICS, BY FREQUENCY, 2024 (% SHARE)
    17. 6.17 SEMICONDUCTOR & ELECTRONICS, BY FREQUENCY, 2024 TO 2035 (USD Million)
    18. 6.18 SEMICONDUCTOR & ELECTRONICS, BY END USER, 2024 (% SHARE)
    19. 6.19 SEMICONDUCTOR & ELECTRONICS, BY END USER, 2024 TO 2035 (USD Million)
    20. 6.20 BENCHMARKING OF MAJOR COMPETITORS
  7. 7 LIST OF TABLES
    1. 7.1 LIST OF ASSUMPTIONS
  8. 7.1.1
    1. 7.2 US MARKET SIZE ESTIMATES; FORECAST
      1. 7.2.1 BY CONNECTIVITY, 2025-2035 (USD Million)
      2. 7.2.2 BY FORM FACTOR, 2025-2035 (USD Million)
      3. 7.2.3 BY FREQUENCY, 2025-2035 (USD Million)
      4. 7.2.4 BY END USER, 2025-2035 (USD Million)
    2. 7.3 PRODUCT LAUNCH/PRODUCT DEVELOPMENT/APPROVAL
  9. 7.3.1
    1. 7.4 ACQUISITION/PARTNERSHIP
  10. 7.4.1

US Semiconductor & Electronics Market Segmentation

Semiconductor & Electronics By Connectivity (USD Million, 2025-2035)
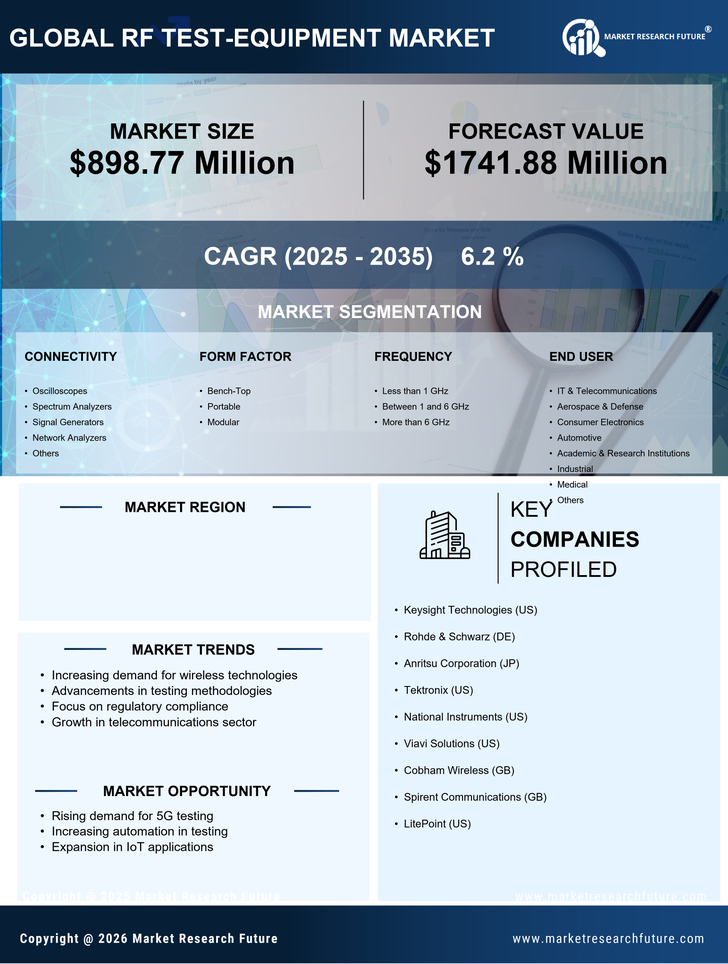
  • Oscilloscopes
  • Spectrum Analyzers
  • Signal Generators
  • Network Analyzers
  • Others

Semiconductor & Electronics By Form Factor (USD Million, 2025-2035)

  • Bench-Top
  • Portable
  • Modular

Semiconductor & Electronics By Frequency (USD Million, 2025-2035)

  • Less than 1 GHz
  • Between 1 and 6 GHz
  • More than 6 GHz

Semiconductor & Electronics By End User (USD Million, 2025-2035)

  • IT & Telecommunications
  • Aerospace & Defense
  • Consumer Electronics
  • Automotive
  • Academic & Research Institutions
  • Industrial
  • Medical
  • Others