Download Free Sample
Kindly complete the form below to receive a free sample of this Report
Vehicle Inspection Services Market Research Report: Size, Share, Trend Analysis By End Use Outlook (Individual Vehicle Owners, Fleet Operators, Government Agencies, Insurance Companies, Automotive Dealerships) By Application Outlook (Pre-Purchase Inspection, Routine Maintenance Inspection, Safety Inspection, Emissions Inspection, Post-Accident Inspection) By Vehicle Type Outlook (Passenger Vehicles, Commercial Vehicles, Motorcycles, Heavy-Duty Vehicles, Electric Vehicles) By Inspection Type Outlook (Visual Inspection, Mechanical Inspection, Emissions Testing, Safety Compliance Testing, Diagnostic Testing) By Service Provider Outlook (Independent Inspection Stations, Automotive Dealerships, Government Inspection Facilities, Mobile Inspection Services, Third-Party Inspection Services) By Region (North America, Europe, APAC, South America, MEA) - Growth Outlook & Industry Forecast To 2035
As per MRFR analysis, the Vehicle Inspection Services Market Size was estimated at 15.0 USD Billion in 2024. The Vehicle Inspection Services industry is projected to grow from 15.53 USD Billion in 2025 to 22.0 by 2035, exhibiting a compound annual growth rate (CAGR) of 3.54% during the forecast period 2025 - 2035.
The Vehicle Inspection Services market is experiencing a transformative shift driven by technology and regulatory demands.
| 2024 Market Size | 15.0 (USD Billion) |
| 2035 Market Size | 22.0 (USD Billion) |
| CAGR (2025 - 2035) | 3.54% |
SGS (CH), Bureau Veritas (FR), Intertek (GB), TÜV Rheinland (DE), DEKRA (DE), Applus+ (ES), Element Materials Technology (GB), Apex Companies (US)
Our Impact
Enabled $4.3B Revenue Impact for Fortune 500 and Leading Multinationals
Partnering with 2000+ Global Organizations Each Year
30K+ Citations by Top-Tier Firms in the Industry
The landscape of Vehicle Inspection Services is evolving, driven by technological advancements and increasing regulatory demands. As consumers become more aware of vehicle safety and environmental impacts, the need for thorough inspections has intensified. This sector appears to be experiencing a shift towards more comprehensive and efficient inspection processes, integrating digital tools and automated systems. Such innovations not only enhance accuracy but also streamline operations, potentially reducing wait times for customers. Furthermore, the growing emphasis on sustainability suggests that inspection services may increasingly focus on eco-friendly practices, aligning with broader environmental goals. In addition, the regulatory environment surrounding Vehicle Inspection Services is becoming more stringent. Governments worldwide are implementing stricter guidelines to ensure vehicle safety and emissions compliance. This trend indicates a potential increase in demand for inspection services, as vehicle owners seek to adhere to these regulations. The combination of technological integration and regulatory pressures may lead to a more robust and dynamic market, where service providers must adapt to meet evolving consumer expectations and legal requirements.
The incorporation of advanced technologies into Vehicle Inspection Services is transforming traditional practices. Digital tools, such as mobile applications and automated inspection systems, enhance the efficiency and accuracy of inspections. This trend suggests a move towards more streamlined processes, potentially improving customer satisfaction.
As governments enforce stricter regulations regarding vehicle safety and emissions, the demand for Vehicle Inspection Services is likely to rise. Service providers may need to adapt their offerings to ensure compliance with these evolving standards, which could lead to increased business opportunities.
There is a growing emphasis on eco-friendly practices within Vehicle Inspection Services. This trend indicates that service providers may increasingly adopt sustainable methods, aligning their operations with broader environmental goals and appealing to environmentally conscious consumers.
Economic conditions play a pivotal role in shaping the Vehicle Inspection Services Industry. Fluctuations in disposable income and consumer spending can directly impact the frequency of vehicle inspections. During periods of economic growth, individuals are more likely to invest in vehicle maintenance, thereby increasing demand for inspection services. Conversely, economic downturns may lead to reduced spending on non-essential services. However, the essential nature of vehicle inspections for safety compliance suggests a baseline demand that remains relatively stable. The industry is expected to navigate these economic fluctuations, with a projected growth rate of 3% as it adapts to changing consumer behaviors.
Regulatory compliance remains a critical driver in the Vehicle Inspection Services Industry. Governments worldwide are implementing stricter vehicle safety and emissions standards to ensure public safety and environmental protection. For example, recent legislation mandates more frequent inspections for commercial vehicles, thereby increasing the demand for inspection services. This regulatory landscape compels service providers to stay updated with compliance requirements, which can be resource-intensive. However, those who adapt effectively may find opportunities for growth, as compliance-driven inspections are expected to rise by 7% in the coming years, reflecting a growing emphasis on safety and environmental responsibility.
The Vehicle Inspection Services Industry is increasingly influenced by sustainability initiatives aimed at reducing carbon footprints and promoting eco-friendly practices. As governments and organizations prioritize environmental sustainability, there is a growing emphasis on the inspection of emissions and fuel efficiency. This shift encourages vehicle owners to seek inspection services that align with sustainability goals. Moreover, the rise of electric vehicles necessitates specialized inspection services, further diversifying the market. The industry's adaptation to these sustainability trends could lead to a projected growth of 4% in the sector, as more consumers opt for environmentally responsible vehicle maintenance.
The Vehicle Inspection Services Industry is experiencing a notable transformation due to rapid technological advancements. Innovations such as automated inspection systems, advanced diagnostic tools, and artificial intelligence are enhancing the accuracy and efficiency of vehicle assessments. For instance, the integration of AI-driven analytics allows for real-time data processing, which can identify potential issues before they escalate. This shift not only improves service quality but also reduces operational costs for inspection facilities. As a result, the industry is likely to see increased demand for technologically equipped service providers, with a projected growth rate of approximately 5% annually over the next five years.
Consumer awareness regarding vehicle safety is a significant driver in the Vehicle Inspection Services Industry. As individuals become more informed about the importance of regular vehicle maintenance and safety checks, the demand for inspection services is likely to increase. Public campaigns and educational initiatives have heightened awareness about the risks associated with neglected vehicle inspections. Consequently, consumers are more inclined to seek professional services to ensure their vehicles meet safety standards. This trend is expected to contribute to a steady growth in the industry, with an estimated increase in service utilization by 6% over the next few years.
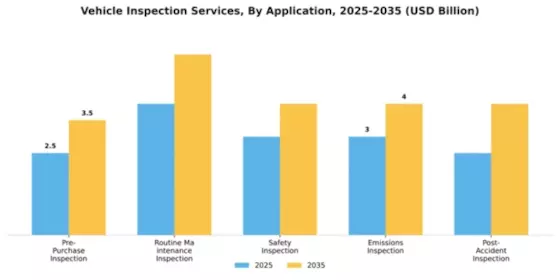
In the Vehicle Inspection Services market, the Pre-Purchase Inspection segment holds the largest share, as potential buyers consider this service crucial for making informed vehicle purchases. In comparison, the Safety Inspection segment is rapidly gaining traction, driven by increasing regulatory mandates and a heightened focus on road safety among consumers. Routine Maintenance and Emissions Inspections follow closely in terms of market relevance, catering to regular vehicle upkeep and environmental compliance respectively.
Safety Inspection (Dominant) vs. Emissions Inspection (Emerging)
The Safety Inspection segment is dominant in the Vehicle Inspection Services market, benefiting from stringent government regulations and a societal commitment to road safety. This segment focuses on ensuring vehicles meet safety standards, thus reducing accidents and fostering consumer trust. Conversely, the Emissions Inspection segment is emerging, propelled by the growing awareness of environmental issues and stricter emissions regulations. While not as established, this segment shows promise as consumers and regulatory bodies increasingly prioritize environmental sustainability, creating a dynamic landscape where both segments play vital roles.
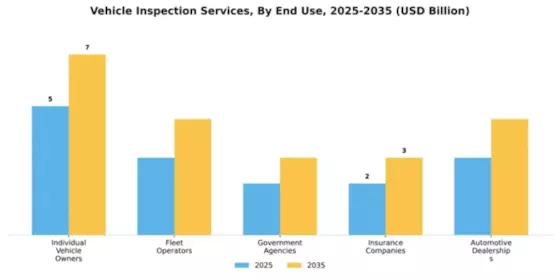
The Vehicle Inspection Services market shows a diverse distribution across its end-use segments, with Individual Vehicle Owners representing the largest share. This segment thrives on the continuous need for personal vehicle maintenance and compliance with regulations. Conversely, Fleet Operators are gaining traction rapidly as businesses recognize the importance of maintaining vehicle safety and efficiency in their fleets. This segment is becoming increasingly significant due to the rising number of commercial vehicles on the road. In recent years, the Vehicle Inspection Services market has witnessed notable growth in Fleet Operators, propelled by the expansion of logistics and transportation sectors. With the growing emphasis on operational efficiency and safety regulations, fleet operators are increasingly prioritizing vehicle inspections. Moreover, the rise of technology integration into fleet management is also supporting the demand for timely and thorough inspections to ensure regulatory compliance and vehicle uptime.
Individual Vehicle Owners (Dominant) vs. Fleet Operators (Emerging)
Individual Vehicle Owners hold a dominant position in the Vehicle Inspection Services market, driven by consistent personal vehicle ownership and the need for regular inspections to meet legal requirements. This segment focuses on enhancing vehicle safety and ensuring compliance with regulations. Consumers in this category are increasingly aware of the importance of regular vehicle maintenance, leading to repeat inspections and fostering customer loyalty. On the other hand, Fleet Operators represent an emerging segment that is rapidly gaining ground. As businesses grow and depend on transportation for operations, the importance of regular inspections to maintain vehicle performance and compliance becomes crucial. Fleet Operators are adopting advanced technologies for monitoring and managing inspections, thus improving fleet safety and efficiency, making them a key player in the market.
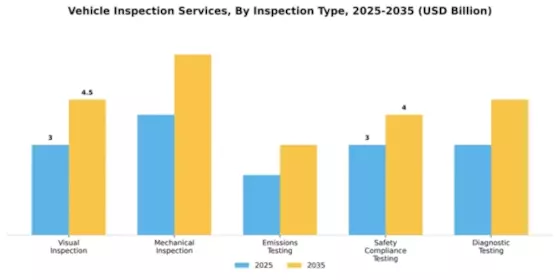
The Vehicle Inspection Services market is characterized by a diverse range of inspection types. Visual Inspection dominates the segment, making up a significant portion of the overall market share due to its fundamental role in assessing vehicle safety and function. Following this, Mechanical Inspection and Safety Compliance Testing also hold substantial shares, though not as prominent as Visual Inspection. Emissions Testing, while crucial for regulatory compliance, occupies a smaller slice of the market but is growing rapidly alongside increasing environmental awareness and legislative pressures.
Visual Inspection (Dominant) vs. Emissions Testing (Emerging)
Visual Inspection remains the cornerstone of the Vehicle Inspection Services market, primarily due to its widespread use in initial assessments and vehicle safety checks. This method enables inspectors to easily identify visible issues that could compromise vehicle safety. On the other hand, Emissions Testing is rapidly emerging as an essential service, driven by stricter government regulations and heightened public concern over air quality. The shift towards cleaner vehicles is further propelling innovation in emissions testing methodologies, making it an increasingly vital service that complements more traditional inspection types.
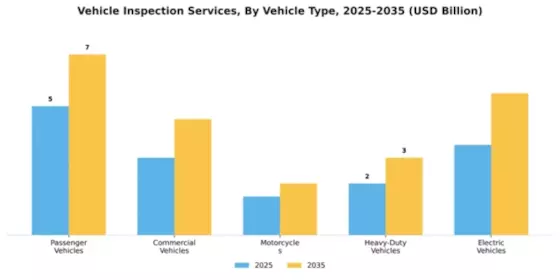
The Vehicle Inspection Services market is predominantly influenced by passenger vehicles, which account for a significant share of the total inspections conducted. These vehicles form the backbone of personal mobility, leading to a stable demand for inspection services due to regulatory requirements and consumer awareness about vehicle safety and maintenance. In contrast, commercial vehicles hold a notable share as well, reflecting the need for businesses to ensure operational compliance and safety standards in their fleet management. Additionally, motorcycles and heavy-duty vehicles collectively contribute to a smaller portion of the market, driven by specialized inspection services catered to these specific segments.
Passenger Vehicles: Dominant vs. Electric Vehicles: Emerging
Passenger vehicles remain the dominant segment within the Vehicle Inspection Services market, characterized by their widespread use and regular maintenance inspections mandated by law. Their popularity translates to a consistent requirement for thorough inspections, addressing safety, emissions, and performance parameters. In contrast, electric vehicles represent an emerging segment, rapidly gaining traction due to the global shift towards sustainable transportation. As more electric vehicles enter the market, the demand for specialized inspection services that cater to their unique components, such as battery systems and electric drivetrains, is expected to grow. This evolution presents both a challenge and an opportunity for service providers to adapt their offerings to meet the increasingly diverse needs of vehicle owners.
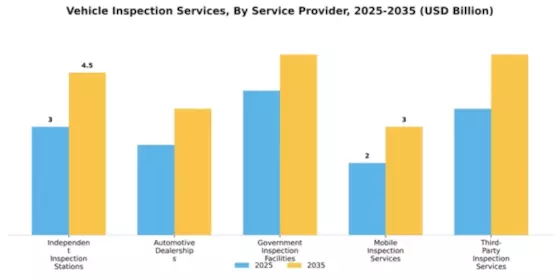
The Vehicle Inspection Services market is being shaped significantly by the varying contributions of service providers. Independent Inspection Stations hold the largest share in this sector, capitalizing on their established reputations and extensive client bases. Automotive Dealerships and Government Inspection Facilities also play notable roles, providing comprehensive vehicle checks and regulatory compliance. Mobile Inspection Services, while currently smaller, are increasingly gaining traction due to their convenience and accessibility, appealing to busy consumers.
Mobile Inspection Services (Dominant) vs. Third-Party Inspection Services (Emerging)
Mobile Inspection Services have rapidly transformed the landscape of vehicle inspections by offering on-site convenience, making them a dominant player in today's market. These services leverage advanced technology to deliver quick and efficient inspections directly to customers. In contrast, Third-Party Inspection Services are emerging as a valuable alternative, providing specialized and unbiased inspections, thereby gaining trust among consumers. As regulations tighten and vehicle maintenance awareness grows, both segments are expected to flourish, albeit with different value propositions that cater to distinct consumer needs.
Get more detailed insights about Vehicle Inspection Services Market Request Free Sample
North America is poised to maintain its leadership in the vehicle inspection services market, holding a significant share of 6.0 in 2025. The growth is driven by stringent regulatory requirements, increasing vehicle safety concerns, and a rising number of vehicles on the road. The demand for comprehensive inspection services is further fueled by advancements in technology and a growing emphasis on environmental standards. The competitive landscape is characterized by key players such as SGS, Bureau Veritas, and Apex Companies, which are leveraging innovative technologies to enhance service delivery. The U.S. and Canada are the leading countries in this region, with robust regulatory frameworks that mandate regular inspections. This ensures a steady demand for vehicle inspection services, positioning North America as a critical market for industry growth.
Europe's vehicle inspection services market is projected to reach 4.5 by 2025, driven by stringent EU regulations aimed at enhancing road safety and environmental protection. The increasing focus on emissions testing and vehicle safety standards is propelling demand for inspection services across member states. Additionally, the rise in electric vehicles necessitates new inspection protocols, further stimulating market growth. Leading countries in this region include Germany, France, and the UK, where major players like TÜV Rheinland and DEKRA dominate the landscape. The competitive environment is marked by a mix of established firms and emerging players, all striving to meet the evolving regulatory requirements. The European market is characterized by a high level of compliance, ensuring that vehicle inspection services remain a vital component of the automotive ecosystem.
The Asia-Pacific region is witnessing significant growth in vehicle inspection services, with a market size of 3.0 USD Billion projected for 2025. This growth is driven by increasing vehicle ownership, urbanization, and rising safety awareness among consumers. Governments are also implementing stricter regulations to enhance road safety and reduce emissions, further boosting demand for inspection services across the region. Countries like China, Japan, and India are leading the charge, with a competitive landscape featuring both local and international players. Companies such as Intertek and Applus+ are expanding their operations to cater to the growing demand. The region's diverse regulatory environment presents both challenges and opportunities, as stakeholders navigate varying standards and practices in vehicle inspections.
The Middle East and Africa region is emerging as a developing market for vehicle inspection services, with a projected size of 1.5 USD Billion by 2025. The growth is primarily driven by increasing vehicle registrations and a growing awareness of road safety. Governments are beginning to implement regulations that mandate regular inspections, which is expected to further stimulate market demand in the coming years. Leading countries in this region include South Africa and the UAE, where the presence of key players like Element Materials Technology is notable. The competitive landscape is still evolving, with opportunities for both local and international firms to establish a foothold. As regulatory frameworks become more robust, the demand for vehicle inspection services is anticipated to rise, paving the way for market expansion.
The Vehicle Inspection Services market is characterized by a competitive landscape that is increasingly shaped by technological advancements and regulatory requirements. Key players such as SGS (CH), Bureau Veritas (FR), and TÜV Rheinland (DE) are strategically positioned to leverage innovation and digital transformation to enhance service delivery. These companies are focusing on expanding their operational capabilities through mergers and acquisitions, partnerships, and regional expansions, which collectively contribute to a dynamic competitive environment. The emphasis on compliance with stringent safety and environmental regulations further drives the demand for comprehensive inspection services, thereby intensifying competition among these major players.In terms of business tactics, companies are increasingly localizing their operations to better serve regional markets while optimizing their supply chains for efficiency. The market structure appears moderately fragmented, with several key players holding substantial market shares. This fragmentation allows for a diverse range of services and competitive strategies, as companies strive to differentiate themselves through quality, reliability, and technological integration.In November SGS (CH) announced the launch of a new digital platform aimed at streamlining the vehicle inspection process. This platform is designed to enhance customer experience by providing real-time updates and facilitating remote inspections. The strategic importance of this initiative lies in its potential to reduce operational costs and improve service efficiency, thereby positioning SGS as a leader in digital transformation within the industry.Similarly, in October 2025, Bureau Veritas (FR) expanded its service offerings by acquiring a regional inspection company in Eastern Europe. This acquisition is expected to enhance Bureau Veritas's market presence and operational capabilities in a rapidly growing region. The strategic move underscores the company's commitment to expanding its footprint and adapting to local market demands, which may lead to increased revenue streams and customer loyalty.In September TÜV Rheinland (DE) launched a sustainability initiative aimed at reducing the carbon footprint of its inspection services. This initiative includes the implementation of eco-friendly practices and technologies in their operations. The strategic significance of this move is twofold: it not only aligns with global sustainability trends but also enhances the company's reputation as a responsible service provider, potentially attracting environmentally conscious clients.As of December the competitive trends in the Vehicle Inspection Services market are increasingly defined by digitalization, sustainability, and the integration of artificial intelligence. Strategic alliances among key players are shaping the landscape, fostering innovation and enhancing service delivery. The shift from price-based competition to a focus on technological advancement and supply chain reliability is evident, suggesting that future competitive differentiation will hinge on the ability to innovate and adapt to evolving market demands.

The Vehicle Inspection Services market is projected to grow at a 3.54% CAGR from 2025 to 2035, driven by technological advancements, regulatory changes, and increasing vehicle safety concerns.
New opportunities lie in:
By 2035, the market is expected to be robust, driven by innovation and evolving consumer demands.
| MARKET SIZE 2024 | 15.0 (USD Billion) |
| MARKET SIZE 2025 | 15.53 (USD Billion) |
| MARKET SIZE 2035 | 22.0 (USD Billion) |
| COMPOUND ANNUAL GROWTH RATE (CAGR) | 3.54% (2025 - 2035) |
| REPORT COVERAGE | Revenue Forecast, Competitive Landscape, Growth Factors, and Trends |
| BASE YEAR | 2024 |
| Market Forecast Period | 2025 - 2035 |
| Historical Data | 2019 - 2024 |
| Market Forecast Units | USD Billion |
| Key Companies Profiled | SGS (CH), Bureau Veritas (FR), Intertek (GB), TÜV Rheinland (DE), DEKRA (DE), Applus+ (ES), Element Materials Technology (GB), Apex Companies (US) |
| Segments Covered | Application, End Use, Inspection Type, Vehicle Type, Service Provider |
| Key Market Opportunities | Integration of advanced diagnostic technologies enhances efficiency in Vehicle Inspection Services. |
| Key Market Dynamics | Rising regulatory scrutiny and technological advancements drive innovation and competition in vehicle inspection services. |
| Countries Covered | North America, Europe, APAC, South America, MEA |
The market valuation of Vehicle Inspection Services was 15.0 USD Billion in 2024.
The projected market size for Vehicle Inspection Services is expected to reach 22.0 USD Billion by 2035.
The expected CAGR for the Vehicle Inspection Services market during the forecast period 2025 - 2035 is 3.54%.
Key players in the Vehicle Inspection Services market include SGS, Bureau Veritas, Intertek, TÜV Rheinland, DEKRA, Applus+, Element Materials Technology, and Apex Companies.
The main application segments include Pre-Purchase Inspection, Routine Maintenance Inspection, Safety Inspection, Emissions Inspection, and Post-Accident Inspection.
Individual vehicle owners contributed between 5.0 and 7.0 USD Billion to the Vehicle Inspection Services market.
The emissions inspection segment is valued between 3.0 and 4.0 USD Billion.
Types of inspections include Visual Inspection, Mechanical Inspection, Emissions Testing, Safety Compliance Testing, and Diagnostic Testing.
The valuation range for the commercial vehicles segment is between 3.0 and 4.5 USD Billion.
Dominant service providers include Independent Inspection Stations, Automotive Dealerships, Government Inspection Facilities, Mobile Inspection Services, and Third-Party Inspection Services.


Kindly complete the form below to receive a free sample of this Report

“This is really good guys. Excellent work on a tight deadline. I will continue to use you going forward and recommend you to others. Nice job”


“Thanks. It’s been a pleasure working with you, please use me as reference with any other Intel employees.”


“Thanks for sending the report it gives us a good global view of the Betaïne market.”


“Thank you, this will be very helpful for OQS.”


“We found the report very insightful! we found your research firm very helpful. I'm sending this email to secure our future business.”


“I am very pleased with how market segments have been defined in a relevant way for my purposes (such as "Portable Freezers & refrigerators" and "last-mile"). In general the report is well structured. Thanks very much for your efforts.”


“I have been reading the first document or the study, ,the Global HVAC and FP market report 2021 till 2026. Must say, good info! I have not gone in depth at all parts, but got a good indication of the data inside!”


“We got the report in time, we really thank you for your support in this process. I also thank to all of your team as they did a great job.”


“The Automotive 48V ECU Components Procurement Intelligence Study” was a complex project, but the Market Research Future (MRFR) team handled it with quality, agility, and customer-centricity. They delivered all requested data on time and within the agreed scope. The team, including Shubhendra Anand and Rahul Gotadki, was always readily available to clarify questions and swiftly implement necessary adjustments, driving the project to a successful conclusion within a very demanding timeframe.
I would also like to specifically commend Akshay Agarwal for his responsiveness and support at every stage—from our initial inquiry on May 6th through to final delivery on June 18th. His dedication made the entire process seamless.”



