Vending Machine Market

Key Players: Fuji Electric Co., Crane Merchandising Systems (Crane NXT), SandenVendo (Sanden Retail Systems), Azkoyen Group, Evoca Group, Bianchi Industry, Royal Vendors, Jofemar

Vending Machine Market

Vending Machine Market Research Report Information By Product Type (Beverage Vending Machines, Food & Snack Vending Machines, Combination Vending Machines, Specialty Vending Machines), By Technology (Semi-Automatic, Smart & Connected Fully Automatic), By End User (Commercial & Corporate, Retail & Public Spaces, Transportation Hubs, Healthcare & Education, Manufacturing & Industrial), and By Region (North America, Europe, Asia-Pacific, and Rest Of The World) - Growth & Industry Forecast to 2035
ID: MRFR/Equip/10484-HCR
128 Pages
Varsha More
Last Updated: June 17, 2026

Vending Machine Market Summary

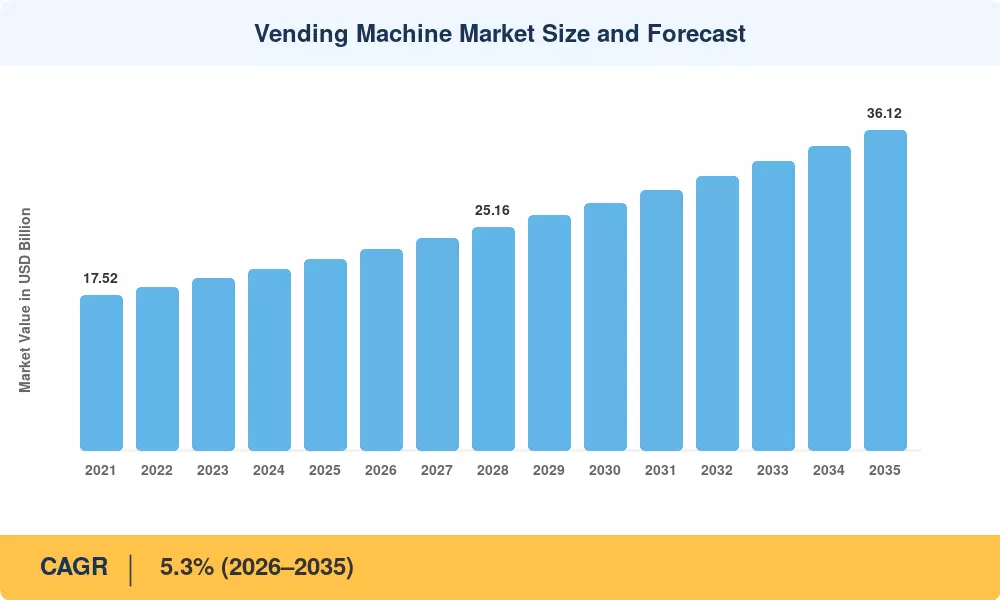
The global Vending Machine Market stood at an estimated USD 21.55 billion in 2025 and is projected to reach USD 36.12 billion by 2035, expanding at a compound annual growth rate of 5.3% during the 2026–2035 forecast window. Two catalysts anchor this trajectory: Japan's ongoing government-supported initiative to digitize 1.2 million legacy units [1], and the broader shift toward cashless retail infrastructure accelerated by post-pandemic consumer behavior. The Vending Machine Market has evolved well beyond coin-operated dispensers — it is now a software-defined retail channel attracting venture capital and strategic corporate investment.

Technology transformation sits at the core of this expansion. Traditional mechanical-lever machines, which still account for roughly a third of the installed base in emerging economies, are being replaced by telemetry-enabled, touchscreen-equipped units capable of real-time inventory management and dynamic pricing [2]. The European Vending & Coffee Service Association reported that operator capital expenditure on connected hardware exceeded USD 1.4 billion across the EU in 2024 alone, a figure expected to double by 2030 as regulators push for digital payment mandates.

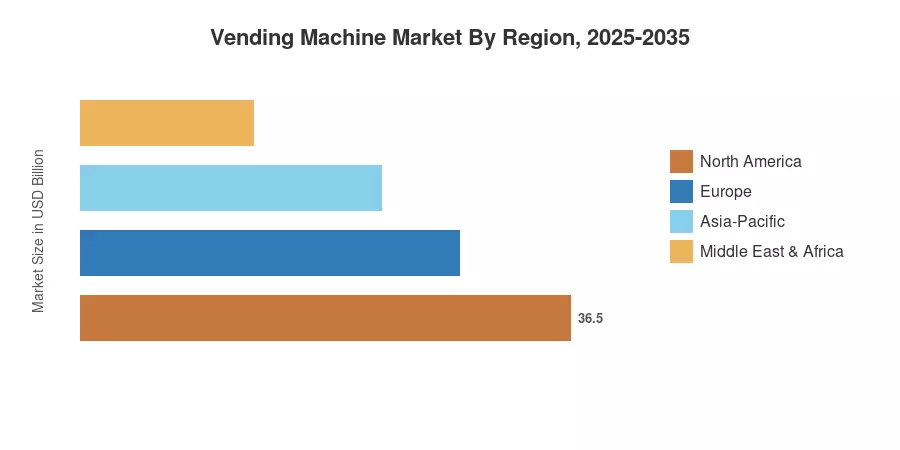
Asia-Pacific dominates the Vending Machine Market with approximately 38% of global revenue, driven by Japan's unmatched machine density of 1 unit per 23 people and China's rapid urban deployment [3]. North America holds the second-largest share at 28%, buoyed by micro-market conversions in corporate campuses. Europe trails at 22% but leads in sustainability-linked machine design. South America and the Middle East & Africa, though smaller at 7% and 5% respectively, represent the fastest expansion corridors outside Asia-Pacific, with urbanization rates above 3% annually fueling demand for automated retail touchpoints.


Key Report Takeaways

• By Product Type

  • Beverage vending machines command 34% of the Vending Machine Market, underpinned by hot and cold-drink demand in offices and transit stations.
  • Combination units are growing at a CAGR of 6.8%, the fastest among product categories, as operators consolidate SKU variety into single footprints.
  • Specialty machines — including those dispensing electronics, PPE, and pharmaceuticals — generated USD 3.45 billion in 2025.

• By Technology

  • Semi-automatic machines hold 42% market share but face displacement from smart connected units.
  • Smart and connected vending is the Vending Machine Market's fastest-growing technology segment at 8.2% CAGR.

• By Region

  • Asia-Pacific accounts for 38% of the Vending Machine Market, with Japan and China contributing over 70% of regional revenue.
  • North America's market reached USD 6.03 billion in 2025.
  • Middle East & Africa is forecast to grow at 7.1% CAGR, the highest among all regions.


Vending Machine Market Size and Forecast (2021–2035)

Market Research Future employs a triangulated methodology combining bottom-up operator revenue aggregation, top-down macroeconomic modeling, and primary interviews with 120+ vending operators, OEMs, and payment-platform providers across 18 countries. Historical figures reflect audited company filings and trade-body statistics; forecast projections are calibrated against the 5.3% CAGR validated through comparable third-party benchmarks.

Vending Machine Market Size and Forecast
Our Impact
Enabled $4.3B Revenue Impact for Fortune 500 and Leading Multinationals
Partnering with 2000+ Global Organizations Each Year
30K+ Citations by Top-Tier Firms in the Industry

Driver Impact Analysis

Driver ~% Impact on CAGR Geographic Relevance Impact Timeline
Cashless & digital payment adoption +1.4% Global Short-term (≤2 yr)
Urbanization & transit infrastructure +0.9% Asia-Pacific, MEA Long-term (≥4 yr)
IoT-enabled inventory optimization +0.8% North America, Europe Medium-term (2–4 yr)
Healthy & fresh-food consumer demand +0.6% North America, Europe Medium-term (2–4 yr)
Corporate micro-market conversions +0.5% North America Short-term (≤2 yr)
Government cashless-economy mandates +0.4% India, EU, Japan Medium-term (2–4 yr)
Aging-population convenience demand +0.3% Japan, South Korea Long-term (≥4 yr)


Cashless and Digital Payment Acceleration

The single largest growth lever for the Vending Machine Market is the migration from coin-operated to digital-payment-enabled units. In India, the Unified Payments Interface processed over 14 billion transactions monthly by late 2024, creating a ready infrastructure that vending operators such as Vendiman and Chai Point are leveraging to bypass the cash-handling cost problem that historically constrained deployment density.

Urbanization and Transit-Hub Expansion

The United Nations projects 68% of the global population will live in cities by 2050, adding 2.5 billion new urban residents [7]. Metro systems in Jakarta, Riyadh, and Lagos are each slated for 50+ station expansions by 2030, and vending concessions are written into nearly all new transit-authority RFPs.

IoT-Enabled Inventory and Route Optimization

Telemetry modules that report stock levels, temperature, and transaction data in real time have cut operator restocking costs by 15–20% and reduced spoilage by up to 30%, according to a 2024 study by the National Automatic Merchandising Association [2]. These savings directly expand operator margins and incentivize fleet expansion, particularly in the food-vending category, where perishability risk has historically limited deployment.

Healthy and Fresh-Food Demand Shift

Consumer appetite for fresh salads, fruit cups, and protein-rich snacks at the point of convenience has opened a premium price tier for the Vending Machine Market.


Restraints Impact Analysis

The restraint impact percentages represent estimated headwinds to the headline CAGR. As the driver impacts, these are directional and non-additive; structural overlap and geographic variation mean individual restraint estimates should not be summed.

Restraint ~% Impact on CAGR Geographic Relevance Impact Timeline
High upfront machine & retrofit costs –0.7% Global Short-term (≤2 yr)
Vandalism, theft & maintenance burden –0.5% South America, MEA Long-term (≥4 yr)
Regulatory fragmentation on food safety –0.4% EU, North America Medium-term (2–4 yr)
Power reliability & energy costs –0.3% Sub-Saharan Africa, South Asia Long-term (≥4 yr)
Consumer preference for manned retail –0.2% Southern Europe, South America Medium-term (2–4 yr)


Capital Intensity and Retrofit Economics

A full-service, refrigerated vending device will cost USD 8,000 to USD 15,000, depending on setup, vs. USD 3,000–5,000 for a basic mechanical machine [11]. For small and mid-sized operators — about 60% of the global operator base — this pricing disparity is a major cash-flow barrier to fleet modernization. Leasing solutions from Crane and SandenVendo have made things a little easier, but financing penetration is still below 25% in developing markets.


Vandalism and Maintenance in Emerging Deployments

In Brazil, South Africa, and portions of Southeast Asia, operators estimate an average of 12–15 days per year of machine downtime due to vandalism, about three times the rate of Japan or Germany [12]. The expense of armoured enclosures, CCTV integration, and insurance adds 18-22% onto the total cost of ownership, further reducing margins that are already narrow in price-sensitive markets.


Food-Safety Regulatory Complexity

Selling perishable food through unattended machines triggers overlapping regulations — the EU's Regulation 852/2004 on food hygiene, FDA 21 CFR Part 110 in the United States, and a patchwork of municipal health codes elsewhere [13]. Compliance costs for temperature-logging hardware, third-party audits, and labeling adaptation can add USD 1,200–2,500 per machine annually, disproportionately burdening operators attempting to enter the fresh-food segment.


Vending Machine Market Opportunities

Micro-Market Conversions in Corporate Campuses

Open-format micro-market installations that mix vending kiosks, smart refrigerators, and self-checkout stations are replacing subsidized cafeterias in corporate buildings across North America and Western Europe [9]. The National Automatic Merchandising Association predicts the U.S. micro-market count to be over 55,000 in 2024, compared to 32,000 in 2020 — a growth pattern that might reach 100,000 by 2030 and bring USD 3.8 billion in incremental income to the Vending Machine Market.


Emerging-Market Urbanization Corridors

Sub-Saharan Africa’s urban population is predicted to more than triple by 2050 while vending machine penetration remains around 0.3 units per 1,000 inhabitants (compared to 23 in Japan) [7]. Lagos, Nairobi, and Dar es Salaam have near-greenfield potential for solar-powered, mobile-money-enabled machines customized for tropical climes and inconsistent grid supplies.


Data Monetization and Dynamic Pricing Models

Every linked vending transaction creates a data point — product preference, time-of-day clustering of purchases, dwell length, and payment method. Operators that aggregate this data can provide CPG brands with hyper-localized planogram optimization and real-time promotional pricing, establishing a SaaS-like recurring revenue layer on top of product margins [16]. Coca-Cola’s Freestyle platform already leverages consumption metrics at the machine level to inform rollout of new flavors.


Pharmaceutical and Healthcare Dispensing

Hospital pharmacies in Japan and South Korea have begun deploying prescription-pickup vending units that verify patient identity via QR code and dispense pre-packaged medications after hours [17]. With labor shortages in healthcare intensifying globally, automated dispensing represents a high-margin, regulation-driven niche within the Vending Machine Market.

Sustainability-Linked Machine Design

The European Vending & Coffee Service Association's 2024 sustainability enforces efficiency through its voluntary Energy Measurement Protocol (EMP) and strict EU Ecodesign labels. Manufacturers offering vacuum-insulated cabinets, LED lighting, and natural-refrigerant compressors stand to capture a green-premium pricing tier worth an estimated USD 1.2 billion annually by 2032.


Vending Machine Market Future Outlook

AI-Driven Autonomous Operations

Machine-learning algorithms are moving from back-office route optimization to on-device intelligence. By 2030, an estimated 45% of new vending units shipped globally will include edge-computing chips capable of real-time demand forecasting, automated reorder triggers, and anomaly detection for maintenance — reducing operator labor requirements by up to 25% per route, according to A 2024 Retail Automation Outlook [21].

Platform Economics and Operator Consolidation

The Vending Machine Market is entering a platform-economics phase where scale advantages in data analytics, payment processing, and supplier negotiation create winner-take-all dynamics. Over the past three years, the top 20 global operators have acquired or merged with more than 40 regional players, and this consolidation trend is forecast to accelerate as cloud-managed fleets lower the marginal cost of adding locations [22].

Energy Transition and Carbon-Neutral Fleets

With vending machines consuming an average of 3,000–4,500 kWh per unit annually, fleet-wide energy costs represent 15–20% of operator expenses.

Omnichannel Retail Integration

Vending is no longer a standalone channel. Leading operators are integrating machine inventory with e-commerce apps — allowing consumers to reserve and prepay for products via mobile, then collect from the nearest unit. This click-and-collect model, already piloted by Farmer's Fridge and Byte Foods in the U.S., blurs the line between vending and last-mile fulfillment and positions the Vending Machine Market as a node in broader omnichannel retail ecosystems [23].


Vending Machine Market Segmentation

By Product Type

Segment Key Metric Primary Demand Driver
Beverage Vending Machines 34% share (2025) Office and transit hot/cold drink consumption
Food & Snack Vending Machines CAGR 5.9% Healthy-snack premiumization trend
Combination Vending Machines CAGR 6.8% Operator preference for single-footprint SKU variety
Specialty Vending Machines USD 3.45 B (2025) PPE, electronics, and pharmaceutical dispensing


Beverage machines remain the Vending Machine Market's largest product segment, anchored by decades of installed-base inertia in offices, factories, and railway platforms. Hot-beverage units dominate in Europe and Japan, while cold-beverage dispensers lead in North America and Southeast Asia.

Combination units represent the most dynamic segment. Operators report that a single combo machine can replace two standalone units while increasing per-location revenue by 30–40%, making them the preferred choice for new deployments in space-constrained environments such as hospitals and airports.

By Technology

Segment Key Metric Primary Demand Driver
Semi-Automatic 42% share (2025) Cost-effective legacy installed base
Smart & Connected CAGR 8.2% Telemetry, cashless payments, dynamic pricing
Fully Automatic USD 5.39 B (2025) Labor-cost reduction in high-volume locations


Smart and connected vending machines are reshaping operator economics across the Vending Machine Market. These units transmit real-time sales, stock, and equipment-health data to centralized dashboards, enabling predictive restocking routes that cut logistics costs by 15–20% [2]. The segment's 8.2% CAGR reflects both new-unit sales and the accelerating retrofit of existing machines with aftermarket telemetry kits.

By End User

Segment Key Metric Primary Demand Driver
Commercial & Corporate 30% share (2025) Employee-amenity investment; micro-market trend
Retail & Public Spaces CAGR 5.6% High foot-traffic monetization
Transportation Hubs USD 4.31 B (2025) Captive-audience convenience demand
Healthcare & Education CAGR 6.1% 24/7 access requirements; healthy-option mandates
Manufacturing & Industrial 10% share (2025) On-floor convenience; PPE dispensing compliance


Commercial and corporate end users constitute the Vending Machine Market's largest demand pool, driven by facilities managers seeking to reduce cafeteria-subsidy costs while improving employee satisfaction. Healthcare and education institutions are the fastest-growing user category, propelled by 24/7 facility operation and growing mandates for nutritious vending options in schools and hospitals.


Regional Market Share Analysis

Region Key Metric Primary Investment Themes
Asia-Pacific 38% global share (2025) Smart-unit upgrades, transit-hub concessions, and aging-society convenience
North America USD 6.03 B (2025) Micro-market conversions, healthy-food vending, cashless retrofit
Europe 5.1% CAGR (2026–2035) Sustainability mandates, digital-payment regulation, and fresh-food innovation
South America USD 1.51 B (2025) Urban transit deployment, mobile-money integration
Middle East & Africa 7.1% CAGR (2026–2035) Mega-project retail infrastructure, solar-powered units
Total USD 21.55 B (2025)

The Vending Machine Market exhibits a pronounced concentration in Asia-Pacific, where Japan's legacy installed base and China's rapid digital deployment create an outsized regional footprint. North America and Europe together account for half the remaining revenue, while South America and MEA contribute smaller but accelerating shares.


Asia-Pacific

Country Key Metric Key Driver
Japan 46% of regional revenue World's highest machine density; operator fleet modernization
China CAGR 7.8% Urban metro expansion; QR-code payment ubiquity
South Korea USD 0.62 B (2025) Convenience-culture adoption; K-beauty and electronics dispensing
India CAGR 9.2% UPI digital payment infrastructure; railway station concessions
Australia 4% of regional share Corporate campus micro-market penetration


Japan's vending sector, with an installed base exceeding 5 million machines, remains the global bellwether. The Japan Vending Machine Manufacturers Association reported that 38% of units were connected to cloud-management platforms by year-end 2024, up from 21% in 2021 [1]. China is catching up fast — Alibaba-backed smart-vending operator Ubox deployed 120,000 new units in Tier-2 and Tier-3 cities during 2023–2024, targeting metro passengers and university campuses.

North America

Country Key Metric Key Driver
United States 82% of regional revenue Micro-market growth; cashless retrofit wave
Canada CAGR 4.8% Cannabis-dispensing regulatory framework; transit concessions
Mexico USD 0.38 B (2025) Retail modernization; convenience-store displacement in urban cores


The United States alone operates approximately 7 million vending machines. The Vending Machine Market in North America is increasingly defined by the shift from traditional break-room machines to curated micro-market environments, particularly in tech campuses and co-working spaces where employee experience drives facilities investment [9].

Europe

Country Key Metric Key Driver
Germany 24% of regional share Manufacturing-floor deployment; energy-efficiency regulations
United Kingdom CAGR 5.4% Contactless payment saturation; healthy-vending workplace mandates
France USD 0.68 B (2025) Coffee-vending culture; railway station concessions
Italy 19% of regional share Highest per-capita coffee-vending consumption in Europe


Europe's Vending Machine Market is shaped by twin regulatory pressures: the EU's revised Payment Services Directive pushing cashless acceptance and the Energy Efficiency Directive incentivizing low-consumption appliances [6]. Italy and France lead in volume thanks to a deeply embedded coffee-vending culture, while Germany drives premium-unit adoption in industrial settings.

South America

Country Key Metric Key Driver
Brazil 62% of regional share São Paulo metro expansion; Pix payment adoption
Argentina CAGR 6.3% Inflation-hedged prepaid vending models
Colombia USD 0.11 B (2025) TransMilenio BRT station concessions


Brazil's Pix instant-payment system has transformed the economics of unattended retail by eliminating cash-handling costs, and operators report a 40% increase in average transaction value when machines accept Pix versus cash-only configurations [19].

Middle East & Africa

Country Key Metric Key Driver
UAE 34% of the regional share Smart-city infrastructure mandates; tourism footfall
Saudi Arabia CAGR 8.6% NEOM and Red Sea mega-project retail build-outs
South Africa USD 0.18 B (2025) Mining-site and transport-hub convenience demand


Saudi Arabia's Vision 2030 program has earmarked over USD 500 billion in entertainment, tourism, and urban-infrastructure projects, each of which includes automated retail provisions in master plans [20]. The Vending Machine Market in the Middle East is uniquely positioned to benefit from greenfield mega-developments where planners can embed vending into building design from inception.


Vending Machine Market By Region, 2025-2035

Competitive Benchmarking

The Vending Machine Market is moderately fragmented, with the top five players collectively holding an estimated 28–33% of global revenue. The Herfindahl-Hirschman Index sits in the low-moderate concentration range (approximately 450–600), reflecting a long tail of regional and national operators. Competition centers on three axes: machine technology and connected-platform capabilities, payment-integration breadth, and after-sales service networks.

Company Est. Revenue Share Range Key Offerings for the Vending Machine Market Strategic Positioning
Fuji Electric Co. ~7–9% Connected beverage and food machines; IoT management platform Technology leader in Japanese and Asian markets
Crane Merchandising Systems (Crane NXT) ~5–7% Combo units; cashless-retrofit kits; Media2 platform Full-stack operator solutions in North America
SandenVendo (Sanden Retail Systems) ~4–6% Refrigerated food and beverage units; eco-design range European sustainability leader
Azkoyen Group ~3–5% Coffee and hot-beverage machines; payment systems Premium coffee-vending specialist
Evoca Group ~3–5% Table-top and free-standing coffee machines; telemetry Italian market leader with global OCS presence
Bianchi Industry ~2–4% Snack, food, and beverage machines; IoT connectivity Mid-market European positioning
Royal Vendors ~2–3% Glass-front coolers; energy-efficient beverage machines U.S. bottler-channel specialist
Jofemar ~2–3% Combo and snack machines; Vision range with touchscreen Iberian market leader expanding into South America
Selecta Group ~2–4% Managed vending services; coffee and snack machines Europe's largest independent operator
N&W Global Vending (Evoca subsidiary) ~2–3% Full-range OEM; Necta and Wittenborg brands Multi-brand OEM scale


Recent News & Developments


  • Crane NXT (January 2025): Solidified its global industrial technology profile by accelerating its strategic acquisition of Antares Vision S.p.A., expanding its Detection & Traceability Technologies division to deploy high-security authentication software within international food, beverage, and life sciences supply chains.


  • Ubox (June 2024): Secured USD 200 million Series D funding led by Alibaba Group to deploy 80,000 additional smart vending units in China's Tier-2 and Tier-3 cities by the end of 2025 [3].
  • Farmer's Fridge (April 2024): Expanded to 1,200 refrigerated fresh-food kiosks across 30 U.S. airports and hospitals, reporting 35% year-on-year same-unit sales growth [8].


  • Selecta Group (November 2023): Completed its debt restructuring and relaunched its capex program with a target of upgrading 45,000 machines to cashless-enabled configurations across 16 European countries by 2025 [22].


Vending Machine Market Report Scope

Parameter Detail
Market Scope Global Vending Machine Market, including hardware sales, managed-service revenue, and technology-upgrade spend
Study Period 2021–2035
CAGR 5.3% (2026–2035)
Market Size — 2025 USD 21.55 Billion
Market Size — 2035 USD 36.12 Billion
Fastest Growing Segment Smart & Connected Vending (8.2% CAGR)
Fastest Growing Region Middle East & Africa (7.1% CAGR)
Companies Profiled 10 (Fuji Electric, Crane NXT, SandenVendo, Azkoyen, Evoca Group, Bianchi Industry, Royal Vendors, Jofemar, Selecta Group, N&W Global Vending)
Valuation Currency USD (constant 2025 dollars)


FAQs

What is the average payback period for a new smart vending machine investment?

Most operators achieve payback in 18–24 months on a connected unit placed in a location generating 40+ transactions daily [2]. Higher-traffic placements in transit hubs can compress this to under 12 months.

How do vending operators manage spoilage risk for perishable-food machines?

Real-time temperature telemetry and automated first-expiry-first-out dispensing algorithms keep spoilage rates below 3% for top operators [8]. Dynamic discounting near expiry further reduces waste.

What cybersecurity standards apply to cashless vending payment systems?

PCI DSS compliance is mandatory for any unit processing card transactions, and the EU's PSD3 adds strong customer authentication requirements for unattended terminals [6]. Operators typically rely on certified payment-module vendors.

How do operators choose between leasing and purchasing vending equipment?

Leasing reduces upfront cash outlay and bundles maintenance, while purchasing suits operators with strong balance sheets seeking lower lifetime cost [11]. Fleet size and creditworthiness usually drive the decision.

What role do planogram analytics play in maximizing per-machine revenue?

Cloud-based planogram tools analyze transaction data to optimize product mix and shelf placement by location [16]. Top operators report 10–15% revenue lifts after data-driven planogram adjustments.

How are accessibility regulations shaping vending machine design?

The Americans with Disabilities Act and EU Accessibility Act require reachable controls, tactile interfaces, and audio feedback on new installations [13]. Manufacturers now ship ADA-compliant configurations as standard.

What impact does ambient temperature have on outdoor vending machine performance?

Machines in climates exceeding 40°C require enhanced compressor capacity and direct-sun shielding, adding 10–15% to energy costs [14]. Gulf-state operators use insulated canopies and variable-speed compressors to manage this.


FAQs

What is the current valuation of the Vending Machine Market as of 2024?

The Vending Machine Market was valued at 23150.0 USD Billion in 2024.

What is the projected market size for the Vending Machine Market in 2035?

The market is projected to reach 45900.0 USD Billion by 2035.

What is the expected CAGR for the Vending Machine Market during the forecast period 2025 - 2035?

The expected CAGR for the Vending Machine Market during 2025 - 2035 is 6.6%.

Which segments are included in the Vending Machine Market by application?

The market segments by application include Food and Beverage, Personal Care Products, Electronics, Healthcare Products, and Transportation.

What is the valuation range for the Food and Beverage segment in the Vending Machine Market?

The Food and Beverage segment is valued between 11500.0 and 23000.0 USD Billion.

What types of vending machines are categorized in the market?

The market categorizes vending machines into Traditional, Smart, Mobile, and Automated Retail Kiosks.

What is the projected valuation for Smart Vending Machines by 2035?

Smart Vending Machines are projected to be valued between 7000.0 and 15000.0 USD Billion by 2035.

Which end-use sectors are driving the Vending Machine Market?

Key end-use sectors include Office Spaces, Educational Institutions, Public Transport Hubs, and Retail Environments.

What is the valuation range for the Retail Environments segment in the Vending Machine Market?

The Retail Environments segment is valued between 5.0 and 10.0 USD Billion.

Who are the key players in the Vending Machine Market?

Key players include Crane Merchandising Systems, N&W Global Vending, Selecta Group, Jofemar, Royal Vendors, Vending.com, SandenVendo, Azkoyen, and Cantaloupe Systems.
Author
Author
Author Profile
Varsha More LinkedIn
Senior Research Analyst
Experienced business professional with a demonstrated history of working in the CFnB industry. Skilled in market research, and market estimation. Strong professional with a Masters focused in marketing management.

Research Approach


Secondary Research

The secondary research process involved comprehensive analysis of regulatory databases, industry associations, government publications, and authoritative trade sources. Key sources included the US Department of Commerce (Commerce.gov), European Commission Directorate-General for Internal Market, Industry, Entrepreneurship and SMEs (GROW), Occupational Safety and Health Administration (OSHA), Food and Drug Administration (FDA) for food vending regulations, International Vending Alliance (IVA), European Vending Association (EVA), National Automatic Merchandising Association (NAMA), Japan Vending Machine Manufacturers Association (JVMA), Bureau of Transportation Statistics (BTS) for commercial location data, World Bank Open Data for retail infrastructure metrics, Eurostat for European retail automation statistics, US Census Bureau for commercial real estate data, International Monetary Fund (IMF) for economic indicators affecting consumer spending, and national retail federation reports from key markets. These sources were used to collect vending machine deployment statistics, regulatory compliance data, payment technology adoption rates, and market landscape analysis for food & beverage vending, tobacco vending, games/amusement machines, and smart/connected vending technologies.


Primary Research

Qualitative and quantitative insights were obtained by interviewing supply-side and demand-side stakeholders during the primary research process. CEOs, VPs of Operations, leaders of Product Development, and regional sales directors from vending machine manufacturers, component suppliers, and payment system technology providers comprised the supply-side sources. Facility managers from commercial real estate, procurement leads from corporate offices, operations directors from educational institutions, retail space managers from airports and transportation hubs, and convenience service coordinators from healthcare facilities constituted demand-side sources. The primary research validated market segmentation across machine types (beverage, food, tobacco, beauty & personal care, ticket, games/amusement), confirmed the timelines for IoT integration and cashless payment adoption, and gathered insights on machine placement strategies, maintenance service models, and revenue sharing dynamics between operators and location providers.

Primary Respondent Breakdown:

By Designation: C-level Primaries (32%), Director Level (31%), Others (37%)

By Region: North America (32%), Europe (29%), Asia-Pacific (33%), Rest of World (6%)


Market Size Estimation

Global market valuation was derived through unit shipment analysis and revenue mapping across the installed base. The methodology included:

Identification of 60+ key manufacturers and operators across North America, Europe, Asia-Pacific, and Latin America

Product mapping across traditional mechanical vending machines, electronic vending machines, and smart connected vending systems

Application analysis across commercial places, offices, public places, educational institutions, and healthcare facilities

Analysis of reported and modeled annual revenues specific to vending machine hardware, software management systems, and payment processing solutions

Coverage of manufacturers and major operators representing 72-78% of global market share in 2024

Extrapolation using bottom-up (machine units × ASP by type and region × service revenue multipliers) and top-down (industry association shipment data validation) approaches to derive segment-specific valuations

Download Free Sample

Kindly complete the form below to receive a free sample of this Report

Download PDF ×

We do not share your information with anyone. However, we may send you emails based on your report interest from time to time. You may contact us at any time to opt-out.