Segmentation Quick Reference
| Dimension | Sub-Segments | Dominant Segment | Fastest Growing Segment |
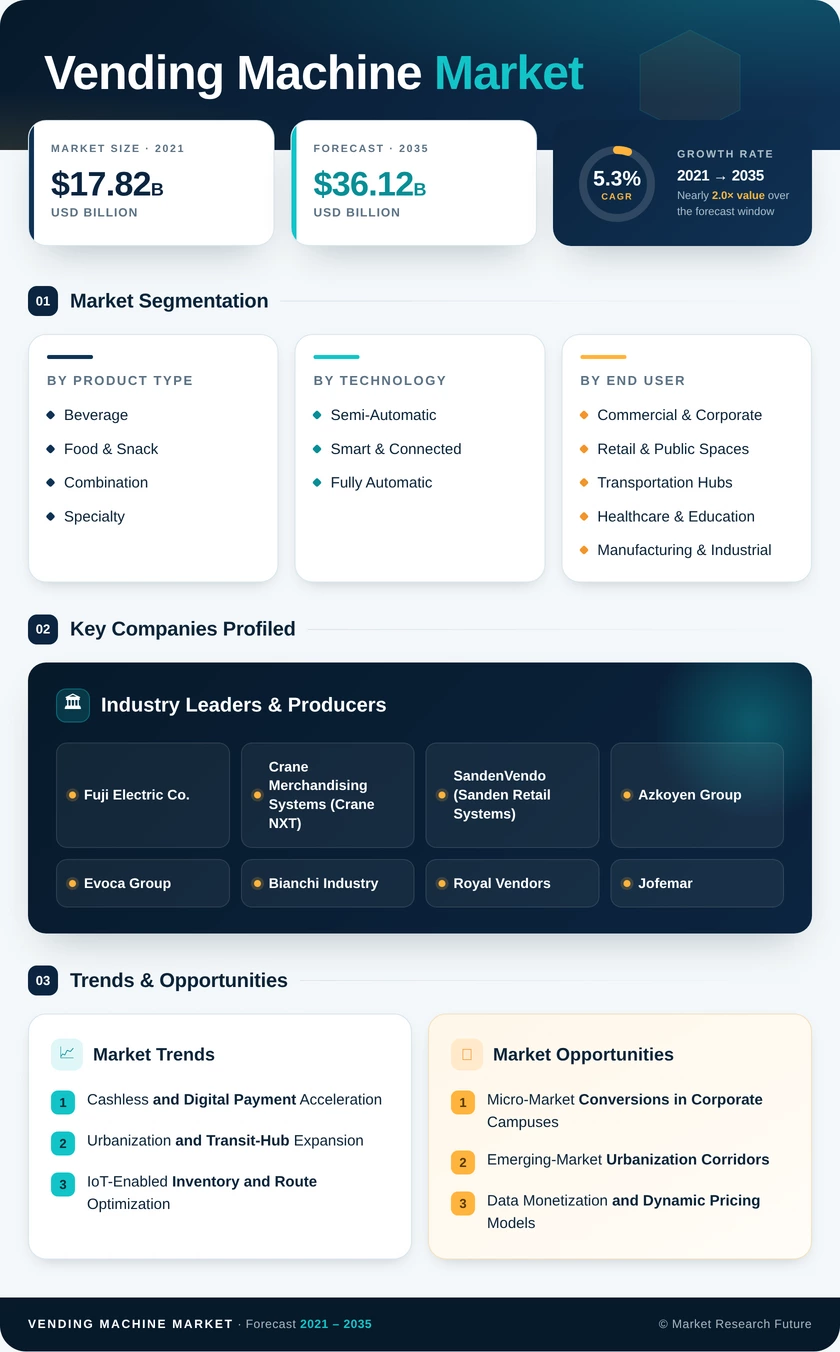
| By Product Type | Beverage, Food & Snack, Combination, Specialty | Beverage Vending Machines (34%) | Combination Vending Machines (6.8% CAGR) |
| By Technology | Semi-Automatic, Smart & Connected, Fully Automatic | Semi-Automatic (42%) | Smart & Connected (8.2% CAGR) |
| By End User | Commercial & Corporate, Retail & Public Spaces, Transportation Hubs, Vending Machine Market & Education, Manufacturing & Industrial | Commercial & Corporate (30%) | Vending Machine Market & Education (6.1% CAGR) |
Market Segmentation Overview
By Product Type
| Sub-Segment | Key Trend |
| Beverage Vending Machines | Hot-beverage premiumization in Europe; cold-drink dominance in North America and Southeast Asia |
| Food & Snack Vending Machines | Fresh and healthy snack offerings replacing traditional candy and chips inventory |
| Combination Vending Machines | Operators consolidating multi-category SKUs into single-footprint units for space-constrained venues |
| Specialty Vending Machines | Rapid adoption in the pharmaceutical, electronics, and PPE dispensing segments |
The product-type dimension reflects a structural shift from single-category dispensers toward multi-function combination units that maximize revenue per square foot. Specialty machines are carving out high-margin niches in healthcare and industrial safety, representing the most innovation-intensive sub-segment.
By Technology
| Sub-Segment | Key Trend |
| Semi-Automatic | Legacy installed base in developing markets; gradual displacement through retrofit kits |
| Smart & Connected | Cloud-managed telemetry, cashless-payment integration, dynamic pricing, and predictive maintenance |
| Fully Automatic | Robotic dispensing and conveyor-based units for complex food items and premium products |
The technology dimension captures the core digitization arc of the industry. Semi-automatic machines still dominate by volume, but smart and connected units are absorbing the vast majority of new capital expenditure and driving the highest margin expansion for operators.
By End User
| Sub-Segment | Key Trend |
| Commercial & Corporate | Micro-market conversions displacing traditional break-room vending |
| Retail & Public Spaces | High-traffic monetization through advertising-enabled smart screens |
| Transportation Hubs | Captive-audience deployment in metro stations, airports, and bus terminals |
| Vending Machine Market & Education | 24/7 facility access needs; regulatory push for healthy vending options |
| Manufacturing & Industrial | On-floor PPE dispensing compliance; tool-crib automation |
End-user segmentation highlights the broadening application base beyond traditional office and retail deployments. Vending Machine Market and education institutions are emerging as the fastest-growing demand centers, reflecting regulatory mandates and round-the-clock operational requirements that favor automated retail solutions.