Veterinary Ultrasound Market (2026 - 2035)

ID: MRFR/MED/4596-CR
188 Pages
Rahul Gotadki
Last Updated: July 22, 2026
Veterinary Ultrasound Market Research Report By Application (Cardiology, Abdominal Imaging, Emergency and Critical Care, Reproductive Imaging), By Technology (2D Ultrasound, 3D Ultrasound, Doppler Ultrasound, Portable Ultrasound), By Animal Type (Small Animals, Large Animals, Exotic Animals), By End Use (Veterinary Clinics, Animal Hospitals, Research Institutions) and By Regional (North America, Europe, South America, Asia Pacific, Middle East and Africa) - Growth & Industry Forecast 2025 To 2035
Veterinary Ultrasound Market
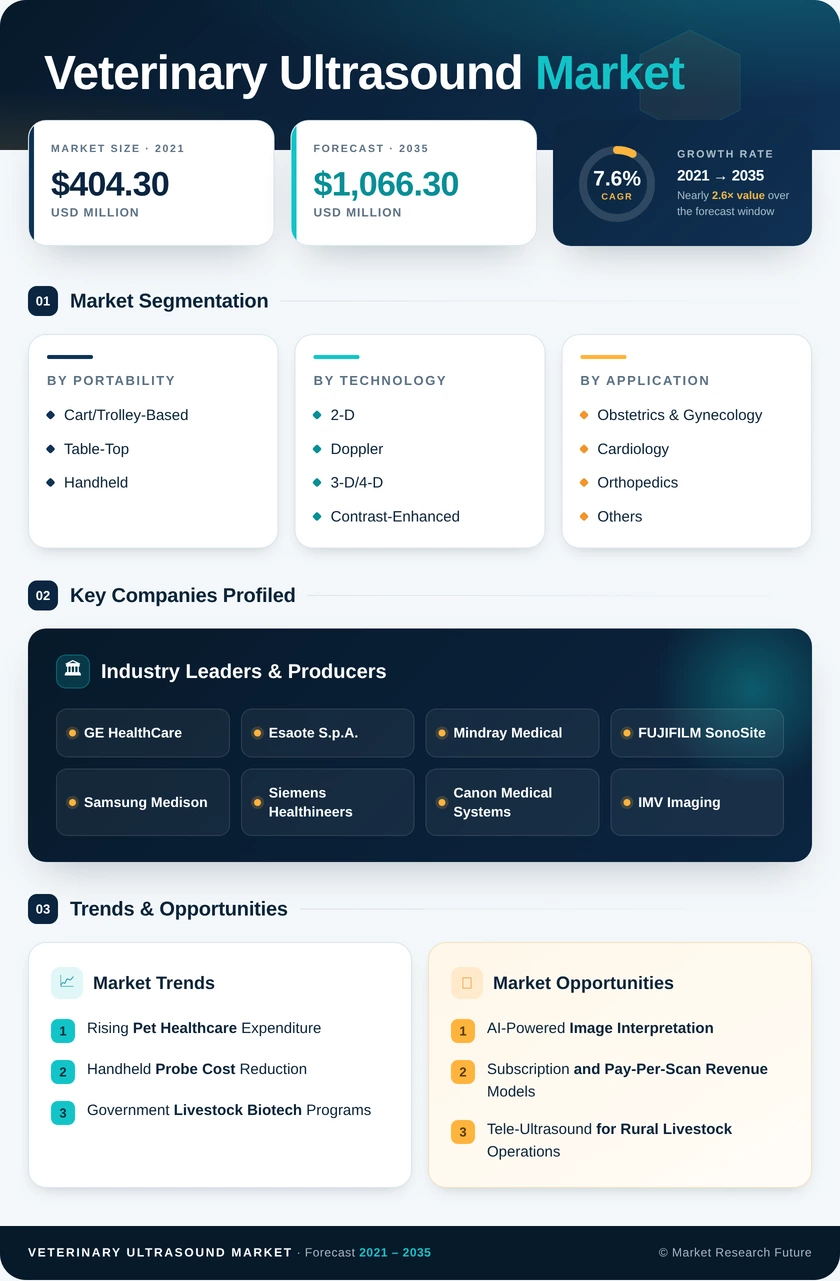
Market Size
Forecast Period2026-2035
CAGR (2026-2035)7.6%
2025 Market SizeUSD 512.80 Million
2035 Market SizeUSD 1,066.30 Million
Key Players
GE HealthCare
Esaote S.p.A.
Mindray Medical
FUJIFILM SonoSite
Samsung Medison
Siemens Healthineers
Opportunities
  • AI-Powered Image Interpretation
  • Subscription and Pay-Per-Scan Revenue Models
  • Tele-Ultrasound for Rural Livestock Operations
  1. 1 Market Overview |
    1. 1.1 Study Assumptions & Market Definition |
    2. 1.2 Scope of the Study |
    3. 1.3 Research Methodology
  2. 2 Market Summary & Key Takeaways
  3. 3 Market Dynamics |
    1. 3.1 Market Drivers Analysis | |
      1. 3.1.1 Rising Pet Healthcare Expenditure | |
      2. 3.1.2 Handheld Probe Cost Reduction | |
      3. 3.1.3 Government Livestock Biotech Programs | |
      4. 3.1.4 Doppler Cardiology Protocol Adoption | |
      5. 3.1.5 Corporate Clinic Consolidation | |
      6. 3.1.6 Subscription & Leasing Business Models | |
      7. 3.1.7 Livestock Breeding-Interval Optimization |
    2. 3.2 Market Restraints Analysis | |
      1. 3.2.1 High Capital Cost of Advanced Systems | |
      2. 3.2.2 Shortage of Trained Veterinary Sonographers | |
      3. 3.2.3 Regulatory Fragmentation Across Markets | |
      4. 3.2.4 Limited Reimbursement in Livestock Settings | |
      5. 3.2.5 Data Privacy and Cybersecurity Mandates |
    3. 3.3 Market Opportunity Analysis | |
      1. 3.3.1 AI-Powered Image Interpretation | |
      2. 3.3.2 Subscription and Pay-Per-Scan Revenue Models | |
      3. 3.3.3 Tele-Ultrasound for Rural Livestock Operations | |
      4. 3.3.4 Contrast-Enhanced Ultrasound in Oncology | |
      5. 3.3.5 Data Monetization Through Herd-Health Analytics |
    4. 3.4 Industry Value Chain Analysis |
    5. 3.5 Porter's Five Forces Analysis
  4. 4 Global Veterinary Ultrasound Market Size & Forecast (2021–2035) |
    1. 4.1 Historical Market Size (2021–2025) |
    2. 4.2 Current & Forecast Market Size (2026–2035) |
    3. 4.3 Market Size by Revenue (USD Million) |
    4. 4.4 Year-over-Year Growth Analysis
  5. 5 Segmentation Analysis |
    1. 5.1 By Portability | |
      1. 5.1.1 Cart/Trolley-Based | |
      2. 5.1.2 Table-Top | |
      3. 5.1.3 Handheld |
    2. 5.2 By Technology | |
      1. 5.2.1 2-D | |
      2. 5.2.2 Doppler | |
      3. 5.2.3 3-D/4-D | |
      4. 5.2.4 Contrast-Enhanced |
    3. 5.3 By Application | |
      1. 5.3.1 Obstetrics & Gynecology | |
      2. 5.3.2 Cardiology | |
      3. 5.3.3 Orthopedics | |
      4. 5.3.4 Others (Abdominal, Ophthalmologic) |
    4. 5.4 By Animal Type | |
      1. 5.4.1 Livestock | |
      2. 5.4.2 Companion Animals |
    5. 5.5 By End User | |
      1. 5.5.1 Veterinary Hospitals | |
      2. 5.5.2 Veterinary Clinics
  6. 6 Regional Analysis |
    1. 6.1 North America | |
      1. 6.1.1 United States | |
      2. 6.1.2 Canada | |
      3. 6.1.3 Mexico |
    2. 6.2 Europe | |
      1. 6.2.1 Germany | |
      2. 6.2.2 United Kingdom | |
      3. 6.2.3 France | |
      4. 6.2.4 Italy | |
      5. 6.2.5 Spain | |
      6. 6.2.6 Nordic Countries | |
      7. 6.2.7 Russia | |
      8. 6.2.8 Rest of Europe |
    3. 6.3 Asia-Pacific | |
      1. 6.3.1 China | |
      2. 6.3.2 India | |
      3. 6.3.3 Japan | |
      4. 6.3.4 South Korea | |
      5. 6.3.5 ASEAN | |
      6. 6.3.6 Rest of Asia-Pacific |
    4. 6.4 South America | |
      1. 6.4.1 Brazil | |
      2. 6.4.2 Argentina | |
      3. 6.4.3 Rest of South America |
    5. 6.5 Middle East & Africa | |
      1. 6.5.1 Saudi Arabia | |
      2. 6.5.2 UAE | |
      3. 6.5.3 South Africa | |
      4. 6.5.4 Egypt | |
      5. 6.5.5 Rest of MEA
  7. 7 Competitive Landscape |
    1. 7.1 Market Share Analysis (2025) |
    2. 7.2 Competitive Benchmarking Matrix |
    3. 7.3 Company Profiles | |
      1. 7.3.1 GE HealthCare | |
      2. 7.3.2 Esaote S.p.A. | |
      3. 7.3.3 Mindray Medical | |
      4. 7.3.4 FUJIFILM SonoSite | |
      5. 7.3.5 Samsung Medison | |
      6. 7.3.6 Siemens Healthineers | |
      7. 7.3.7 Canon Medical Systems | |
      8. 7.3.8 IMV Imaging | |
      9. 7.3.9 BCF Technology | |
      10. 7.3.10 Edan Instruments
  8. 8 Future Outlook & Strategic Recommendations (2026–2035) |
    1. 8.1 AI-Augmented Diagnostics |
    2. 8.2 Platform Economics and Cloud Ecosystems |
    3. 8.3 Sustainability and Device Lifecycle |
    4. 8.4 Point-of-Care Expansion in Emerging Economies
  9. 9 Recent Developments & News
  10. 10 Frequently Asked Questions (FAQs)
  11. 11 Report Scope & Methodology |
    1. 11.1 Study Period & Base Year |
    2. 11.2 Data Sources & Citations |
    3. 11.3 Abbreviations
  12. 12 LIST OF TABLES |
  13. TABLE 1 Global Veterinary Ultrasound Market Size & Forecast, by Revenue (USD Million), 2021–2035 |
  14. TABLE 2 Global Veterinary Ultrasound Market — Year-over-Year Growth Analysis, 2021–2035 |
  15. TABLE 3 Global Veterinary Ultrasound Market — Driver Impact Analysis |
  16. TABLE 4 Global Veterinary Ultrasound Market — Restraint Impact Analysis |
  17. TABLE 5 Global Veterinary Ultrasound Market Size, by Portability, 2021–2035 (USD Million) |
  18. TABLE 6 Global Veterinary Ultrasound Market Size, by Technology, 2021–2035 (USD Million) |
  19. TABLE 7 Global Veterinary Ultrasound Market Size, by Application, 2021–2035 (USD Million) |
  20. TABLE 8 Global Veterinary Ultrasound Market Size, by Animal Type, 2021–2035 (USD Million) |
  21. TABLE 9 Global Veterinary Ultrasound Market Size, by End User, 2021–2035 (USD Million) |
  22. TABLE 10 Global Veterinary Ultrasound Market Size, by Region, 2021–2035 (USD Million) |
  23. TABLE 11 North America Veterinary Ultrasound Market Size, by Country, 2021–2035 (USD Million) |
  24. TABLE 12 Europe Veterinary Ultrasound Market Size, by Country, 2021–2035 (USD Million) |
  25. TABLE 13 Asia-Pacific Veterinary Ultrasound Market Size, by Country, 2021–2035 (USD Million) |
  26. TABLE 14 South America Veterinary Ultrasound Market Size, by Country, 2021–2035 (USD Million) |
  27. TABLE 15 Middle East & Africa Veterinary Ultrasound Market Size, by Country, 2021–2035 (USD Million) |
  28. TABLE 16 Competitive Benchmarking Matrix — Global Veterinary Ultrasound Market, 2025 |
  29. TABLE 17 Company Profiles — Key Players, Global Veterinary Ultrasound Market |
  30. TABLE 18 Recent Developments & Strategic Announcements, 2024–2025 |
  31. TABLE 19 North America Veterinary Ultrasound Market Size, by Portability, 2021–2035 (USD Million) |
  32. TABLE 20 North America Veterinary Ultrasound Market Size, by Technology, 2021–2035 (USD Million) |
  33. TABLE 21 North America Veterinary Ultrasound Market Size, by Application, 2021–2035 (USD Million) |
  34. TABLE 22 North America Veterinary Ultrasound Market Size, by Animal Type, 2021–2035 (USD Million) |
  35. TABLE 23 North America Veterinary Ultrasound Market Size, by End User, 2021–2035 (USD Million) |
  36. TABLE 24 Europe Veterinary Ultrasound Market Size, by Portability, 2021–2035 (USD Million) |
  37. TABLE 25 Europe Veterinary Ultrasound Market Size, by Technology, 2021–2035 (USD Million) |
  38. TABLE 26 Europe Veterinary Ultrasound Market Size, by Application, 2021–2035 (USD Million) |
  39. TABLE 27 Europe Veterinary Ultrasound Market Size, by Animal Type, 2021–2035 (USD Million) |
  40. TABLE 28 Europe Veterinary Ultrasound Market Size, by End User, 2021–2035 (USD Million) |
  41. TABLE 29 Asia-Pacific Veterinary Ultrasound Market Size, by Portability, 2021–2035 (USD Million) |
  42. TABLE 30 Asia-Pacific Veterinary Ultrasound Market Size, by Technology, 2021–2035 (USD Million) |
  43. TABLE 31 Asia-Pacific Veterinary Ultrasound Market Size, by Application, 2021–2035 (USD Million) |
  44. TABLE 32 Asia-Pacific Veterinary Ultrasound Market Size, by Animal Type, 2021–2035 (USD Million) |
  45. TABLE 33 Asia-Pacific Veterinary Ultrasound Market Size, by End User, 2021–2035 (USD Million) |
  46. TABLE 34 South America Veterinary Ultrasound Market Size, by Portability, 2021–2035 (USD Million) |
  47. TABLE 35 South America Veterinary Ultrasound Market Size, by Technology, 2021–2035 (USD Million) |
  48. TABLE 36 South America Veterinary Ultrasound Market Size, by Application, 2021–2035 (USD Million) |
  49. TABLE 37 South America Veterinary Ultrasound Market Size, by Animal Type, 2021–2035 (USD Million) |
  50. TABLE 38 South America Veterinary Ultrasound Market Size, by End User, 2021–2035 (USD Million) |
  51. TABLE 39 Middle East & Africa Veterinary Ultrasound Market Size, by Portability, 2021–2035 (USD Million) |
  52. TABLE 40 Middle East & Africa Veterinary Ultrasound Market Size, by Technology, 2021–2035 (USD Million) |
  53. TABLE 41 Middle East & Africa Veterinary Ultrasound Market Size, by Application, 2021–2035 (USD Million) |
  54. TABLE 42 Middle East & Africa Veterinary Ultrasound Market Size, by Animal Type, 2021–2035 (USD Million) |
  55. TABLE 43 Middle East & Africa Veterinary Ultrasound Market Size, by End User, 2021–2035 (USD Million) |
  56. TABLE 44 Report Scope & Methodology Summary |
  57. TABLE 45 Detailed Sources and Citations
  58. 13 LIST OF FIGURES |
  59. FIGURE 1 Global Veterinary Ultrasound Market Dynamics — Drivers, Restraints, and Opportunities |
  60. FIGURE 2 Industry Value Chain Analysis — Veterinary Ultrasound Market |
  61. FIGURE 3 Porter's Five Forces Analysis — Veterinary Ultrasound Market |
  62. FIGURE 4 Global Veterinary Ultrasound Market Size Trend & Forecast (USD Million), 2021–2035 |
  63. FIGURE 5 Global Veterinary Ultrasound Market Share, by Portability, 2025 |
  64. FIGURE 6 Global Veterinary Ultrasound Market Share, by Technology, 2025 |
  65. FIGURE 7 Global Veterinary Ultrasound Market Share, by Application, 2025 |
  66. FIGURE 8 Global Veterinary Ultrasound Market Share, by Animal Type, 2025 |
  67. FIGURE 9 Global Veterinary Ultrasound Market Share, by End User, 2025 |
  68. FIGURE 10 Global Veterinary Ultrasound Market Share, by Region, 2025 |
  69. FIGURE 11 North America Veterinary Ultrasound Market Share, by Country, 2025 |
  70. FIGURE 12 Europe Veterinary Ultrasound Market Share, by Country, 2025 |
  71. FIGURE 13 Asia-Pacific Veterinary Ultrasound Market Share, by Country, 2025 |
  72. FIGURE 14 South America Veterinary Ultrasound Market Share, by Country, 2025 |
  73. FIGURE 15 Middle East & Africa Veterinary Ultrasound Market Share, by Country, 2025 |
  74. FIGURE 16 Competitive Landscape — Market Share Analysis, 2025 |
  75. FIGURE 17 Competitive Benchmarking Radar Chart — Top 10 Players

Segmentation Quick Reference

DimensionSub-SegmentsDominant SegmentFastest Growing Segment
PortabilityCart/Trolley-Based, Table-Top, HandheldCart/Trolley-BasedHandheld
Technology2-D, Doppler, 3-D/4-D, Contrast-Enhanced2-DContrast-Enhanced
ApplicationObstetrics & Gynecology, Cardiology, Orthopedics, OthersObstetrics & GynecologyCardiology
Animal TypeLivestock, Companion AnimalsLivestockCompanion Animals
End UserVeterinary Hospitals, Veterinary ClinicsVeterinary HospitalsVeterinary Clinics
GeographyNorth America, Europe, Asia-Pacific, South America, Middle East & AfricaNorth AmericaAsia-Pacific


Market Segmentation Overview

By Portability

Sub-SegmentKey Trend
Cart/Trolley-BasedRetaining hospital dominance through multi-transducer versatility and premium image resolution
Table-TopServing mid-tier clinics and academic institutions with balanced cost-performance profiles
HandheldDisrupting field veterinary practice via wireless, app-connected probes under USD 3,500


Portability is the axis along which the Veterinary Ultrasound Market is evolving most rapidly. Hospital procurement still favors cart-based consoles for their superior imaging pipelines. Still, handheld devices are capturing incremental volume in mobile equine practice, on-farm livestock scanning, and first-opinion companion-animal clinics.

By Technology

Sub-SegmentKey Trend
2-DWorkhorse modality for reproductive and abdominal imaging across all animal types
DopplerGrowing in tandem with formalized small-animal cardiology protocols
3-D/4-DGaining traction in surgical planning and academic research settings
Contrast-EnhancedEmerging as an oncology tool to reduce CT/MRI referral rates


Technology segmentation reflects clinical specialization. Two-dimensional scanning dominates volume, while Doppler and contrast-enhanced modalities capture higher per-exam value and are driving revenue-mix improvement across the Veterinary Ultrasound Market.

By Application

Sub-SegmentKey Trend
Obstetrics & GynecologyCore revenue generator in both livestock and companion-animal breeding
CardiologyFastest-growing application; breed-screening mandates fuel demand
OrthopedicsEquine musculoskeletal imaging drives niche but high-value utilization
OthersAbdominal and ophthalmologic indications expanding clinical scope.


Application segmentation underscores the dual nature of the Veterinary Ultrasound Market: reproductive imaging sustains base volume in livestock, while cardiology and oncology drive premium-tier growth in companion animals.

By Animal Type

Sub-SegmentKey Trend
LivestockLargest segment by volume; reproductive ultrasound integral to breeding economics
Companion AnimalsFastest-growing segment; pet insurance and geriatric care trends accelerating adoption


The livestock-to-companion shift is a defining structural trend in the Veterinary Ultrasound Market, as companion-animal spending per scan significantly exceeds that in production-animal settings.

By End User

Sub-SegmentKey Trend
Veterinary HospitalsLargest end-user base; multi-department imaging suites with advanced platforms
Veterinary ClinicsFastest-growing channel; point-of-care handheld adoption reshaping first-opinion practice


End-user dynamics mirror the portability shift: hospitals anchor installed-base revenue, while clinics represent the growth frontier for the Veterinary Ultrasound Market as affordable devices bring imaging into routine primary care.


 

Download PDF ×

We do not share your information with anyone. However, we may send you emails based on your report interest from time to time. You may contact us at any time to opt-out.