Vibration Monitoring Market

Key Players: SKF AB, Emerson Electric, Honeywell International, Baker Hughes (GE), Rockwell Automation, Brรผel & Kjรฆr (HBK), Fluke Corporation (Fortive), PCB Piezotronics (Amphenol)

Vibration Monitoring Market

Vibration Monitoring Market Size, Share and Research Report By Component (Hardware, Software, Services), By Monitoring Process (Online / Continuous, Portable, Wireless Remote), By Deployment Mode (On-Premises, Cloud), By Network Technology (Wired, Wireless), By Application (Motors and Pumps, Turbines, Compressors, Gearboxes, Others) and By End-User Industry (Oil and Gas, Energy and Power, Automotive, Food and Beverage, Mining, Aerospace and Defense, Others) - Industry Forecast to 2035
ID: MRFR/SEM/2630-CR
156 Pages
Nirmit Biswas, Aarti Dhapte
Last Updated: June 17, 2026

Vibration Monitoring Market Summary

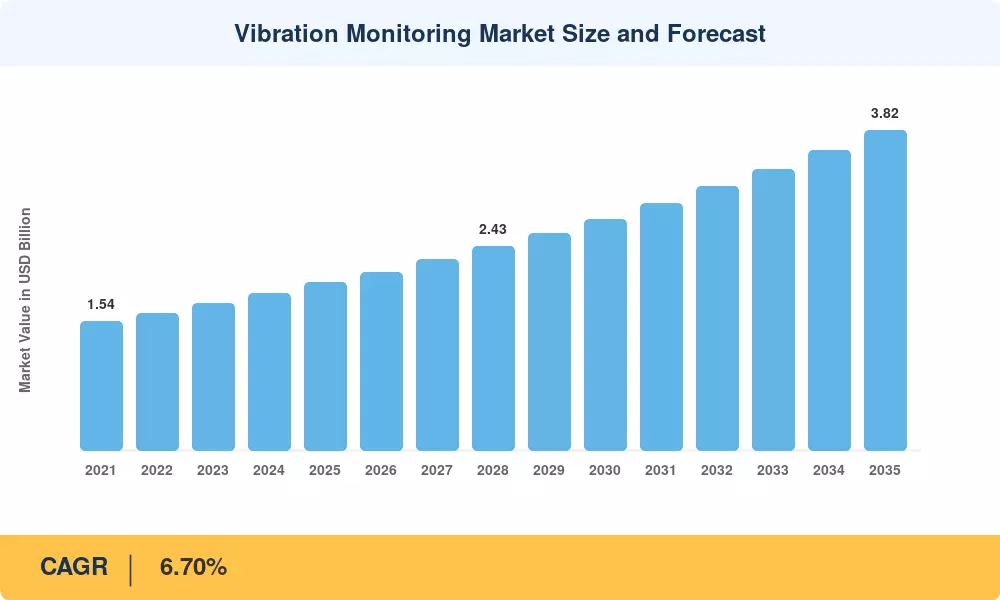
The Vibration Monitoring Market stood at USD 2.00 billion in 2025 and is projected to reach USD 2.13 billion by 2026, climbing to USD 3.82 billion by 2035 at a compound annual growth rate of 6.70% during the 2026โ€“2035 forecast window. A decisive shift from reactive maintenance to condition-based strategies is propelling this expansion, with the U.S. Department of Energy estimating that predictive maintenance programs can reduce maintenance costs by 25โ€“30% and eliminate 70โ€“75% of equipment breakdowns across industrial facilities [1]. Unplanned downtime in heavy process industries now costs an estimated USD 50 billion annually worldwide, making real-time asset health intelligence a boardroom priority rather than a plant-floor luxury.

The technology backbone of the Vibration Monitoring Market is transforming rapidly. Legacy wired piezoelectric sensor networks โ€” once the sole option for rotating-equipment diagnostics โ€” are being supplemented and in many cases replaced by wireless IIoT sensor nodes with onboard edge analytics. Cloud-hosted platforms now ingest terabytes of vibration spectral data, run machine-learning models for anomaly detection, and push prescriptive alerts directly to mobile maintenance teams. According to the World Economic Forum, smart-factory investments exceeded USD 150 billion globally in 2024, with condition monitoring identified as a top-three deployment use case [2].

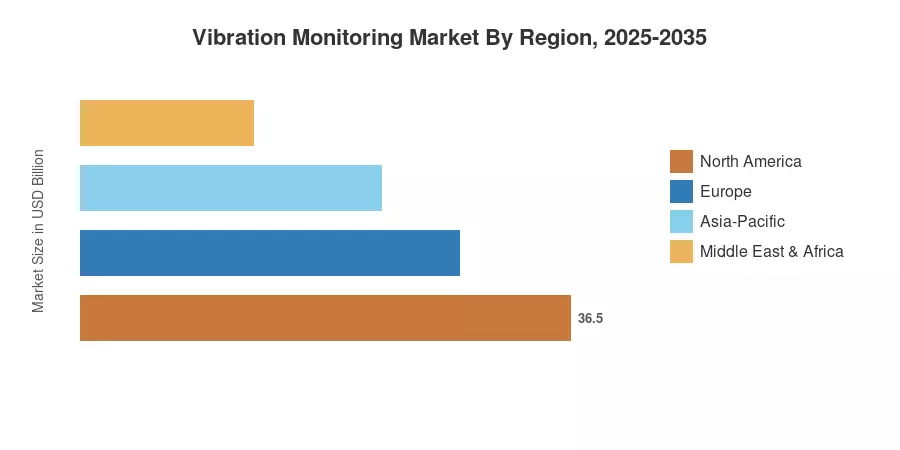
North America dominates the Vibration Monitoring Market with an estimated 39% revenue share in 2025, driven by the mature installed base in oil and gas and power generation. Asia-Pacific is the fastest-growing region at a projected 9.00% CAGR through 2035, fueled by government-backed Industry 4.0 programs in China and India. Europe holds the second-largest share at approximately 26%, supported by stringent EU Machinery Regulation compliance requirements. The next decade will reward vendors that can bridge legacy brownfield installations with scalable digital-twin ecosystems.

ย 

Key Report Takeaways

โ€ข By Component

  • Hardware retained roughly 66% of the Vibration Monitoring Market share in 2025, reflecting continued demand for accelerometers, proximity probes, and velocity transducers across brownfield plants.
  • Services posted the fastest segment CAGR at approximately 8.15% through 2035, as managed-monitoring contracts and remote diagnostics gain traction among asset-light operators.

โ€ข By Monitoring Process & Network Technology

  • Online/continuous monitoring systems commanded an estimated 58% revenue share of the Vibration Monitoring Market in 2025, underscoring operator preference for always-on fault detection.
  • Wireless network deployments are forecast to expand at a 10.95% CAGR between 2026 and 2035, narrowing the gap with entrenched wired installations.

โ€ข By Region

  • North America accounted for roughly 39% of the Vibration Monitoring Market in 2025, anchored by deep oil-and-gas and power-generation spending.
  • Asia-Pacific is projected to register the fastest regional CAGR of 9.00% from 2026 to 2035, driven by smart-manufacturing mandates and rapid industrialization.

ย 

Market Size and Forecast (2021โ€“2035)

Market Research Future derives historical estimates through triangulation of vendor financials, customs-trade databases, and end-user capital-expenditure disclosures. Forecast projections layer macroeconomic indicators, regulatory pipeline analysis, and technology-adoption curves validated through 45+ primary interviews with plant reliability engineers and procurement directors.

Vibration Monitoring Market Size and Forecast
Our Impact
Enabled $4.3B Revenue Impact for Fortune 500 and Leading Multinationals
Partnering with 2000+ Global Organizations Each Year
30K+ Citations by Top-Tier Firms in the Industry

Driver Impact Analysis

Driver ~% Impact on CAGR Geographic Relevance Impact Timeline
Shift to predictive maintenance strategies ~18% Global Short-term (โ‰ค2 yr)
IIoT sensor cost reduction & wireless proliferation ~16% North America, Asia-Pacific Medium-term (2โ€“4 yr)
Regulatory compliance in hazardous industries ~14% Europe, North America Short-term (โ‰ค2 yr)
Aging infrastructure & asset-life extension ~13% Europe, Middle East Long-term (โ‰ฅ4 yr)
Government smart-manufacturing initiatives ~12% Asia-Pacific Medium-term (2โ€“4 yr)
Digital-twin integration & edge analytics ~10% North America, Europe Long-term (โ‰ฅ4 yr)
Energy-transition & renewable asset monitoring ~8% Global Long-term (โ‰ฅ4 yr)

ย 

Shift to Predictive Maintenance

The economics of unplanned downtime have fundamentally altered procurement behavior in the Vibration Monitoring Market. A 2024 study pegged the average cost of a single unplanned shutdown in continuous-process manufacturing at USD 260,000 per hour, with oil refineries experiencing losses exceeding USD 500,000 per hour [1]. These figures have pushed capital budgets away from time-based overhaul schedules toward condition-based monitoring, where vibration spectral signatures serve as the earliest indicator of bearing degradation, misalignment, and imbalance. Federal mandates such as OSHA's Process Safety Management standard further incentivize continuous monitoring in high-hazard facilities.

IIoT Sensor Cost Reduction

MEMS-based accelerometer prices have fallen roughly 40% since 2020, dropping below USD 15 per node for industrial-grade wireless sensors [4]. This cost deflation extends monitoring coverage from critical Tier-1 assets to balance-of-plant equipment that was previously unmonitored. Battery-harvesting technologies now enable five-year sensor lifespans without maintenance, dramatically improving the total cost of ownership and widening the addressable market for the Vibration Monitoring Market.

Regulatory Compliance in Hazardous Industries

The European Union's revised Machinery Regulation (EU 2023/1230), effective January 2027, mandates digital condition-monitoring capabilities for safety-critical rotating equipment in ATEX-classified zones [5]. In North America, API 670 standards continue to tighten requirements for radial-vibration and axial-position monitoring on compressors and turbines in petroleum refining. These regulatory floors create non-discretionary demand that is relatively insensitive to economic cycles.

Government Smart-Manufacturing Programs

China's "Made in China 2025" initiative and India's Production-Linked Incentive scheme collectively channel over USD 45 billion toward industrial digitization, with condition monitoring earmarked as a qualifying technology category [8]. South Korea's Smart Factory Expansion Project aims to equip 30,000 SME factories with automated monitoring by 2027, and Japan's Connected Industries framework provides tax credits for IIoT sensor deployments. These programs compress adoption timelines across the Vibration Monitoring Market in Asia-Pacific.

ย 

Restraints Impact Analysis

The restraint percentages below represent directional drag estimates and should not be subtracted directly from the headline CAGR.

Restraint ~% Negative Impact Geographic Relevance Impact Timeline
High upfront capital costs for comprehensive systems ~22% Global (SMEs) Short-term
Skilled workforce shortage for vibration analysis ~20% Global Medium-term
Interoperability challenges across legacy OT systems ~18% Europe, North America Medium-term
Cybersecurity risks in connected monitoring networks ~15% Global Long-term
Limited ROI visibility for smaller facilities ~12% South America, MEA Short-term

ย 

Capital Cost Barriers

A comprehensive continuous-monitoring system covering 50 critical assets in a mid-sized petrochemical plant can exceed USD 1.2 million in hardware, software licensing, and integration services [11]. For small and medium enterprises operating with thin margins, this outlay competes against more immediate production investments. Subscription-based monitoring-as-a-service models are emerging to address this barrier, but adoption remains uneven in the Vibration Monitoring Market, particularly in price-sensitive regions.

Skilled Workforce Shortage

Interpreting vibration spectral data โ€” especially higher-order fault signatures like bearing-cage frequencies and gear-mesh harmonics โ€” requires ISO 18436-2 certified analysts, a talent pool that the Vibration Institute estimates grew by only 3% annually between 2020 and 2024 [12]. AI-assisted diagnostics partially offset this gap, but false-positive rates above 15% in early-stage deployments mean human expertise remains essential for final disposition decisions.

Legacy System Interoperability

Many brownfield installations in Europe and North America operate on proprietary SCADA and DCS architectures that lack standardized data interfaces [13]. Retrofitting vibration data streams into these environments requires costly middleware and custom protocol translation, slowing rollout timelines and inflating project budgets for the Vibration Monitoring Market.

ย 

Vibration Monitoring Market Opportunities

Monitoring-as-a-Service (MaaS) Business Models

A move to subscription pricing opens up a large mid-market niche that doesnโ€™t warrant capital-intensive deployments. Vendors packaging wireless sensors, cloud analytics and remote diagnostics into monthly per-asset fees can target the estimated 60% of industrial rotating equipment across the world that now runs without any vibration monitoring. This recurring revenue model significantly enhances vendor margin profiles over one-time hardware sales.

ย 

AI-Driven Prescriptive Maintenance

Machine-learning algorithms trained on multi-terabyte vibration datasets are evolving beyond anomaly detection into prescriptive recommendations โ€“ recommending precise maintenance tasks, optimal scheduling periods and spare-parts pre-positioning. According to McKinsey, prescriptive maintenance can cut the entire maintenance budget by an additional 10โ€“15% beyond predictive approaches alone [15]. This is a premium-level growth vector for Vibration Monitoring Market.

ย 

Emerging Market Industrialization

Capacity is rapidly growing in Southeast Asia and Africa, and there are greenfield opportunities to include vibration monitoring right from the start of new facilities. Vietnamโ€™s industrial output increased by 8.5% in 2024, and Nigeriaโ€™s Dangote Refinery is a complex of assets costing USD 19 billion alone that requires extensive condition monitoring [6]. These markets have adoption curves that are early stage, but can increase faster.

ย 

Renewable Energy Asset Monitoring

The global wind-turbine fleet is expected to have 1,200 GW of installed capacity by 2030, and breakdowns in gearboxes and bearings make up over 40% of turbine downtime [10]. Low-speed, high-torque powertrain applications vibration monitoring is a specific growing segment in the Vibration Monitoring Market. Remote continuous monitoring is an even greater premium in offshore wind farms where maintenance access is limited.

ย 

Data Monetization Through Digital Twins

Equipment OEMs are increasingly embedding vibration sensors at the factory and selling performance analytics subscriptions over the asset lifecycle. This "sensor-to-service" model lets OEMs monetize operational data while providing end users with guaranteed uptime contracts. Siemens and GE have both launched digital-twin platforms where vibration data feeds real-time asset-performance dashboards tied to contractual SLAs.

ย 

Vibration Monitoring Market Future Outlook

AI-Autonomous Condition Monitoring

By 2030, the convergence of physics-informed neural networks and vibration spectral analysis will enable fully autonomous fault diagnosis for over 80% of common rotating-equipment failure modes [9]. Edge-computing devices capable of running inference models locally will reduce cloud-data transfer costs by 60%, making continuous monitoring economically viable for Tier-2 and Tier-3 assets. The Vibration Monitoring Market will increasingly compete on algorithmic accuracy rather than sensor hardware specifications.

Platform Economics and Ecosystem Lock-In

Major automation vendors โ€” Emerson, Honeywell, Rockwell โ€” are embedding vibration analytics into broader asset-performance-management suites tied to multi-year subscription contracts. This platform strategy raises switching costs and consolidates spend, potentially compressing margins for independent monitoring-solution providers. The Vibration Monitoring Market will likely see top-five vendor concentration rise from an estimated 35% today to above 45% by 2032 [15].

Energy Transition and Electrification Supercycle

The IEA projects global electricity demand to grow 30% by 2035, requiring massive expansion of generation, transmission, and industrial electrification assets [10]. Every new wind turbine, battery-storage inverter, and electric-motor-driven compressor represents a monitoring node. This electrification supercycle will expand the addressable installed base for the Vibration Monitoring Market by an estimated 25โ€“30% over the decade.

ESG Reporting and Asset Reliability Linkage

Scope 2 and Scope 3 emissions reporting frameworks increasingly connect equipment reliability to carbon footprint. Unplanned flaring events caused by compressor failures, for example, directly impact reported emissions. As SEC climate-disclosure rules and EU CSRD mandates mature, reliability data from vibration monitoring programs will feed directly into ESG dashboards, elevating the Vibration Monitoring Market from an operational tool to a compliance necessity [16].

ย 

Vibration Monitoring Market Segmentation

By Component

Segment Metric Primary Demand Driver
Hardware 66% share (2025) Accelerometer and proximity-probe replacement cycles
Software USD 0.38 Billion (2025) Cloud-analytics platform licensing growth
Services 8.15% CAGR (2026โ€“2035) Managed-monitoring and remote-diagnostics contracts

ย 

Hardware continues to anchor the Vibration Monitoring Market because every new monitoring point begins with a physical sensor. Piezoelectric accelerometers and eddy-current proximity probes account for the bulk of hardware revenue, with MEMS-based wireless sensors gaining share rapidly in retrofit applications. The replacement cycle for installed sensors โ€” typically five to seven years in harsh-process environments โ€” generates a predictable aftermarket revenue stream.

Services represent the fastest-growing component as end users increasingly outsource vibration analysis to specialized firms that combine ISO 18436-certified analysts with cloud-hosted diagnostic platforms. Contract durations are lengthening from one-year renewals to three-to-five-year managed-service agreements, providing vendors with revenue visibility and operators with guaranteed response-time SLAs.

By Monitoring Process

Segment Metric Primary Demand Driver
Online / Continuous 58% share (2025) Always-on protection for critical turbomachinery
Portable USD 0.42 Billion (2025) Route-based programs for balance-of-plant assets
Wireless Remote 9.65% CAGR (2026โ€“2035) Cost-effective coverage expansion to remote assets

ย 

Online continuous systems dominate the Vibration Monitoring Market in safety-critical applications โ€” steam turbines, centrifugal compressors, and large motor-driven pumps โ€” where millisecond trip-response times are non-negotiable. Wireless remote monitoring is closing the coverage gap for assets in hard-to-reach or hazardous locations, with battery-powered nodes transmitting spectral data at user-configurable intervals.

By Network Technology

Segment Metric Primary Demand Driver
Wired 74% share (2025) Installed-base inertia and deterministic data latency
Wireless 10.95% CAGR (2026โ€“2035) IIoT cost deflation and coverage flexibility

ย 

Wired installations retain a commanding share of the Vibration Monitoring Market because process-safety standards in petroleum refining and power generation often mandate hardwired connections for machine-protection systems. Wireless networks, however, are growing at roughly double the overall market rate as WirelessHART and ISA100.11a protocols achieve SIL-2 certification, satisfying increasingly demanding reliability thresholds.

By End-User Industry

Segment Metric Primary Demand Driver
Oil & Gas 32% share (2025) Compressor and pump reliability in upstream/midstream
Energy & Power 7.80% CAGR (2026โ€“2035) Turbine fleet aging and renewable expansion
Automotive USD 0.18 Billion (2025) High-speed spindle and press monitoring
Food & Beverage 8.85% CAGR (2026โ€“2035) Regulatory hygiene requirements and uptime demands
Others (Mining, Aerospace, Pharma) USD 0.30 Billion (2025) Diverse rotating-equipment portfolios

ย 

Oil and gas remains the largest end-user vertical in the Vibration Monitoring Market, reflecting the sector's high asset criticality and long-standing regulatory mandates for turbo-machinery protection. Reciprocating compressors, centrifugal pumps, and gas-turbine generators form the backbone of monitored-asset inventories across upstream, midstream, and downstream operations. Food and beverage is the fastest-growing vertical, driven by the twin pressures of FDA/FSMA compliance and zero-downtime production targets in high-speed packaging and filling lines.

ย 

Regional Market Share Analysis

Region Metric Primary Investment Themes
North America 39.0% share (2025) O&G midstream, power-gen fleet upgrades
Europe 26.0% share (2025) EU Machinery Regulation, wind energy
Asia-Pacific 9.00% CAGR (2026โ€“2035) Smart-factory mandates, rapid industrialization
South America USD 0.14 Billion (2025) Mining and O&G brownfield modernization
Middle East & Africa USD 0.12 Billion (2025) Refinery expansion, desalination assets
Total USD 2.00 Billion (2025) โ€”

The Vibration Monitoring Market exhibits clear geographic stratification, with mature industrial economies investing in retrofit and upgrade programs while emerging economies embed monitoring into new capacity builds.

ย 

North America

Country Metric Key Driver
US 72% of regional share Shale-gas compressor stations, API 670 compliance
Canada 6.80% CAGR Oil-sands and mining asset integrity programs
Mexico USD 0.04 Billion (2025) Automotive and petrochemical plant expansion

ย 

North America's dominance in the Vibration Monitoring Market reflects the continent's massive installed base of rotating equipment across petroleum refining, LNG liquefaction, and thermal power generation. The U.S. alone operates over 140 refineries, each containing thousands of monitored assets, and the DOE's Better Plants Program has enrolled 280+ industrial partners committed to energy-intensity reductions that often begin with condition-monitoring upgrades [1].

Europe

Country Metric Key Driver
Germany 28% of regional share Automotive and heavy-machinery OEMs
UK 7.10% CAGR Offshore wind O&M spending
France USD 0.07 Billion (2025) Nuclear fleet life-extension programs
Italy 5.90% CAGR Process-industry modernization
Spain USD 0.03 Billion (2025) Renewable energy integration
Nordic Countries 6.50% CAGR Pulp-and-paper and marine applications
Russia USD 0.03 Billion (2025) Oil and gas upstream operations
Rest of Europe 5.80% CAGR Pharmaceutical and food processing

ย 

The EU Machinery Regulation's 2027 enforcement deadline is creating a compliance-driven procurement wave across the Vibration Monitoring Market in Europe. Germany's position as the continent's industrial heavyweight โ€” home to BASF, ThyssenKrupp, and Siemens Energy โ€” ensures it captures the largest regional share, while the UK's expanding offshore wind fleet generates strong demand for remote drivetrain monitoring solutions [5].

Asia-Pacific

Country Metric Key Driver
China 38% of regional share Made in China 2025, heavy-industry modernization
India 10.20% CAGR Production-Linked Incentive scheme, refinery expansion
Japan USD 0.06 Billion (2025) Connected Industries framework, aging plant upgrades
South Korea 8.50% CAGR Smart Factory Expansion Project
ASEAN 9.30% CAGR Greenfield manufacturing capacity additions
Rest of Asia-Pacific USD 0.02 Billion (2025) Mining and resource extraction

ย 

Asia-Pacific represents the highest-growth frontier in the Vibration Monitoring Market, with China's State Council allocating over USD 10 billion specifically to industrial-automation upgrades between 2024 and 2028 [8]. India's refinery expansion โ€” including the Barmer and Ratnagiri mega-projects โ€” adds substantial demand for turbo-machinery monitoring, while South Korea's target of 30,000 digitized SME factories creates volume-driven sensor adoption.

South America

Country Metric Key Driver
Brazil 58% of regional share Pre-salt offshore O&G, mining sector
Argentina 7.20% CAGR Vaca Muerta shale development
Rest of South America USD 0.02 Billion (2025) Copper and lithium mining expansion

ย 

Brazil's Petrobras-led pre-salt deepwater program and the country's sprawling iron-ore mining sector anchor South America's position in the Vibration Monitoring Market. Argentina's Vaca Muerta shale play is attracting international investment in compression and pumping infrastructure, generating incremental monitoring demand through 2035.

Middle East & Africa

Country Metric Key Driver
Saudi Arabia 34% of regional share Saudi Vision 2030, NEOM industrial zone
UAE 8.60% CAGR Refinery and desalination asset digitization
South Africa USD 0.02 Billion (2025) Mining equipment reliability programs
Egypt 7.40% CAGR Natural-gas processing expansion
Rest of MEA USD 0.01 Billion (2025) Cement and fertilizer industries

ย 

Saudi Aramco's ongoing downstream expansion โ€” including the Jafurah gas development and Ras Al-Khair industrial complex โ€” positions the Kingdom as the region's largest consumer in the Vibration Monitoring Market. The UAE's push toward non-oil industrial diversification drives monitoring adoption in desalination, aluminum smelting, and petrochemical operations.

ย 

Vibration Monitoring Market By Region, 2025-2035

Competitive Benchmarking

The Vibration Monitoring Market exhibits medium concentration, with an estimated top-five vendor share of approximately 35โ€“40% and a Herfindahl-Hirschman Index in the 800โ€“1,000 range. Competition is intensifying as major automation conglomerates integrate vibration analytics into broader digital-twin platforms, raising entry barriers for niche sensor-only suppliers. M&A activity accelerated during 2023โ€“2025 as acquirers sought edge-analytics capabilities and installed-base access.

Company Est. Revenue Share Range Key Offerings Strategic Positioning
SKF AB ~7โ€“10% Machine-condition monitoring hardware and cloud analytics Bearing-OEM integration advantage
Emerson Electric ~6โ€“9% AMS Machine Works, Plantweb digital ecosystem Process-automation suite integration
Honeywell International ~5โ€“8% ExperionPKS with embedded vibration analytics DCS-native condition monitoring
Baker Hughes (GE) ~5โ€“7% Bently Nevada System 1 platform Turbomachinery protection standard-bearer
Rockwell Automation ~4โ€“6% Dynamix monitoring, FactoryTalk Analytics Discrete-manufacturing focus
Brรผel & Kjรฆr (HBK) ~3โ€“5% Portable and online vibration analyzers Measurement-science heritage
Fluke Corporation (Fortive) ~3โ€“5% Fluke 810 vibration tester, Prรผftechnik alignment SME and field-service technician channel
PCB Piezotronics (Amphenol) ~2โ€“4% Industrial accelerometers and sensor arrays Broad sensor portfolio across industries
National Instruments (NI) ~2โ€“4% Data-acquisition platforms for custom monitoring Flexible test-and-measurement integration
Meggitt Sensing Systems (Parker) ~2โ€“3% High-temperature vibration sensors for aerospace Extreme-environment specialization

ย 

ย 

Recent News & Developments

ย 

ย 

ย 

ย 

  • Honeywell (April 2024): Partnered with Microsoft Azure to offer cloud-hosted vibration analytics through the Honeywell Forge platform, targeting mid-market process manufacturers [20].

ย 

  • Fluke (July 2021)Reliability, the global leader in machine monitoring devices and cloud-based maintenance software, announces the Fluke 3562 Screening Vibration Sensor system. With breakthrough batteryless technology, long-range sensor-to-gateway communication, and the capacity to connect up to 1,000 sensors to one gateway, the Fluke 3562 is a โ€œset it and forget itโ€ solution that can run constantly, even in hard-to-reach places.

ย 

ย 

Vibration Monitoring Market Report Scope

Parameter Detail
Market Scope Global Vibration Monitoring Market โ€” hardware, software, and services for industrial rotating-equipment diagnostics
Study Period 2021โ€“2035
CAGR (2026โ€“2035) 6.70%
Base Year Market Size (2025) USD 2.00 Billion
Forecast Endpoint (2035) USD 3.82 Billion
Fastest Growing Segment Services (by component); Wireless Remote (by monitoring process)
Companies Profiled 10
Valuation Currency USD Billion

ย 

ย 

FAQs

What payback period should a mid-sized plant expect from a vibration monitoring deployment?

Most facilities recoup investment within 12โ€“18 months through reduced unplanned downtime and lower spare-parts carrying costs. Payback shortens further when automated work-order generation is integrated [1].

How do wireless vibration sensors compare to wired systems in hazardous-area classifications?

WirelessHART and ISA100.11a sensors now hold ATEX and IECEx certifications for Zone 1 environments. Wired systems still offer lower latency for machine-protection trip functions [5].

Which certification should procurement teams require from vibration analysis service providers?

ISO 18436-2 Category III or higher ensures analysts can interpret complex spectral patterns. Require documented diagnostic accuracy rates above 90% during vendor evaluation [12].

Can vibration monitoring detect electrical faults in motors, not just mechanical issues?

Vibration spectral analysis can identify rotor-bar defects and stator eccentricity through characteristic frequency signatures at twice line frequency. Pairing with motor-current analysis improves detection confidence [9].

What data infrastructure is needed before deploying cloud-based vibration analytics in the Vibration Monitoring Market?

Facilities need reliable site-to-cloud connectivity above 5 Mbps, an OPC-UA gateway for protocol translation, and a defined data-governance policy for spectral storage retention [14].

How is the Vibration Monitoring Market adapting to low-speed machinery applications below 100 RPM?

Vendors are deploying enveloping (high-frequency demodulation) techniques and acoustic-emission sensors that detect sub-surface bearing damage invisible to conventional accelerometers [17].

What role does the Vibration Monitoring Market play in emerging carbon-disclosure regulations?

Equipment failures causing unplanned flaring directly increase reported Scope 1 emissions. Reliability data from monitoring programs feeds ESG dashboards required under SEC and EU CSRD rules [16].

ย 

ย 

Author
Author
Author Profile
Nirmit Biswas LinkedIn
Senior Research Analyst
With 5+ years of expertise in Market Intelligence and Strategic Research, Nirmit Biswas specializes in ICT, Semiconductors, and BFSI. Backed by an MBA in Financial Services and a Computer Science foundation, Nirmit blends technical depth with business acumen. He has successfully led 100+ projects for global enterprises and startups, including Amazon, Cisco, L&T and Huawei, delivering market estimations, competitive benchmarking, and GTM strategies. His focus lies in transforming complex data into clear, actionable insights that drive growth, innovation, and investment decisions. Recognized for bridging engineering innovation with executive strategy, Nirmit helps businesses navigate dynamic markets with confidence.
Co-Author
Co-Author Profile
Aarti Dhapte LinkedIn
AVP - Research
A consulting professional focused on helping businesses navigate complex markets through structured research and strategic insights. I partner with clients to solve high-impact business problems across market entry strategy, competitive intelligence, and opportunity assessment. Over the course of my experience, I have led and contributed to 100+ market research and consulting engagements, delivering insights across multiple industries and geographies, and supporting strategic decisions linked to $500M+ market opportunities. My core expertise lies in building robust market sizing, forecasting, and commercial models (top-down and bottom-up), alongside deep-dive competitive and industry analysis. I have played a key role in shaping go-to-market strategies, investment cases, and growth roadmaps, enabling clients to make confident, data-backed decisions in dynamic markets.

Research Approach

ย 

Secondary Research

The secondary research process involved comprehensive analysis of industrial automation databases, peer-reviewed engineering journals, IoT technology publications, and authoritative industrial organizations. Key sources included the International Organization for Standardization (ISO) โ€“ TC 108 (Mechanical Vibration and Shock), Institute of Electrical and Electronics Engineers (IEEE) Xplore Digital Library, American Society of Mechanical Engineers (ASME), International Society for Automation (ISA), Occupational Safety and Health Administration (OSHA) Technical Data Center, US Department of Energy Industrial Technologies Program, European Committee for Standardization (CEN) CEN/TC 321, National Institute of Standards and Technology (NIST) Manufacturing Extension Partnership, World Economic Forum Advanced Manufacturing, International Energy Agency (IEA) Energy Efficiency Indicators, US Bureau of Labor Statistics (Occupational Safety & Industrial Productivity), EU Eurostat Industrial Production Statistics, and national standards bodies (ANSI, BSI, DIN, JIS). These sources were used to collect industrial adoption statistics, safety compliance standards, sensor technology specifications, predictive maintenance ROI data, manufacturing sector growth indicators, and competitive landscape analysis for wireless vibration monitoring systems, IoT-based monitoring platforms, accelerometer technologies, and cloud-based deployment models.

ย 

Primary Research

In order to gather both qualitative and quantitative insights, supply-side and demand-side stakeholders were interviewed during the primary research process. CEOs, CTOs, VPs of Engineering, heads of Product Development, and directors of Industrial IoT divisions from manufacturers of vibration sensors, suppliers of condition monitoring solutions, and OEMs for industrial automation were examples of supply-side sources. Plant managers, reliability engineers, maintenance directors, and procurement leads from manufacturing facilities, oil and gas refineries, power production utilities, aircraft MRO facilities, and automobile assembly plants were examples of demand-side sources. In addition to gathering information on cybersecurity concerns, cloud migration tactics, and sensor integration issues, primary research verified predictive maintenance implementation trends and validated technology adoption timescales.

Primary Respondent Breakdown:

By Designation: C-level Primaries (32%), Director Level (33%), Others (35%)

By Region: North America (33%), Europe (29%), Asia-Pacific (31%), Rest of World (7%)

ย 

Market Size Estimation

Global market valuation was derived through revenue mapping and industrial installation base analysis. The methodology included:

Identification of 40+ key manufacturers across North America, Europe, Asia-Pacific, and Latin America

Product mapping across wireless vibration monitoring, wired systems, IoT-based platforms, accelerometers, velocity sensors, displacement sensors, and data acquisition systems

Analysis of reported and modeled annual revenues specific to vibration monitoring portfolios

Coverage of manufacturers representing 72-78% of global market share in 2024

Extrapolation using bottom-up (industrial facility count ร— adoption rate ร— ASP by region) and top-down (manufacturer revenue validation) approaches to derive segment-specific valuations for manufacturing, oil & gas, power generation, aerospace, and automotive end-use verticals

Download Free Sample

Kindly complete the form below to receive a free sample of this Report

Download PDF ×

We do not share your information with anyone. However, we may send you emails based on your report interest from time to time. You may contact us at any time to opt-out.