Segmentation Quick Reference
| Dimension | Sub-Segments | Dominant Segment | Fastest Growing Segment |
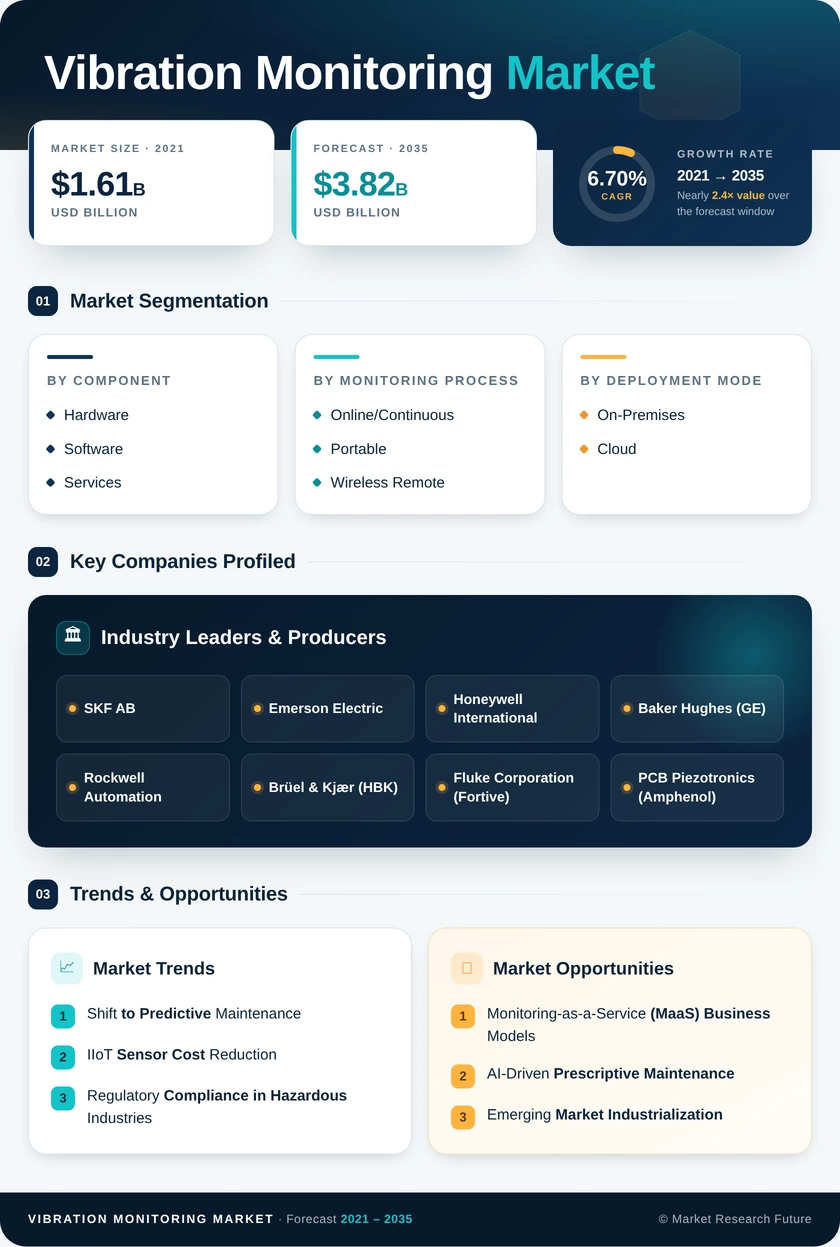
| Component | Hardware, Software, Services | Hardware | Services |
| Monitoring Process | Online/Continuous, Portable, Wireless Remote | Online/Continuous | Wireless Remote |
| Deployment Mode | On-Premises, Cloud | On-Premises | Cloud |
| Network Technology | Wired, Wireless | Wired | Wireless |
| Application | Motors and Pumps, Turbines, Compressors, Gearboxes, Others | Motors and Pumps | Turbines |
| End-User Industry | Oil and Gas, Energy and Power, Automotive, Food and Beverage, Mining, Aerospace and Defense, Others | Oil and Gas | Food and Beverage |
| Geography | North America, Europe, Asia-Pacific, South America, Middle East & Africa | North America | Asia-Pacific |
Market Segmentation Overview
By Component
| Sub-Segment | Key Trend |
| Hardware | MEMS sensor cost deflation widens coverage to non-critical assets |
| Software | Cloud-native analytics platforms displacing on-premises SCADA modules |
| Services | Multi-year managed-monitoring contracts replacing ad-hoc route-based programs |
Hardware remains the revenue foundation of every deployment, though its share will gradually compress as software and services capture a growing proportion of lifecycle spend. Vendors that bundle all three components into integrated subscriptions are winning larger, longer contracts.
By Monitoring Process
| Sub-Segment | Key Trend |
| Online / Continuous | Expanding from turbomachinery to balance-of-plant motor and pump fleets |
| Portable | Evolving from data collectors to tablet-based route apps with AI-assist |
| Wireless Remote | Battery-harvesting sensors enabling five-year maintenance-free operation |
Continuous monitoring dominates mission-critical assets, while wireless remote monitoring is the fastest-growing process category as cost-per-point drops below USD 200 for industrial-grade nodes.
By Deployment Mode
| Sub-Segment | Key Trend |
| On-Premises | Preferred in regulated sectors requiring local data sovereignty |
| Cloud | Accelerating in mid-market plants leveraging SaaS analytics platforms |
On-premises deployments retain a majority share due to cybersecurity policies in oil and gas and defense sectors, but cloud adoption is rising rapidly among manufacturers seeking lower total cost of ownership.
By Network Technology
| Sub-Segment | Key Trend |
| Wired | Retains dominance in safety-instrumented-system applications |
| Wireless | WirelessHART and ISA100.11a achieving SIL-2 certification milestones |
Wired networks will remain the backbone for machine-protection trip systems, while wireless networks expand the overall monitoring footprint to previously unmonitored asset populations.
By Application
| Sub-Segment | Key Trend |
| Motors and Pumps | Largest application segment driven by sheer volume of installed units |
| Turbines | High-value per-unit monitoring investment; growth in wind-turbine drivetrain analytics |
| Compressors | Reciprocating and centrifugal variants in O&G midstream drive demand |
| Gearboxes | Specialized enveloping techniques addressing low-speed fault detection |
| Others | Fans, blowers, conveyors, and spindles |
Motors and pumps form the widest application base across virtually every industrial sector, while turbine monitoring commands premium pricing per asset due to the criticality and value of turbomachinery.
By End-User Industry
| Sub-Segment | Key Trend |
| Oil and Gas | Compressor reliability mandates under API 670 drive adoption |
| Energy and Power | Aging thermal fleet and growing wind-energy O&M spending |
| Automotive | High-speed spindle and stamping-press monitoring for quality assurance |
| Food and Beverage | FDA/FSMA compliance and zero-downtime packaging-line requirements |
| Mining | Harsh-environment sensor demand for crushers, mills, and conveyors |
| Aerospace and Defense | Engine and auxiliary-power-unit health monitoring |
| Others | Vibration Monitoring Market, pulp and paper, water and wastewater |
Oil and gas remains the dominant end-user industry due to the sector's unmatched density of high-criticality rotating equipment and stringent regulatory environment.