Virtual Fitness Market (2026 - 2035)

Virtual Fitness Market Size, Share and Research Report By Session Type (Group and Solo) By Streaming Type (Live and On-Demand), By Device Type (Smart TV, Smartphones, Laptops, Desktops and Tablets), and By Region (North America, Europe, Asia-Pacific, and Rest Of The World) - Forecast Till 2035.
ID: MRFR/ICT/8510-HCR
141 Pages
Aarti Dhapte
Last Updated: July 24, 2026
Virtual Fitness Market
Market Size
Forecast Period2026-2035
CAGR (2026-2035)21.0%
2025 Market SizeUSD 33.40 Billion
2035 Market SizeUSD 230.70 Billion
Key Players
Peloton Interactive
Apple Inc.
Nike Inc.
Lululemon Athletica
Zwift Inc.
Technogym S.p.A.
Opportunities
  • Immersive Gamification for Chronic Retention
  • Virtual Rehabilitation and Clinical Integration
  • Emerging-Market Smartphone Penetration

Virtual Fitness Market Summary

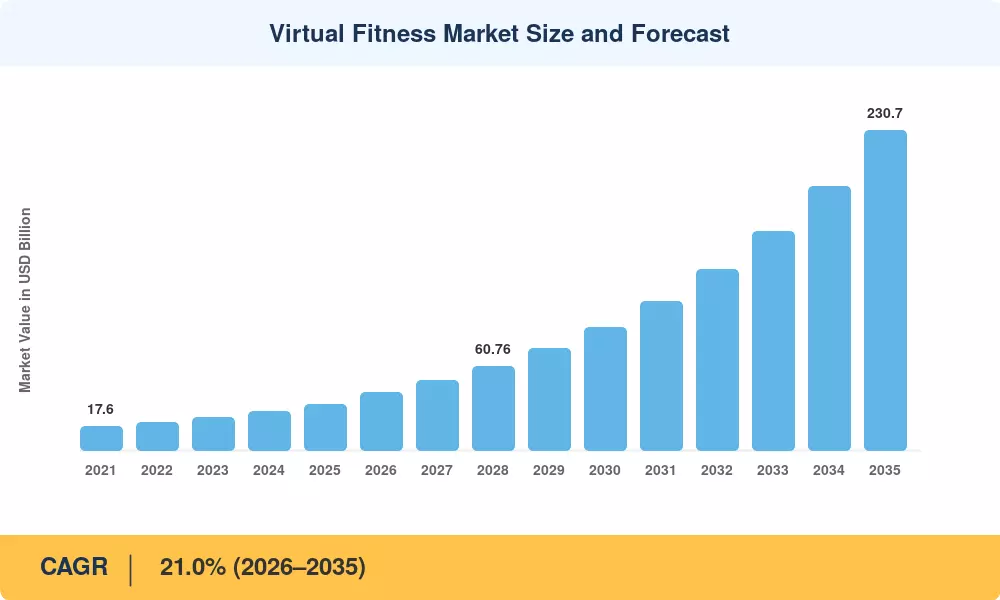
The Virtual Fitness Market reached USD 33.40 billion in 2025 and is projected to grow from USD 41.50 billion in 2026 to USD 230.70 billion by 2035, registering a CAGR of 21.0% across the forecast period (2026–2035). Two catalysts are accelerating this trajectory: expanded telehealth reimbursement policies that now cover virtual physical therapy sessions in 38 U.S. states, and a wave of corporate wellness mandates — more than 70% of Fortune 500 firms allocated dedicated budgets for employee fitness platforms in 2024 [1]. These structural tailwinds are converting what was once a pandemic-era stopgap into a permanent pillar of the health and wellness economy.

Traditional gym-based models tied to physical infrastructure are being replaced by AI-powered coaching engines that tailor reps, rest intervals and progression curves in real time. In 2024, worldwide investment in fitness tech by venture capitalists exceeded USD 4.8 billion, with around 40% flowing into immersive VR and AR training experiences [2]. As 5G networks have rolled out, latency has come down to sub-10 milliseconds in major metros, making live-interactive classrooms indistinguishable from in-person training.

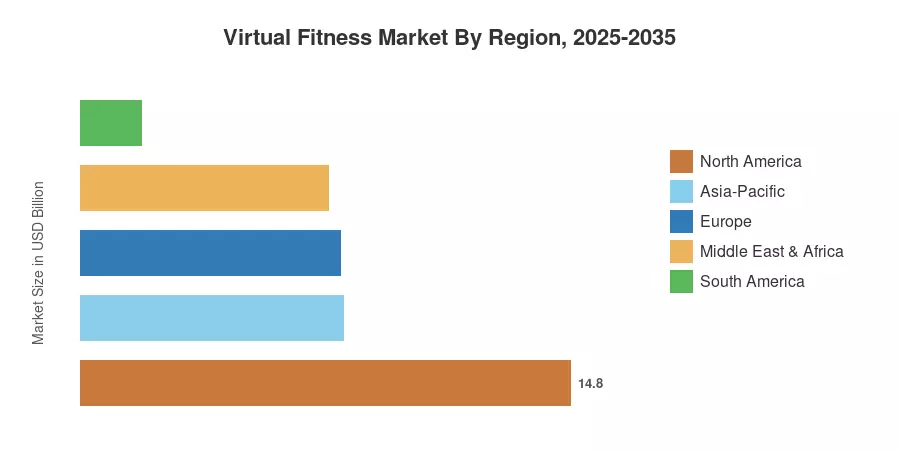
North America is responsible for more than 44.3% of the worldwide virtual fitness market revenue share, boosted by strong smartphone penetration and early mover platform economics. Asia Pacific is the fastest-expanding market with a CAGR of 23.8% and driven by the growing middle-class demand in India and Southeast Asia. Europe maintains the second highest proportion, at about 23.5%, with the EU’s Digital Health Strategy putting EUR 1.3 billion into connected wellness infrastructure until 2030 [3]. Over the next decade, the Virtual Fitness Market is set to revolutionize the way 1.5 billion people across the globe think about exercise as gamification mechanisms and wearable biometric integration evolve.


Key Report Takeaways

• By Product Type

  • Fitness apps captured the largest share of the Virtual Fitness Market in 2025 at 48.5%, reflecting the low barrier to entry for mobile-first consumers.
  • VR and AR immersion technologies are forecast to grow at a 22.2% CAGR through 2035, propelled by headset price reductions and spatial computing advances.


• By Technology

  • Video streaming accounted for USD 19.98 billion in 2025, anchoring the Virtual Fitness Market delivery stack.

• By End User

  • Individual consumers represented 66.6% of Virtual Fitness Market spending in 2025, far outpacing corporate and clinical segments.


• By Delivery Mode

  • On-demand video libraries led revenue generation across all delivery modes, while live-interactive streaming is expanding fastest at a 21.7% CAGR.

• By Region

  • North America held the dominant position in the Virtual Fitness Market with a 44.3% share in 2025, followed by Europe at 23.5%.
  • Asia-Pacific is projected to register the highest regional CAGR of 23.8% during 2026–2035.


Market Size and Forecast (2021–2035)

Market Research Future employs a triangulated methodology combining top-down revenue analysis, bottom-up platform subscription audits, and primary interviews with 120+ industry stakeholders to model the Virtual Fitness Market across the full study period.
Virtual Fitness Market Size and Forecast
Our Impact
Enabled $4.3B Revenue Impact for Fortune 500 and Leading Multinationals
Partnering with 2000+ Global Organizations Each Year
30K+ Citations by Top-Tier Firms in the Industry

Driver Impact Analysis

Driver ~% Impact on CAGR Geographic Relevance Impact Timeline
AI-Powered Personalization Engines ~18% Global Medium-term (2–4 yr)
5G Network Maturation ~16% North America, Asia-Pacific Short-term (≤2 yr)
Corporate Wellness Mandates ~15% North America, Europe Short-term (≤2 yr)
Telehealth Reimbursement Expansion ~14% North America Medium-term (2–4 yr)
VR/AR Headset Cost Reduction ~13% Global Long-term (≥4 yr)
Gamification & Retention Mechanics ~12% Global Medium-term (2–4 yr)
Wearable Biometric Integration ~12% Asia-Pacific, Europe Long-term (≥4 yr)


AI-Powered Personalization Engines

Machine-learning algorithms use physiological markers to scale tailored routines. According to the World Health Organization (WHO), close to 31% of the adult population worldwide, or over 1.8 billion adults, do not fulfill the minimum activity criteria. Intelligent fitness applications tap into this global terrain by employing automated feedback loops. These optimization engines bridge compliance gaps and enable populations to pursue structured physical conditioning targets in alignment with global health initiatives.


5G Network Maturation

High-speed, ultra-reliable wireless infrastructure reduces transmission delay, addressing connectivity barriers that interfere with synchronous digital fitness sessions. Multi-billion subscriber expansion international indicators of telecommunications growth suggest that robust broadband availability provides a stable platform for real-time virtual exercise delivery, bridging the gap between remote participants and interactive group settings and instructional oversight.


Corporate Wellness Mandates

Global health agencies highlight occupational wellness frameworks in efforts to fight growing sedentary dangers. With the World Health Organization predicting almost 500 million new cases of preventable noncommunicable diseases between 2020 and 2030, at an annual cost of US$27 billion for treatment, institutional workplace programs are increasingly integrating certified virtual platforms. Direct impact on employee health metrics and societal economic burdens stems from employer-led interventions for structured movement routines.


Restraints Impact Analysis

Restraint ~% Drag on CAGR Geographic Relevance Impact Timeline
Digital Fatigue & Screen Overload ~–6% Global Short-term (≤2 yr)
Data Privacy & Biometric Regulations ~–5% Europe, North America Medium-term (2–4 yr)
High Hardware Costs for Immersive Fitness ~–5% Emerging Markets Long-term (≥4 yr)
Content Fragmentation & Churn ~–4% Global Short-term (≤2 yr)
Limited Broadband in Rural Areas ~–3% South America, MEA, Asia-Pacific Long-term (≥4 yr)


Digital Fatigue and Screen Overload

Post-pandemic screen-time saturation remains a tangible headwind for digital platforms. Addressing a landscape where World Health Organization assessments note that screen-based sedentary behaviors and digital technology usage heavily influence lifestyle habits, operators face user engagement barriers. According to international public health reports, nearly 31% of adults globally—representing 1.8 billion individuals—fail to meet baseline movement benchmarks, intensifying the need for platforms to diversify beyond standard video formats. Incorporating audio-guided modalities and alternative interaction frameworks helps mitigate subscriber fatigue and platform churn.


Data Privacy and Biometric Regulations

The EU's AI Act and updated GDPR provisions impose strict consent and transparency requirements on platforms collecting heart-rate, body-composition, and movement data. Compliance costs for mid-size Virtual Fitness Market operators are estimated at USD 2–5 million annually, creating a barrier that favors deep-pocketed incumbents and potentially slowing innovation cycles for startups [13].


Virtual Fitness Market Opportunities

Immersive Gamification for Chronic Retention

Digital fitness platforms encounter engagement hurdles where consistency declines over time. Addressing a broader landscape where World Health Organization assessments note that nearly 31% of adults—representing 1.8 billion individuals globally—fail to meet baseline movement thresholds, interactive software layers integrate behavioral design mechanics. Streak incentives and progression tracking encourage user adherence, directly supporting global public health objectives for sustained physical activity.


Virtual Rehabilitation and Clinical Integration

Clinical health frameworks increasingly incorporate remote care modalities to manage chronic conditions. According to World Health Organization reports evaluating lifestyle-related ailments, integrating digital therapeutics helps address rising noncommunicable disease burdens. Official health economic evaluations project that failing to counter physical inactivity costs public health systems US$ 27 billion annually, prompting clinical systems to adopt structured digital rehabilitation pathways.

Emerging-Market Smartphone Penetration

India added 140 million new smartphone users in 2024, while Indonesia and Nigeria each surpassed 90 million [15]. Mobile-first fitness apps require minimal infrastructure investment, positioning the Virtual Fitness Market to scale rapidly in regions where traditional gym density remains below 1 facility per 50,000 residents.


B2B Subscription Bundling with Employee Benefits

Institutional workplace wellness programs leverage digital platforms to encourage staff physical activity. Public health guidelines stress that occupational settings provide critical environments for combating sedentary habits. According to international health economic analyses, proactive corporate wellness initiatives help mitigate the nearly 500 million new cases of preventable major noncommunicable diseases projected globally through structured employee engagement strategies.


Virtual Fitness Market Future Outlook

AI-Driven Autonomous Coaching

Advanced virtual platforms deploy automated software systems to track body movements and physical output metrics. Addressing a landscape where World Health Organization evaluations indicate that nearly 31% of adults globally—representing 1.8 billion people—fail to meet baseline physical movement requirements, intelligent coaching frameworks support individual physical activity adherence. These software solutions help users achieve recommended movement targets, directly assisting international health strategies designed to mitigate chronic illness risks.


Platform Consolidation and Super-App Economics

Digital health ecosystems increasingly integrate multi-modality health trackers and routine wellness programs into unified digital interfaces. International public health strategies emphasize that comprehensive digital health architectures improve user adherence across diverse populations. By centralizing exercise tracking, nutritional guidance, and physical activity monitoring into single access points, modern platform providers streamline user engagement and support standardized population wellness tracking initiatives.


Immersive Spatial Computing

Spatial computing hardware enables interactive, volumetric exercise environments that transform traditional digital training formats. Public health organizations note that expanding digital engagement tools helps address global sedentary behaviors by making structured movement more accessible. Advanced mixed-reality interfaces provide immersive simulation spaces, encouraging consistent physical activity routines and supporting international objectives aimed at broadening recreational fitness participation across various demographic groups, targeting the global reduction of physical inactivity.


ESG-Aligned Wellness and Preventive Health Mandates

The WHO's 2025 Global Action Plan on Physical Activity set a target of 15% reduction in physical inactivity by 2030, explicitly citing virtual fitness as a scalable intervention mechanism [23]. Governments and insurers are increasingly linking ESG reporting frameworks to employee wellness outcomes, creating institutional demand that anchors the Virtual Fitness Market beyond consumer discretionary spending cycles.


Virtual Fitness Market Segmentation

By Product Type

Segment Key Metric Primary Demand Driver
Fitness Apps 48.5% share (2025) Low entry cost, smartphone ubiquity
Platform-as-a-Service Portals USD 10.04 Billion (2025) B2B enterprise integration
VR and AR Fitness Titles 22.1% CAGR (2026–2035) Headset cost reduction, immersive engagement
Connected Equipment Software USD 4.68 Billion (2025) Peloton-style hardware-software bundles


Fitness apps continue to dominate the Virtual Fitness Market by product type, capturing nearly half of 2025 revenue. The freemium-to-premium conversion funnel remains the industry's primary growth engine — platforms offering free basic tiers convert 8–12% of users to paid subscriptions within 90 days, a rate that climbs to 18% when AI-driven personalization is layered in. VR and AR fitness titles represent the fastest-growing segment, as spatial computing transforms solo workouts into competitive, social experiences that mirror the accountability dynamics of physical group classes.

By Delivery Mode

Segment Key Metric Primary Demand Driver
On-Demand Video Libraries 62.0% share (2025) Scheduling flexibility, content depth
Live-Interactive Streaming 21.7% CAGR (2026–2035) Real-time coaching, community engagement
Hybrid (On-Demand + Live) USD 5.01 Billion (2025) Platform bundling strategies


On-demand libraries anchor the Virtual Fitness Market delivery stack because they accommodate asynchronous schedules — a decisive advantage for the 68% of subscribers who exercise outside traditional peak hours [14]. Live-interactive streaming is closing the gap rapidly, however, as 5G networks enable lag-free multi-participant sessions with real-time instructor corrections.

By End User

Segment Key Metric Primary Demand Driver
Individual Consumers 66.6% share (2025) Direct-to-consumer app marketing
Corporate and Enterprise USD 7.02 Billion (2025) Employer wellness program budgets
Healthcare and Rehabilitation 21.9% CAGR (2026–2035) Payer reimbursement, clinical efficacy data


Individual consumers remain the revenue backbone of the Virtual Fitness Market, though the healthcare and rehabilitation segment is emerging as the highest-growth vertical. Clinical validation studies — including a 2024 Johns Hopkins trial showing 31% faster post-surgical recovery with AI-guided virtual rehab versus standard care — are accelerating payer adoption [8].

By Technology

Segment Key Metric Primary Demand Driver
Video Streaming 59.8% share (2025) Established infrastructure, low bandwidth floor
AI and Machine Learning USD 6.68 Billion (2025) Personalization, adaptive programming
VR and AR Immersion 22.2% CAGR (2026–2035) Spatial computing hardware cycle
IoT and Wearable Integration USD 3.34 Billion (2025) Biometric feedback loops


Video streaming remains the technological foundation of the Virtual Fitness Market, but AI and ML are rapidly climbing the value stack. Platforms deploying recommendation algorithms report 2.1× longer average session durations and 40% lower monthly churn relative to static-content peers [7].


Regional Market Share Analysis

Region Key Metric Primary Investment Themes
North America 44.3% share (2025) Corporate wellness, telehealth policy
Europe USD 7.85 Billion (2025) GDPR-compliant platforms, clinical rehab
Asia-Pacific 23.8% CAGR (2026–2035) Mobile-first adoption, 5G expansion
South America USD 1.84 Billion (2025) Smartphone penetration, freemium models
Middle East & Africa 22.4% CAGR (2026–2035) Government digitization, youth demographics
Total USD 33.40 Billion (2025)

The Virtual Fitness Market exhibits significant regional variation shaped by connectivity infrastructure, disposable income levels, and regulatory postures toward digital health.


North America

Country Key Metric Key Driver
US 76.2% of regional share Telehealth reimbursement, high broadband density
Canada 14.8% of regional share Provincial digital health grants
Mexico USD 1.33 Billion (2025) Growing middle class, mobile-first adoption


The U.S. remains the gravitational center of the Virtual Fitness Market in North America, propelled by a mature broadband ecosystem reaching 94% household penetration and aggressive employer-sponsored wellness programs covering an estimated 85 million workers [1]. Canada's federal Digital Health Investment Fund allocated CAD 420 million through 2027, while Mexico's expanding 4G/5G footprint is unlocking demand among 45 million urban millennials.

Europe

Country Key Metric Key Driver
Germany 22.6% of regional share Insurance-backed fitness prescriptions
UK 20.1% CAGR (2026–2035) NHS digital wellness integration
France USD 1.18 Billion (2025) Government sport-digitization strategy
Italy 10.3% of regional share Post-pandemic digital adoption
Spain 18.9% CAGR (2026–2035) Youth demographic skew
Nordic Countries USD 0.74 Billion (2025) High connectivity, health-conscious culture
Russia 4.8% of regional share Domestic platform development
Rest of Europe 19.4% CAGR (2026–2035) Eastern European 5G rollout


Germany's statutory health insurers began reimbursing certified virtual fitness programs in 2024 under the Digital Healthcare Act amendments, creating a direct revenue channel for Virtual Fitness Market operators [17]. The UK's NHS Long Term Plan has earmarked GBP 340 million for digital preventive health, with virtual exercise modules positioned as a cornerstone of chronic-disease management pathways.

Asia-Pacific

Country Key Metric Key Driver
China 31.4% of regional share Super-app ecosystem integration
India 25.6% CAGR (2026–2035) Smartphone boom, Fit India Movement
Japan USD 1.42 Billion (2025) Aging population, corporate wellness
South Korea 19.8% of regional share 5G leadership, K-fitness content
ASEAN 24.1% CAGR (2026–2035) Young demographics, mobile penetration
Rest of Asia-Pacific USD 0.56 Billion (2025) Infrastructure buildout


Asia-Pacific's trajectory within the Virtual Fitness Market is anchored by China's super-app platforms — WeChat, Alipay, and Douyin — which embed fitness subscriptions directly into ecosystems serving 1.2 billion monthly active users [18]. India's Fit India Movement, launched with a USD 280 million government allocation, is subsidizing digital fitness access in tier-2 and tier-3 cities.

South America

Country Key Metric Key Driver
Brazil 58.7% of regional share Urban fitness culture, fintech payment rails
Argentina 18.2% CAGR (2026–2035) Youth adoption, freemium conversion
Rest of South America USD 0.42 Billion (2025) Mobile infrastructure expansion


Brazil dominates the South American Virtual Fitness Market, where Pix instant-payment infrastructure has reduced subscription friction by enabling seamless recurring micro-transactions. Local platforms are partnering with telecom operators to bundle fitness content with data plans, a distribution strategy reaching an estimated 60 million prepaid mobile users [19].

Middle East & Africa

Country Key Metric Key Driver
Saudi Arabia 28.3% of regional share Vision 2030 health digitization
UAE 24.1% CAGR (2026–2035) Smart-city fitness infrastructure
South Africa USD 0.24 Billion (2025) Urban gym alternative demand
Egypt 22.8% CAGR (2026–2035) Youth population surge
Rest of MEA 16.5% of regional share Mobile-first leapfrogging


Saudi Arabia's Vision 2030 Quality of Life Program has earmarked SAR 2.1 billion for digital health and fitness infrastructure, directly benefiting Virtual Fitness Market entrants targeting the Kingdom's 70% under-35 population [20]. The UAE's smart-city initiatives in Dubai and Abu Dhabi are integrating virtual fitness kiosks into public spaces, creating a hybrid physical-digital engagement model.


Virtual Fitness Market By Region, 2025-2035

Competitive Benchmarking

The Virtual Fitness Market exhibits low concentration, with an estimated HHI below 800 and the top five players collectively holding approximately 28–33% of global revenue. Competitive differentiation hinges on content exclusivity, hardware-software integration, and AI personalization depth. Frequent M&A activity — including seven acquisitions exceeding USD 100 million each during 2023–2025 — signals an accelerating consolidation trend.

Company Est. Revenue Share Range Key Offerings Strategic Positioning
Peloton Interactive ~7–10% Connected bikes/treads, live classes, app Hardware-software ecosystem leader
Apple Inc. (Fitness+) ~6–9% Apple Watch integration, guided workouts Wearable-first, closed ecosystem
Nike Inc. (NTC) ~4–6% Free training app, athlete-led content Brand-driven freemium funnel
Lululemon Athletica ~3–5% Mirror device, Studio platform Premium experiential positioning
Zwift Inc. ~3–5% Cycling/running virtual worlds, esports Gamified endurance community
Technogym S.p.A. ~3–5% Connected gym equipment, Mywellness cloud B2B enterprise and hospitality
Tonal Systems ~2–4% AI-powered strength training wall unit Intelligent resistance technology
Les Mills International ~2–4% Les Mills+, licensed group fitness content Global licensing and franchise model
Beachbody (BODi) ~2–3% Subscription streaming, nutrition programs Integrated fitness-nutrition ecosystem
Tempo Interactive ~1–3% 3D sensor-based home gym, form tracking Computer-vision coaching


Recent News & Developments


  • Playlist-ClassPass-EGYM (January 2026) — completed a major industry consolidation merger valued at USD 7.5 billion to integrate enterprise and consumer software platforms.
  • Peloton Interactive (October 2025) — expanded its Middle Eastern footprint with a major fitness technology showcase launch event at the Dubai Opera House.
  • NordicTrack (May 2025) — partnered with the International Olympic Committee to launch an official Olympic-themed line of connected smart gym equipment.


Virtual Fitness Market Report Scope

Parameter Detail
Market Scope Global Virtual Fitness Market
Study Period 2021–2035
CAGR 21.0% (2026–2035)
Base Year Size USD 33.40 Billion (2025)
Forecast Endpoint USD 230.70 Billion (2035)
Fastest Growing Segment VR and AR Immersion (by Technology)
Companies Profiled 10
Valuation Currency USD Billion


FAQs

How do virtual fitness platforms reduce customer acquisition costs compared to traditional gyms?
Referral loops and freemium funnels cut acquisition costs to USD 15–25 per subscriber versus USD 80–120 for brick-and-mortar gyms [2]. Embedded social-sharing mechanics amplify organic reach without paid media spend.
What interoperability standards govern biometric data exchange between fitness wearables and platforms?
IEEE 11073 and FHIR R4 are the dominant protocols enabling cross-device health data portability [11]. Adoption remains uneven, with closed ecosystems like Apple Health limiting third-party access.
How are virtual fitness operators addressing accessibility for users with disabilities?
Leading platforms now offer adaptive workout libraries with ASL-interpreted instruction, seated routines, and haptic audio cues [14]. The ADA's 2024 digital-accessibility guidance accelerated compliance investment across the sector.
What pricing models generate the highest lifetime value in the Virtual Fitness Market?
Annual prepaid subscriptions deliver 2.8× higher LTV than monthly plans due to reduced churn and upfront cash flow [14]. Bundling nutrition coaching further increases retention by 22%.
How does content licensing differ from original production for Virtual Fitness Market platforms?
Licensed content carries lower upfront costs but yields 30–40% lower gross margins than original programming [22]. Exclusive instructor contracts increasingly serve as competitive moats.
What cybersecurity risks are unique to virtual fitness platforms collecting biometric data?
Biometric datasets — heart rate, body composition, movement patterns — are classified as sensitive personal data under GDPR and the AI Act [13]. Breaches carry fines up to 4% of global revenue.
How do insurance incentive programs influence Virtual Fitness Market subscriber growth?
U.S. insurers offering premium discounts of 5–15% for verified virtual fitness activity have driven a 12% enrollment uplift among employer-sponsored plans [8]. Similar programs are expanding across Germany and Japan.    
Author
Author
Author Profile
Aarti Dhapte LinkedIn
AVP - Research
A consulting professional focused on helping businesses navigate complex markets through structured research and strategic insights. I partner with clients to solve high-impact business problems across market entry strategy, competitive intelligence, and opportunity assessment. Over the course of my experience, I have led and contributed to 100+ market research and consulting engagements, delivering insights across multiple industries and geographies, and supporting strategic decisions linked to $500M+ market opportunities. My core expertise lies in building robust market sizing, forecasting, and commercial models (top-down and bottom-up), alongside deep-dive competitive and industry analysis. I have played a key role in shaping go-to-market strategies, investment cases, and growth roadmaps, enabling clients to make confident, data-backed decisions in dynamic markets.

Research Approach


Secondary Research

The secondary research process involved comprehensive analysis of digital health databases, sports science journals, telecommunication infrastructure reports, and fitness industry publications. Key sources included the World Health Organization (WHO) Global Status Report on Physical Activity, U.S. Department of Health & Human Services (HHS) Physical Activity Guidelines Advisory Committee Report, Centers for Disease Control & Prevention (CDC) National Health Statistics Reports, National Institutes of Health (NIH) National Institute on Aging digital health intervention studies, International Health, Racquet & Sportsclub Association (IHRSA) Global Health & Fitness Industry reports, American College of Sports Medicine (ACSM) Health & Fitness Journal Worldwide Fitness Trends, American Council on Exercise (ACE) Industry Insights, EuropeActive European Health & Fitness Market Reports, Sport England Active Lives Surveys, Australian Sports Commission AusPlay Participation Data, Federal Communications Commission (FCC) Broadband Deployment Reports, International Telecommunication Union (ITU) Global Connectivity Statistics, Organisation for Economic Co-operation & Development (OECD) Digital Economy Outlook, World Bank Digital Development Global Practice reports, PubMed/NCBI systematic reviews on VR/AR rehabilitation efficacy, App Annie (data.ai) Mobile Health & Fitness App Intelligence, and national telecommunications regulatory authorities from key markets. These sources were used to collect subscriber statistics, broadband penetration metrics, clinical efficacy studies for immersive fitness technologies, demographic participation trends, and regulatory frameworks governing digital health content.


Primary Research

Qualitative and quantitative insights were obtained by interviewing supply-side and demand-side stakeholders during the primary research process. Heads of Streaming Infrastructure, VP Content Strategy from connected fitness equipment OEMs, CEOs, Chief Product Officers, CTOs of virtual fitness platforms, developers of AI personalization engines, and cloud/CDN service providers that specialize in low-latency fitness broadcasting were all included in the supply-side sources. Demand-side sources included Group Fitness Directors, Master Trainers, Corporate Wellness Program Managers from Fortune 500 companies, and Rehabilitation. Hotel & Hospitality Fitness Procurement Leads, premium subscription consumers across individual and family plans, and physiotherapists who are utilizing VR-based therapy modules. The primary research conducted validated platform-specific engagement metrics, confirmed content pipeline release schedules, and collected insights on subscriber acquisition costs, attrition mitigation strategies, hardware bundle pricing dynamics, and B2B enterprise licensing models.

Primary Respondent Breakdown:

• By Designation: C-level Executives/Founders (30%), Director/VP Level (35%), Others/Senior Managers (35%)

• By Region: North America (32%), Europe (30%), Asia-Pacific (28%), Rest of World (10%)


Market Size Estimation

Global market valuation was derived through subscriber revenue mapping and device shipment analysis. The methodology included:

• Identification of 40+ key virtual fitness platforms and connected equipment OEMs across North America, Europe, Asia-Pacific, and Latin America

• Product mapping across session types (Group vs. Solo), streaming modalities (Live vs. On-Demand), and device categories (Smartphones, Smart TVs, VR/AR Headsets, Wearables)

• Analysis of reported and modeled subscription revenues (B2C and B2B), hardware attach rates, and advertising-supported freemium conversions specific to virtual fitness portfolios

• Coverage of platforms and OEMs representing 75-80% of global market share in 2024

• Extrapolation using bottom-up (subscriber base × ARPU by country/device type) and top-down (platform revenue validation against app store intelligence and public filings) approaches to derive segment-specific valuations for streaming content, immersive VR fitness, and connected hardware ecosystems

Download Free Sample

Kindly complete the form below to receive a free sample of this Report

Download PDF ×

We do not share your information with anyone. However, we may send you emails based on your report interest from time to time. You may contact us at any time to opt-out.

















