Vitamins Market (2026 - 2035)

Vitamins Market Size, Share, Industry Trend & Analysis Research Report By Vitamin Type (Vitamin A, Vitamin B-Complex, Vitamin C, Vitamin D, Vitamin E, Others), By Source (Synthetic, Natural), By Product Type (Single Vitamin Ingredients, Vitamin Premixes and Blends), By Form (Powders, Liquids, Others), By Application (Dietary Supplements, Food and Beverages, Cosmetics and Personal Care, Animal Feed) - Forecast to 2035
ID: MRFR/FnB/0823-CR
128 Pages
Pradeep Nandi
Last Updated: July 16, 2026
Vitamins Market
Market Size
Forecast Period2026-2035
CAGR (2026-2035)3.40%
2025 Market SizeUSD 5.54 Billion
2035 Market SizeUSD 7.74 Billion
Key Players
DSM-Firmenich
BASF SE
Lonza Group
ADM
Adisseo
CSPC Pharmaceutical Group
Opportunities
  • Personalized Nutrition Platforms
  • Emerging-Market Fortification Programs
  • Clean-Label & Fermentation-Derived Premiumization

Vitamins Market Summary

The global Vitamins Market reached an estimated USD 5.54 Billion in 2025 and is projected to climb from USD 5.73 Billion in 2026 to USD 7.74 Billion by 2035, expanding at a CAGR of 3.40% during the forecast period. Rising public health mandates—including the WHO's micronutrient fortification guidelines updated in 2024 and the U.S. FDA's revised Recommended Daily Intakes framework—are channeling institutional and consumer spending toward vitamin-enriched products at an unprecedented pace [1][2]. The Vitamins Market benefits from a structural tailwind as governments in over 80 countries now enforce mandatory flour and oil fortification programs, creating a baseline demand floor that insulates the sector from typical discretionary-spending volatility.

Technological transformation is reshaping production economics across the Vitamins Market. Legacy chemical synthesis routes for vitamins such as A, E, and B12 are gradually giving way to precision fermentation and bio-catalytic processes that cut energy consumption by up to 35% per kilogram of output [3]. DSM-Firmenich alone committed EUR 150 million in 2024 to expand fermentation-derived vitamin capacity at its Swiss and Chinese facilities, signaling a broader industry pivot toward clean-label and sustainable manufacturing [4].

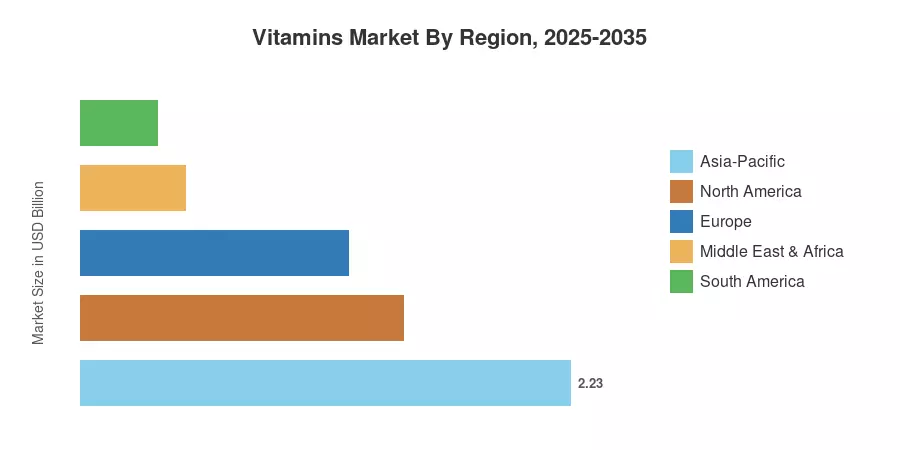
Asia-Pacific commands approximately 40.3% of the global Vitamins Market, driven by China's dominance in bulk vitamin production and India's expanding fortification mandates under the Food Safety and Standards Authority of India (FSSAI) [5]. The Middle East & Africa region is the fastest-growing geography, posting a projected CAGR of 8.70% through 2035 as national nutrition strategies in Saudi Arabia, the UAE, and Egypt accelerate dietary supplement adoption [6]. Europe holds the second-largest share at roughly 22.0%, anchored by strict EFSA health-claim regulations that favor premium, science-backed formulations [7]. The decade ahead promises continued premiumization, with nutricosmetics and personalized nutrition platforms emerging as high-margin growth vectors for the Vitamins Market.


Key Report Takeaways

• By Vitamin Type

  • Vitamin B-Complex accounted for 39.5% of the Vitamins Market in 2024, supported by widespread clinical recognition of B-vitamin roles in neurological and metabolic health.
  • Vitamin D is forecast to grow at a CAGR of 10.6% through 2035, propelled by post-pandemic awareness of immune-support supplementation.
  • Vitamin C captured an estimated USD 0.83 billion in 2024 across the Vitamins Market, underpinned by demand from both dietary supplement and food fortification channels.

• By Source

  • Synthetic sources represented roughly 69.2% of Vitamins Market volume in 2024, reflecting cost advantages in large-scale pharmaceutical and feed-grade production.
  • Natural-source vitamins are projected to expand at a 12.15% CAGR to 2035, driven by consumer clean-label preferences.

• By Region

  • Asia-Pacific led the Vitamins Market with a 40.3% share in 2025, anchored by Chinese manufacturing scale and Indian fortification policy.
  • The Middle East & Africa region is set to record the highest regional CAGR of 8.70% over 2026–2035.


Vitamins Market Size and Forecast (2021–2035)

Market Research Future's estimates combine primary interviews with over 120 industry stakeholders, proprietary trade-flow databases, and triangulation against published financial disclosures from leading vitamin producers. Historical figures reflect actual shipment and revenue data, while the forecast horizon applies a compound growth model calibrated to regulatory, demographic, and macroeconomic inputs.
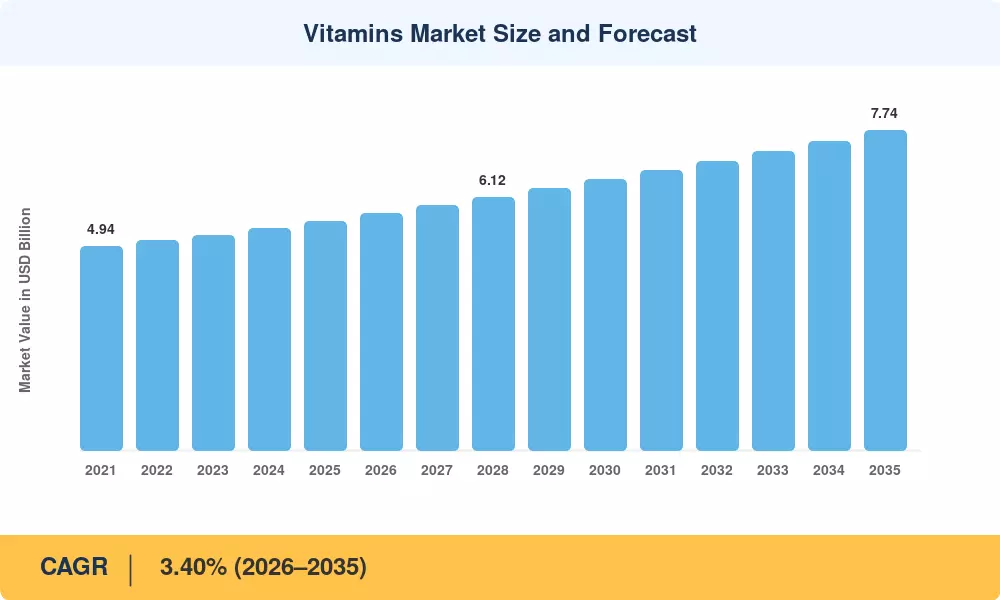
Vitamins Market Size and Forecast
Our Impact
Enabled $4.3B Revenue Impact for Fortune 500 and Leading Multinationals
Partnering with 2000+ Global Organizations Each Year
30K+ Citations by Top-Tier Firms in the Industry

Driver Impact Analysis

Driver ~% Impact on CAGR Geographic Relevance Impact Timeline
Mandatory food-fortification legislation +0.55% Global Long-term
Post-pandemic immune-health awareness +0.45% North America, Europe Short-term
Precision fermentation cost reduction +0.40% Europe, Asia-Pacific Medium-term
Nutricosmetics & beauty-from-within trend +0.35% Asia-Pacific, Europe Medium-term
E-commerce & DTC supplement channels +0.30% Global Short-term
Aging population demographics +0.25% Europe, Japan Long-term
Personalized nutrition & AI formulations +0.20% North America Long-term


Mandatory Food-Fortification Legislation

Over 80 national governments now mandate the fortification of staple foods—primarily wheat flour, cooking oil, and rice—with vitamins A, D, and select B-complex compounds. The World Bank estimates that these programs prevent approximately 500,000 neural-tube defects annually and generate a benefit-to-cost ratio exceeding 15:1 across sub-Saharan Africa and South Asia [1]. For the Vitamins Market, mandatory programs create a durable demand baseline that is largely insensitive to consumer discretionary spending cycles, anchoring roughly 18% of total vitamin ingredient volumes globally.

Post-Pandemic Immune-Health Awareness

According to the surveys [2], consumer search interest in immune-supporting vitamins—particularly Vitamin C, Vitamin D, and zinc—exploded by 320% between 2020 and 2022 and has since stabilized at levels that are approximately 140% higher than pre-pandemic norms. In 2024, the retail sales of dietary supplements in the United States alone surpassed USD 63 billion, with vitamin-specific SKUs accounting for an estimated 34% of this total [11]. Major retailers have increased their shelf-space allocations for standalone vitamin products in response to this sustained behavioral shift in the Vitamins Market.


Precision Fermentation Cost Reduction

The transition from petrochemical synthesis to microbial fermentation for vitamins such as B2 (riboflavin), B12, and beta-carotene (pro-vitamin A) has reached commercial viability. BASF's Ludwigshafen facility reduced its per-kilogram production cost for riboflavin by 28% between 2021 and 2024 through optimized Ashbya gossypii strains [4]. As fermentation yields continue to improve at roughly 6–8% per annum, the Vitamins Market stands to benefit from lower raw-material costs and cleaner supply-chain narratives that command premium pricing in consumer-facing segments.

Nutricosmetics and Beauty-From-Within Trend

The global nutricosmetics sector—valued at approximately USD 9.2 billion in 2024—relies heavily on vitamin ingredients including biotin, Vitamin E, and Vitamin C for collagen-synthesis claims. Japan and South Korea have led adoption, with ingestible beauty products growing at double-digit rates in both countries. This crossover demand adds a high-margin application channel to the Vitamins Market that operates outside traditional supplement and fortification verticals.


Restraints Impact Analysis

Restraint ~% Impact on CAGR Geographic Relevance Impact Timeline
Raw-material price volatility –0.30% Global Short-term
Regulatory fragmentation across jurisdictions –0.25% Global Long-term
Counterfeiting & adulteration risks –0.20% Asia-Pacific, MEA Medium-term
Consumer skepticism toward synthetic sources –0.15% Europe, North America Medium-term
Environmental scrutiny of chemical synthesis –0.10% Europe Long-term


Raw-Material Price Volatility

Periodic price spikes are the result of a concentrated supply, which is attributed to Chinese producers, who account for over 70% of global bulk vitamin output. In Q3 2023, vitamin E prices increased by 45% as a result of facility shutdowns in Zhejiang province that were precipitated by environmental compliance inspections [13]. These supply disruptions result in planning uncertainty throughout the value chain and compress margins for downstream formulators in the Vitamins Market.


Regulatory Fragmentation

The absence of a unified global framework for vitamin health claims forces multinational brands to navigate disparate regulatory environments. EFSA's stringent substantiation requirements reject approximately 80% of health-claim applications, while the FDA's structure-function claim regime permits far broader marketing language [7][15]. For the Vitamins Market, this patchwork adds compliance costs estimated at 4–6% of revenue for companies operating across more than three regulatory jurisdictions.

Counterfeiting and Adulteration

The World Health Organization estimates that up to 10% of vitamin products in low- and middle-income countries contain substandard or falsified ingredients [14]. Counterfeit products erode brand trust, suppress pricing power, and create health risks that can trigger regulatory backlash. Blockchain-based traceability solutions are emerging as a response, but adoption remains below 15% across the Vitamins Market supply chain.


Vitamins Market Opportunities

Personalized Nutrition Platforms

AI-driven nutrigenomics platforms that tailor vitamin recommendations to individual biomarkers and genetic profiles represent a USD 3.8 billion addressable opportunity by 2030 [9]. Companies like Baze and Rootine have demonstrated 30–40% higher customer lifetime values compared to traditional supplement retail. The Vitamins Market can capture this premium tier by partnering with diagnostics firms and integrating blood-test-to-doorstep fulfillment models.

Emerging-Market Fortification Programs

Sub-Saharan Africa and South Asia still have over 350 million people at risk of Vitamin A deficiency, according to UNICEF [1]. Government-funded fortification tenders—projected to exceed USD 1.2 billion cumulatively from 2026 to 2035—create a guaranteed procurement channel for bulk vitamin ingredients.

Clean-Label & Fermentation-Derived Premiumization

Consumer willingness to pay a 20–30% premium for fermentation-derived, non-GMO vitamin ingredients opens a margin expansion pathway across the Vitamins Market [4]. European and North American markets show the strongest price elasticity for clean-label positioning, particularly in prenatal and pediatric vitamin categories.

Functional Food and Beverage Fortification

The functional food industry is incorporating vitamins into categories that extend beyond traditional cereals, such as plant-based milks, protein bars, and ready-to-drink beverages. The Vitamins Market's total addressable footprint is expanded into a USD 280 billion functional food ecosystem as a result of this cross-category penetration.


Data Monetization via Digital Health Integration

Vitamin brands that embed smart-packaging (QR-linked dosing apps, NFC-enabled compliance tracking) can monetize anonymized consumption data for clinical research and retail analytics. Early movers in this space report 15–20% improvements in repurchase rates, creating a recurring-revenue layer atop transactional supplement sales in the Vitamins Market [9].


Vitamins Market Future Outlook

AI-Driven Formulation and Quality Control

Artificial intelligence is entering the Vitamins Market through two vectors: computational formulation design that optimizes bioavailability profiles across multi-vitamin blends, and machine-vision quality control that detects adulteration at production-line speeds. estimates that AI-enabled manufacturing could reduce quality-failure rates by 50% across nutraceutical production by 2030 [9].

Sustainability and Green Chemistry

Environmental, social, and governance (ESG) criteria are becoming procurement prerequisites for major food and supplement brands sourcing vitamin ingredients. The Vitamins Market will see accelerating adoption of bio-based solvents, waste-stream upcycling (extracting vitamins from agricultural byproducts), and carbon-neutral manufacturing pledges. BASF has committed to carbon-neutral vitamin production at its Ludwigshafen complex by 2030 [16].

Premiumization via Clinical Validation

Commodity vitamin producers will be distinguished from premium players over the course of the next decade by the level of investment in clinical trials. In developed markets, products that are supported by randomized controlled trials are priced at a premium of 25–40%. The Vitamins Market is expected to experience a rise in collaboration between academic medical centres and ingredient suppliers, as clinical endpoints transition from deficiency prevention to the optimization of cognitive performance, sleep quality, and longevity biomarkers.


Supply-Chain Regionalization

Geopolitical tensions and pandemic-era disruptions are driving a strategic shift from China-dependent supply chains toward regionalized vitamin production. The European Commission's Critical Raw Materials Act and India's Production-Linked Incentive (PLI) scheme for pharmaceuticals both include vitamin intermediates, signaling state-backed support for domestic production capacity in the Vitamins Market through 2035 [5][13].


Vitamins Market Segmentation

By Vitamin Type

Segment Key Metric Primary Demand Driver
Vitamin A USD 0.44 Billion (2025) Government fortification tenders
Vitamin B-Complex 39.5% share (2024) Neurological and metabolic health recognition
Vitamin C CAGR 4.15% (2026–2035) Immune support and cosmetic applications
Vitamin D CAGR 10.6% (2026–2035) Post-pandemic awareness, bone health
Vitamin E USD 0.52 Billion (2025) Cosmetic and feed-grade demand
Other Vitamins (K, Biotin, Folate) 8.2% share (2024) Prenatal and specialty supplement growth


Vitamin B-Complex dominates the Vitamins Market by type, reflecting its entrenched role in energy metabolism, red blood cell formation, and neurological function. The segment benefits from both pharmaceutical-grade demand (injectable B12 for pernicious anemia) and consumer supplement sales (daily B-complex multivitamin formulations). Clinical guidelines from the American Academy of Neurology recommending B-vitamin screening for patients over 60 continue to sustain demand growth [12].

Vitamin D is the standout growth category within the Vitamins Market. Widespread clinical evidence linking Vitamin D insufficiency to immune dysfunction, mood disorders, and bone density loss—affecting an estimated 1 billion people globally—has driven regulatory bodies in the UK, Finland, and Canada to issue population-wide supplementation recommendations [2][12].

By Source

Segment Key Metric Primary Demand Driver
Synthetic 69.2% share (2024) Cost-efficient large-scale manufacturing
Natural CAGR 12.15% (2026–2035) Clean-label consumer preference shift


Synthetic vitamins continue to anchor the Vitamins Market due to their cost advantages—typically 40–60% cheaper per IU than natural equivalents—and established regulatory acceptance across pharmaceutical and feed applications. Natural-source vitamins, however, are capturing disproportionate new-product launches in the consumer supplement and functional-food channels, where "plant-derived" and "whole-food sourced" claims drive purchase decisions among health-conscious demographics [15].

By Product Type

Segment Key Metric Primary Demand Driver
Single Vitamin Ingredients 72.0% share (2024) Pharmaceutical and fortification procurement
Vitamin Premixes and Blends CAGR 8.50% (2026–2035) Functional food formulation complexity


Single vitamin ingredients dominate the market with a 72.0% share (2024), driven by bulk pharmaceutical and food fortification procurement. Meanwhile, vitamin premixes and blends are the fastest-growing segment, projected at an 8.50% CAGR (2026–2035) as manufacturers increasingly rely on pre-blended solutions to manage the complexity of functional food formulations.

By Form

Segment Key Metric Primary Demand Driver
Powders 76.5% share (2024) Industrial and B2B fortification applications
Liquids CAGR 11.75% (2026–2035) Consumer preference for rapid-absorption formats
Others (Capsules, Tablets) USD 0.38 Billion (2025) Retail supplement convenience


Powders hold the vast majority of the market with a 76.5% share (2024), driven by widespread use in industrial and B2B food fortification. Liquids represent the fastest-growing segment, projected at an 11.75% CAGR (2026–2035) due to rising consumer demand for rapid-absorption formats. Meanwhile, traditional delivery forms like capsules and tablets reached a value of USD 0.38 Billion in 2025, sustained by steady demand for convenient retail supplements.

By Application

Segment Key Metric Primary Demand Driver
Dietary Supplements 50.2% share (2024) Global supplement retail expansion
Food and Beverages USD 1.68 Billion (2025) Mandatory and voluntary fortification
Cosmetics and Personal Care CAGR 10.05% (2026–2035) Nutricosmetics and beauty-from-within
Animal Feed 9.3% share (2024) Livestock health optimization


Dietary supplements represent the single largest application within the Vitamins Market, driven by a global consumer base that increasingly views daily supplementation as a proactive health investment rather than a reactive medical intervention. The cosmetics and personal care segment is the fastest-growing application, as ingestible beauty products containing biotin, Vitamin C, and Vitamin E expand across Asian and European markets.


Regional Market Share Analysis

Region Key Metric Primary Investment Themes
Asia-Pacific 40.3% share (2025) Bulk production dominance, FSSAI fortification mandates
North America 26.5% share (2025) DTC supplement growth, personalized nutrition
Europe 22.0% share (2025) EFSA health-claim premiumization, clean-label demand
South America 6.4% share (2025) Government school-feeding programs, flour fortification
Middle East & Africa 8.70% CAGR (2026–2035) National nutrition strategies, rising disposable income
Total USD 5.54 Billion (2025)

The Vitamins Market exhibits distinct regional dynamics shaped by regulatory frameworks, dietary patterns, and manufacturing infrastructure. Asia-Pacific retains its leadership position through sheer production scale, while faster-growing regions like the Middle East & Africa are building demand from an emerging consumer base.


North America

Country Key Metric Key Driver
US 78.4% of regional share FDA dietary supplement regulatory modernization
Canada 13.8% of regional share Health Canada Natural Health Product reforms
Mexico CAGR 4.10% COFEPRIS fortification mandates


The United States drives the North American Vitamins Market through a mature retail supplement infrastructure where Amazon, Costco, and specialty e-tailers collectively control over 55% of online vitamin sales. Canada's 2024 Natural Health Product regulatory overhaul is broadening the range of permissible vitamin health claims, stimulating new product launches [15].

Europe

Country Key Metric Key Driver
Germany 24.6% of regional share Pharmaceutical-grade supplement culture
UK 19.3% of regional share Post-Brexit independent regulatory framework
France CAGR 3.25% Nutricosmetics innovation hub
Italy 11.4% of regional share Pharmacy-channel supplement tradition
Spain 8.7% of regional share Mediterranean diet supplement integration
Nordic Countries CAGR 3.55% Vitamin D supplementation policy mandates
Russia 6.2% of regional share Import substitution programs
Rest of Europe 9.8% of regional share EU harmonized fortification regulation


Europe's Vitamins Market is characterized by strict evidence-based claim requirements under EFSA Regulation (EC) No. 1924/2006, which creates a high barrier to entry but rewards companies with clinically substantiated formulations through premium pricing power [7].

Asia-Pacific

Country Key Metric Key Driver
China 48.2% of regional share Vertically integrated bulk vitamin manufacturing
India CAGR 6.80% FSSAI mandatory rice and oil fortification
Japan 14.7% of regional share Aging population and functional food culture
South Korea 9.1% of regional share Beauty-supplement crossover demand
ASEAN CAGR 5.90% Rising middle-class discretionary spending
Rest of Asia-Pacific 5.6% of regional share Emerging pharmaceutical markets


China's dominance in the Asia-Pacific Vitamins Market extends beyond domestic consumption—the country exports roughly 60% of global vitamin C and 70% of global vitamin E raw materials, making it the supply-chain linchpin for producers worldwide [5][13].

South America

Country Key Metric Key Driver
Brazil 62.5% of regional share Mandatory wheat and corn flour fortification
Argentina CAGR 3.85% Growing pharmacy-channel supplement sales
Rest of South America 16.8% of regional share Government nutrition programs


Brazil's ANVISA regulations require iron and folic acid fortification in all wheat and corn flour, creating consistent institutional demand. Argentina's deregulation of supplement retail channels in 2023 opened pharmacy and supermarket distribution, expanding the Vitamins Market addressable consumer base by an estimated 12 million households [10].

Middle East & Africa

Country Key Metric Key Driver
Saudi Arabia 28.4% of regional share Vision 2030 health and wellness pillar
UAE CAGR 9.45% Premium supplement import demand
South Africa 22.1% of regional share Government vitamin A supplementation program
Egypt CAGR 8.30% Population-scale flour fortification initiative
Rest of MEA 19.5% of regional share NGO-funded micronutrient programs


The Middle East & Africa represents the fastest-growing corridor for the Vitamins Market. Saudi Arabia's Vision 2030 explicitly targets reducing micronutrient deficiency rates by 40% through mandatory fortification and public supplementation campaigns, while Egypt's national flour fortification program—supported by the World Food Programme—reaches over 65 million consumers annually [6].


Vitamins Market By Region, 2025-2035

Competitive Benchmarking

The Vitamins Market exhibits medium concentration, with the top five players capturing an estimated 45–55% of global revenue. The Herfindahl-Hirschman Index (HHI) sits in the 1,200–1,600 range, indicating a moderately competitive structure where scale advantages in fermentation and chemical synthesis coexist with niche specialty producers serving clean-label and organic segments.

Company Est. Revenue Share Range Key Offerings for Vitamins Market Strategic Positioning
DSM-Firmenich ~12–16% Vitamins A, C, D, E, B-series; Quali® branded ingredients Vertically integrated fermentation leader
BASF SE ~10–14% Vitamins A, E, B2, carotenoids; Newtrition® platform Chemical synthesis scale; sustainability pivot
Lonza Group ~5–8% Capsugel delivery systems; custom vitamin blends Encapsulation and bioavailability specialist
ADM (Archer Daniels Midland) ~4–7% Natural-source vitamin E; premix solutions Agricultural integration; natural positioning
Adisseo (Bluestar) ~4–6% Feed-grade vitamins A, E; NutriOpt services Animal nutrition focus; cost leadership
CSPC Pharmaceutical Group ~3–5% Vitamin C (bulk); vitamin B series Chinese manufacturing scale
Northeast Pharmaceutical Group ~3–5% Vitamin C, B1, B6 bulk APIs High-volume commodity positioning
Zhejiang Medicine Co. ~3–5% Vitamin A, E, D3; Xinchang production base Export-oriented bulk production
Jubilant Life Sciences ~2–4% Vitamin B3 (niacinamide); pyridoxine Indian cost-competitive specialty producer
SinoVitamins (Shandong Luwei) ~2–3% Vitamin B5, B3; feed-grade premixes Emerging Chinese challenger


Recent News & Developments

  • DSM-Firmenich (October 2024): Completed commissioning of a EUR 150 million precision-fermentation vitamin facility in Dalry, Scotland, targeting Vitamin B12 and beta-carotene production with 35% lower carbon intensity than synthetic routes [4].
  • BASF SE (July 2024): Announced a strategic partnership with Evonik to co-develop next-generation Vitamin A production processes using bio-catalytic synthesis, aiming for commercial scale by 2027 [3].
  • Zhejiang Medicine (September 2023): Invested CNY 800 million in a new Vitamin E production line at its Xinchang facility, expanding annual capacity by 15,000 metric tons [13].
  • ADM (November 2023): Launched a natural-source Vitamin E line derived from non-GMO soybean distillate, targeting the North American clean-label supplement channel [15].


Vitamins Market Report Scope

Parameter Detail
Market Scope Global Vitamins Market (ingredients level)
Study Period 2021–2035
CAGR (Forecast Period) 3.40% (2026–2035)
Market Size — 2025 (Base Year) USD 5.54 Billion
Market Size — 2035 (Forecast End) USD 7.74 Billion
Fastest Growing Segment Vitamin D (by type); Natural (by source); MEA (by region)
Companies Profiled 10
Valuation Currency USD Billion


FAQs

How do bioavailability differences between synthetic and natural vitamins affect procurement decisions?
Synthetic vitamins typically deliver 85–95% bioavailability, comparable to natural forms for most B and C vitamins. Procurement teams should prioritize bioavailability data sheets from suppliers and match source type to the target consumer demographic's willingness to pay clean-label premiums [15].
What intellectual-property strategies are leading vitamin producers using to protect fermentation processes?
Major producers file process patents on engineered microbial strains and fermentation conditions rather than on the vitamin molecules themselves. DSM-Firmenich and BASF collectively hold over 200 active fermentation-related patents, creating meaningful barriers for new entrants [4].
How should buyers evaluate counterfeiting risk when sourcing vitamins from emerging-market suppliers?
Request third-party certificates of analysis from ISO 17025–accredited laboratories and verify lot traceability through blockchain or serialization systems. Suppliers unable to provide chain-of-custody documentation should be flagged for additional due diligence [14].
What role do contract development and manufacturing organizations (CDMOs) play in the Vitamins Market?
CDMOs handle roughly 30% of global vitamin premix and finished-supplement production, offering speed-to-market for brands without in-house manufacturing. Lonza, Catalent, and Aenova dominate this space with GMP-certified multi-format capabilities [17].
How are evolving Codex Alimentarius standards influencing international vitamin trade flows?
Codex harmonization of maximum vitamin levels in fortified foods reduces non-tariff trade barriers, enabling manufacturers to serve multiple regions from a single production run. Updated 2023 guidelines streamlined cross-border vitamin ingredient approvals [19].
What insurance and liability considerations apply to vitamin ingredient suppliers?
Suppliers typically carry product-liability coverage of USD 5–10 million per occurrence. Buyers should verify that supplier policies include recall-cost coverage, as a single adulteration event can trigger multi-million-dollar recall expenses across the supply chain [14].
How will carbon-border adjustment mechanisms affect vitamin ingredient pricing in Europe?
The EU's CBAM, effective 2026, will add cost to carbon-intensive vitamin imports from China. European buyers should model a 3–6% price increase on synthetic vitamin imports and evaluate fermentation-derived alternatives for cost mitigation [16][18].    
Author
Author
Author Profile
Pradeep Nandi LinkedIn
Senior Research Analyst
I have a bachelor's degree in mechanical engineering and an MBA. I have more than two years of expertise in the retail, food, and beverage, chemical, and material industries, and hence have developed a sound cross-domain expertise. A firm believer in lifelong learning and sharing of knowledge. Having a proclivity for hatching ideas and trying to absorb as much information as possible in a short amount of time. Introducing corporates to the data and insight, which enables them to move from probability to possibility, has been my key areas of interest. 

Research Approach


Secondary Research

The secondary research process involved comprehensive analysis of regulatory databases, peer-reviewed nutritional science journals, clinical publications, and authoritative health organizations. Key sources included the US Food & Drug Administration (FDA), European Food Safety Authority (EFSA), European Medicines Agency (EMA), National Institutes of Health (NIH) Office of Dietary Supplements, World Health Organization (WHO) Global Health Observatory, Food and Agriculture Organization (FAO) Statistical Database, Centers for Disease Control and Prevention (CDC) National Center for Health Statistics, Health Canada Natural and Non-prescription Health Products Directorate, Therapeutic Goods Administration (TGA) Australia, Food Safety and Standards Authority of India (FSSAI), and China National Medical Products Administration (NMPA).

Regulatory framework updates, clinical efficacy studies, deficiency prevalence data, fortification policies, and consumption statistics for Vitamin A, Vitamin B-complex, Vitamin C, Vitamin D, Vitamin E, Vitamin K, and multivitamin formulations were gathered using these sources.

Additional authoritative sources included the Council for Responsible Nutrition (CRN), International Alliance of Dietary Supplement Associations (IADSA), European Federation of Associations of Health Product Manufacturers (EHPM), Natural Products Association (NPA), United States Department of Agriculture (USDA) FoodData Central, World Bank Health Indicators, and national nutrition surveys from key markets including NHANES (US), NDNS (UK), and CNNS (China). Trade databases such as UN Comtrade and national customs authorities provided import/export flows of vitamin raw materials and finished formulations.


Primary Research

Qualitative and quantitative insights were obtained by interviewing supply-side and demand-side stakeholders during the primary research process. The supply-side sources consisted of CEOs, VPs of Manufacturing, regulatory affairs chiefs, R&D directors, and commercial directors from vitamin manufacturers, raw material suppliers, and contract manufacturers. Chief pharmacists, clinical nutritionists, dietitians, procurement leads from pharmaceutical and nutraceutical companies, brand managers from food and beverage fortification divisions, and animal nutrition specialists from feed industry leaders constituted demand-side sources. The market segmentation was validated across human nutrition, pharmaceuticals, animal feed, and personal care applications through primary research. The product pipeline timelines for novel delivery formats (gummies, liposomal, effervescent) were confirmed, and consumer purchasing patterns, pricing strategies, and regulatory compliance dynamics were gathered.

Primary Respondent Breakdown:

• By Designation: C-level Primaries (40%), Director Level (32%), Others (28%)

• By Region: North America (32%), Europe (30%), Asia-Pacific (28%), Rest of World (10%)


Market Size Estimation

Revenue mapping and consumption volume analysis were employed to determine the global market valuation in the pharmaceutical, nutraceutical, food fortification, and animal feed sectors. The methodology comprised the following:

• Identification of over 50 key manufacturers in North America, Europe, Asia-Pacific, Latin America, and the Middle East and Africa

• Cross-product mapping: multivitamin complexes, water-soluble vitamins (B-complex, C), and fat-soluble vitamins (A, D, E, K)

• The analysis of pharmaceutical-grade, food-grade, and feed-grade vitamin portfolios on a segment-specific basis

• Examination of the annual revenues that have been reported and modeled for the vitamin ingredient and finished product portfolios

• In 2024, the coverage of manufacturers will account for 72-78% of the global market share.

• Segment-specific valuations for human nutrition, animal nutrition, and cosmetic applications are derived through extrapolation using bottom-up (consumption volume × ASP by application and region) and top-down (manufacturer revenue validation) approaches.

Download Free Sample

Kindly complete the form below to receive a free sample of this Report

Download PDF ×

We do not share your information with anyone. However, we may send you emails based on your report interest from time to time. You may contact us at any time to opt-out.
















