Waste to Energy Market (2026 - 2035)

Waste to Energy Market Size, Share & Growth Analysis Report By Technology (Incineration, Anaerobic Digestion, Gasification, Pyrolysis, Others), By Waste Type (Municipal Solid Waste, Industrial Waste, Agricultural Waste, Others), By Application (Electricity Generation, Heat Generation, Combined Heat & Power, Fuel Production) and By Regional (North America, Europe, South America, Asia Pacific, Middle East and Africa) – Industry Growth & Forecast to 2035
ID: MRFR/EnP/0861-CR
186 Pages
Chitranshi Jaiswal
Last Updated: July 23, 2026
Waste to Energy Market
Market Size
Forecast Period2026-2035
CAGR (2026-2035)6.5%
2025 Market SizeUSD 40.5 Billion
2035 Market SizeUSD 76.0 Billion
Key Players
Veolia Environnement
Covanta
Hitachi Zosen
SUEZ
China Everbright Environment
Keppel Infrastructure
Opportunities
  • Modular and Decentralized Small-Scale Facilities
  • Carbon Capture Integration on WtE Flue Gas
  • Digital Twins and AI-Optimized Combustion

Waste to Energy Market Summary

The global Waste To Energy Market reached an estimated USD 40.5 billion in 2025 and is projected to grow from USD 43.1 billion in 2026 to USD 76.0 billion by 2035, registering a CAGR of 6.5% during the 2026–2035 forecast period. Two forces are pulling capital into the sector simultaneously: the EU's Circular Economy Action Plan, which mandates diversion of residual waste from landfills into energy recovery by 2030 [1], and China's 14th Five-Year Plan commitment of over USD 15 billion in new thermal treatment capacity between 2021 and 2025 [2]. Together, these policy anchors have turned what was once a niche environmental segment into a mainstream infrastructure class.

Technology in the Waste To Energy Market is shifting from conventional grate-fired boilers toward higher-efficiency fluidized-bed and modular configurations that can process heterogeneous feedstocks with lower emission profiles. The European Commission's Industrial Emissions Directive revisions finalized in 2024 imposed tighter NOx and dioxin limits, accelerating retrofits worth an estimated EUR 4.2 billion across existing plants in Germany, France, and the Netherlands [3]. Meanwhile, biological treatment pathways are capturing share in Southeast Asia and Sub-Saharan Africa, where lower capital intensity suits emerging-economy budgets.

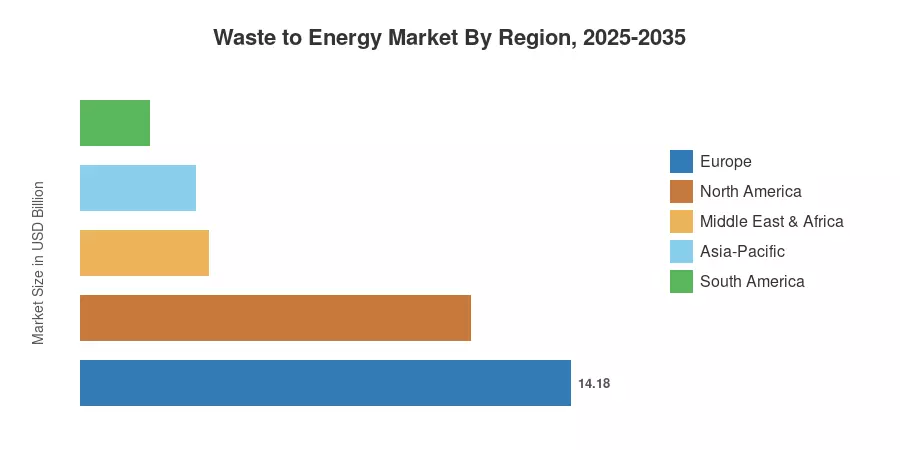
Europe commands approximately 35% of the global Waste To Energy Market, anchored by Scandinavia's near-zero landfill rates and Germany's 90-plus operational facilities. Asia-Pacific is the fastest-growing region at an estimated 8.2% CAGR, driven by rapid urbanization across India, China, and Indonesia. North America holds about 28% share, supported by renewable portfolio standards in over twenty U.S. states that classify waste-derived electricity as eligible generation. The stage is set for a decade in which waste stops being a liability and becomes a feedstock.


Key Report Takeaways

• By Technology

  • Incineration holds the largest technology share in the Waste To Energy Market at roughly 42%, driven by proven scalability and established regulatory frameworks.
  • Gasification technologies are expanding at the fastest CAGR of approximately 8.9% through 2035 as municipalities seek lower-emission thermal alternatives.
  • Anaerobic digestion accounts for around USD 10.1 billion in 2025 value, favored in agricultural economies for dual biogas-and-digestate revenue streams.

• By Waste Type

  • Municipal solid waste represents the dominant feedstock category in the Waste To Energy Market with a 48% share, reflecting the sheer volume of urban refuse generated globally.
  • Industrial waste streams are projected to grow at a CAGR near 7.3%, fueled by extended producer responsibility legislation in the EU and Japan.

• By Region

  • Europe's dominance in the Waste To Energy Market rests on strict landfill diversion mandates and over 500 operational facilities across the continent.
  • Asia-Pacific is expected to surpass USD 25 billion by 2035, led by Chinese mega-facility construction and India's Swachh Bharat-linked project pipeline.
  • North America's Waste To Energy Market benefits from bipartisan infrastructure spending that allocated USD 3.5 billion to solid waste management modernization under the 2021 IIJA.


Market Size and Forecast (2021–2035)

Market Research Future's sizing methodology combines bottom-up plant-capacity analysis across 78 countries with top-down cross-referencing against IEA and World Bank municipal waste generation datasets. Historical values (2021–2024) reflect audited project commissioning records and publicly filed capacity additions, while forecast values (2026–2035) embed scenario-adjusted demand curves accounting for policy, urbanization, and technology cost trajectories.
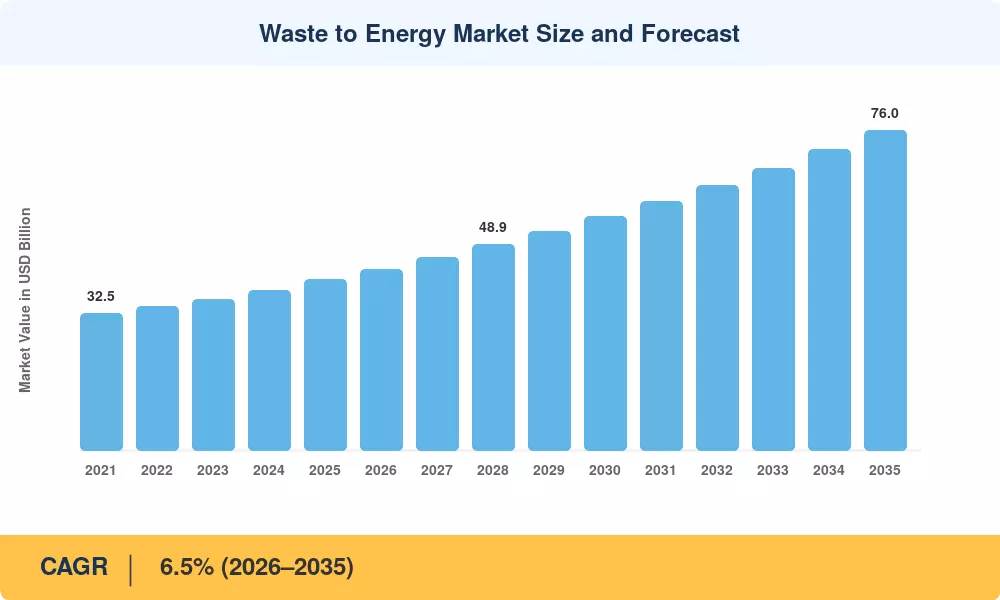
Waste to Energy Market Size and Forecast
Our Impact
Enabled $4.3B Revenue Impact for Fortune 500 and Leading Multinationals
Partnering with 2000+ Global Organizations Each Year
30K+ Citations by Top-Tier Firms in the Industry

Driver Impact Analysis

Driver ~% Impact on CAGR Geographic Relevance Impact Timeline
Landfill diversion mandates +1.4% Europe, Japan, South Korea Short-term (≤2 yr)
Urbanization & rising MSW volumes +1.2% Asia-Pacific, Africa Long-term (≥4 yr)
Carbon pricing & ETS expansion +0.9% EU, UK, Canada Medium-term (2–4 yr)
Renewable energy portfolio standards +0.7% North America, India Medium-term (2–4 yr)
Technology cost reduction in modular systems +0.6% Global Long-term (≥4 yr)
Tipping fee escalation for landfills +0.5% North America, Australia Short-term (≤2 yr)
Green bond & climate finance availability +0.4% Emerging markets Medium-term (2–4 yr)


Landfill Diversion Mandates

The EU Landfill Directive limits the amount of municipal trash disposed of to landfill to 10% by 2035, a target that effectively requires member states to engage in thermal treatment or biological recovery [1]. Germany already dumps less than 1% of its urban garbage, while southern and eastern European countries have a 30-50 percentage point gap to close, which translates to an anticipated EUR 18 billion of new garbage to Energy Market infrastructure needs by 2032 [3]. The 2024 amendment to South Korea’s Waste Management Act also included tougher disposal quotas for the procurement of six new facilities in the Seoul Capital Area alone.


Urbanization and Rising Municipal Waste Volumes

The World Bank projects global municipal solid waste generation will reach 3.4 billion tonnes annually by 2050, up from 2.0 billion tonnes in 2016 [8]. India's urban population alone is expected to add 300 million residents by 2035, and the Swachh Bharat Mission Urban 2.0 has been established with an approved central allocation of USD 19 Billion for total clean sanitation. This surge in waste generation creates a structural demand floor for the Waste To Energy Market that persists regardless of commodity-price cycles.

Carbon Pricing and ETS Expansion

Carbon prices in the EU ETS have stabilized above EUR 60 per tonne by 2025, rendering landfill methane emissions economically punishing compared to thermal treatment with energy recovery [9]. The UK’s Carbon Border Adjustment Mechanism is to come into force in 2027 and will bring similar pricing pressure on imported items with embedded waste-disposal carbon footprints. The federal path for carbon prices in Canada to reach CAD 170 per tonne by 2030 has already impacted provincial procurement for waste management, with Ontario and British Columbia shifting to energy recovery options [14].


Renewable Portfolio Standards

Over 30 U.S. states classify electricity generated from the biogenic fraction of municipal waste as renewable or eligible under clean energy standards [10]. This classification unlocks renewable energy certificates worth USD 15–45 per MWh, materially improving project economics. In India, the Ministry of New and Renewable Energy included waste-to-energy under its RPO framework in 2023, obligating distribution companies to procure a minimum share of power from WtE facilities across seven major states [6].


Restraints Impact Analysis

The restraint impacts below represent the estimated drag on the overall Waste To Energy Market CAGR. Each value reflects the magnitude of growth that would be realized if the restraint were fully removed, not a direct subtraction from headline growth.

Restraint ~% Impact on CAGR Geographic Relevance Impact Timeline
High upfront capital intensity −0.8% Emerging markets Long-term (≥4 yr)
Public opposition & permitting delays −0.6% North America, Europe Medium-term (2–4 yr)
Competition from recycling mandates −0.5% EU, Japan Short-term (≤2 yr)
Emission compliance costs −0.4% Global Medium-term (2–4 yr)
Feedstock variability & contamination −0.3% Asia-Pacific, Africa Long-term (≥4 yr)


High Upfront Capital Intensity

A modern mass-burn incineration plant with a capacity of 1,000 tonnes/day usually costs USD 350-500 million to build and takes four to six years to complete [11]. The pricing barrier is especially severe in Sub-Saharan Africa and South Asia, where municipal budgets are tight and sovereign credit ratings limit access to project-finance lending on competitive terms. Despite international development bank guarantees, the Waste To Energy Market has a structural finance deficit estimated at USD 12 billion among the 30 lowest-income urbanizing nations [13].


Public Opposition and Permitting Delays

Community resistance to new thermal treatment facilities has stalled or cancelled projects in Baltimore, Delhi, and several Italian provinces over the past three years [15]. Health-impact concerns—particularly around fine particulate and dioxin emissions near residential areas—trigger extended environmental impact assessment cycles that can add 18–36 months to project development timelines. In the United States, the EPA's updated risk assessment guidelines issued in 2024 introduced additional air-dispersion modeling requirements.

Competition from Recycling Mandates

The EU's Circular Economy Action Plan prioritizes waste prevention, reuse, and material recycling above energy recovery in the waste hierarchy [1]. As recycling targets climb toward 65% of municipal waste by 2035, the volume of residual feedstock available for thermal treatment narrows.


Waste to Energy Market Opportunities

Modular and Decentralized Small-Scale Facilities

Pre-fabricated, containerized treatment units that handle 50 to 200 tonnes per day are opening up the Waste To Energy Market to secondary communities and island nations that don’t have the levels of waste to justify massive centralized plants. Some companies, such as SUEZ and CNIM, have experimented with modular solutions in Pacific Island states and Caribbean nations, where off-island disposal is prohibitively expensive due to shipping difficulties [11]. Capital requirements drop to USD 25–60 million per unit, opening up a new addressable area of an estimated USD 4 billion by 2030.


Carbon Capture Integration on WtE Flue Gas

Bioenergy with carbon capture and storage (BECCS) applied to waste-to-energy flue gas offers one of the few commercially deployable negative-emission pathways. Construction of Norway's Klemetsrud facility in Oslo is rescheduled to start in 2026, targeting operations by Q3 2029 to capture 350,000 tonnes of CO₂ annually. With the EU Innovation Fund providing up to EUR 40 per tonne in CCS incentives, this integration could add a premium revenue stream worth USD 3.2 billion across European Waste To Energy Market operators by 2032.

Digital Twins and AI-Optimized Combustion

Hitachi Zosen-operated facilities in Japan [19] are pilot deployments of real-time combustion optimization utilizing machine-learning models, which have resulted in 3–5% improvement in thermal efficiency and up to 20% reduction in unplanned downtime. Digital performance tools are emerging as a competitive differentiator in the Waste To Energy Market, as pollution limitations tighten and operating margins shrink.


Emerging-Market Municipal PPP Frameworks

India's NITI Aayog has developed a standardized public-private partnership concession model for waste-to-energy projects, reducing bid preparation timelines from 18 months to 6 months [6]. These structured procurement pathways reduce political risk and unlock multilateral finance.

Waste-Derived Hydrogen and Synthetic Fuels

Thermochemical conversion of residual waste into hydrogen and synthetic fuels represents a nascent but high-potential revenue diversification path. The UK's Department for Energy Security funded three pilot projects in 2024 to produce hydrogen from non-recyclable plastics, with combined output targets of 5,000 tonnes H₂ per year [20]. If production costs reach parity with grey hydrogen by 2030, this pathway could expand the addressable Waste To Energy Market by an additional USD 6 billion globally.


Waste to Energy Market Future Outlook

Decarbonization and Negative-Emission Integration

The next decade will see the Waste To Energy Market increasingly intersect with carbon capture deployment. The IEA's Net Zero by 2050 scenario identifies BECCS on biogenic waste streams as delivering 1.3 Gt of negative emissions annually by 2050 [23]. Early-mover facilities in Northern Europe are already securing carbon-removal credits valued at EUR 100–150 per tonne on voluntary markets, creating a new revenue pillar that could improve project-level IRRs by 2–4 percentage points.

AI-Driven Operational Excellence

Artificial intelligence is transitioning from a pilot curiosity to an operational necessity across the Waste to Energy Market. Predictive maintenance algorithms trained on vibration, temperature, and flue-gas chemistry data are reducing unplanned outages by 15–22% at facilities operated by Veolia and Hitachi Zosen [19]. By 2030, autonomous combustion control systems are expected to become standard in new builds, narrowing the performance gap between best-in-class and average operators.

Circular Economy Convergence

As recycling rates plateau in mature economies around 50–55%, the residual waste fraction becomes more heterogeneous and harder to treat. This convergence is reshaping the Waste To Energy Market toward flexible multi-fuel platforms capable of handling post-recycling residues, commercial and industrial rejects, and construction-demolition waste in a single facility. The EU's draft Waste Framework Directive revision expected in 2027 will likely codify minimum energy-efficiency thresholds that favor combined heat-and-power configurations over electricity-only plants [1].

Climate Finance and Blended Capital Structures

Multilateral climate finance—through mechanisms such as the Green Climate Fund, Asian Infrastructure Investment Bank, and EU Innovation Fund—is channeling over USD 2 billion annually into waste-management infrastructure in lower-middle-income countries [13]. Blended finance structures that pair concessional debt with commercial equity are reducing the weighted average cost of capital for Waste To Energy Market projects in India, Indonesia, and East Africa from 12–14% to 8–9%, meaningfully improving bankability.


Waste to Energy Market Segmentation

By Technology

Segment Metric Primary Demand Driver
Incineration (Mass Burn) ~42% share Proven scalability, regulatory track record
Anaerobic Digestion USD 10.1 B (2025) Dual biogas-and-digestate revenue
Gasification 8.9% CAGR Lower emissions, syngas flexibility
Pyrolysis USD 3.2 B (2025) Plastic-rich feedstock valorization
Others (Plasma Arc, RDF) ~7% share Niche hazardous waste applications


Incineration remains the backbone of the Waste To Energy Market, processing the vast majority of thermally treated municipal waste globally. Mass-burn and fluidized-bed designs have accumulated decades of operational data, giving financiers and municipal clients confidence in performance guarantees. European operators like Fortum and AVR run plants at availability rates exceeding 92%, setting a benchmark that newer entrants must match to compete for long-term concessions [5].

Gasification is emerging as the fastest-growing technology in the Waste To Energy Market, particularly for applications requiring clean syngas output. Japanese firms, including JFE Engineering and Hitachi Zosen, have deployed direct-melting gasification systems that vitrify ash residues in a single step, eliminating the need for separate ash-treatment facilities [19]. This capital-efficiency advantage is driving adoption across space-constrained Asian metropolitan areas where land for ash landfills is scarce.

By Waste Type

Segment Metric Primary Demand Driver
Municipal Solid Waste ~48% share Urbanization volume growth
Industrial Waste 7.3% CAGR Extended producer responsibility legislation
Agricultural Waste USD 6.1 B (2025) Biogas subsidies in the EU and India
Others ~10% share Medical, hazardous, C&D waste


Municipal solid waste is the primary feedstock powering the Waste To Energy Market. Cities in China, India, and Southeast Asia generate over 700 million tonnes of MSW annually, and diversion rates from landfill remain below 30% in most emerging economies [8]. The sheer volume guarantees long-term feedstock availability, though calorific values vary significantly—from 6–8 MJ/kg in tropical Asian cities to 10–12 MJ/kg in northern European municipalities—requiring plant designs tailored to local waste composition.

By Application

Segment Metric Primary Demand Driver
Electricity Generation ~55% share Grid offtake agreements and RPS
Heat Generation 6.2% CAGR District heating demand in the Nordics
Combined Heat & Power USD 6.1 B (2025) EU BAT efficiency requirements
Fuel Production ~5% share Emerging hydrogen and synfuel pathways


Electricity generation dominates the application landscape of the Waste To Energy Market, supported by standardized power purchase agreement structures and grid-interconnection protocols across most jurisdictions. Combined heat and power configurations deliver system efficiencies above 80%, compared with 25–30% for electricity-only plants, and are now being incentivized through the EU's revised Energy Efficiency Directive, which requires new WtE facilities to demonstrate R1 energy recovery status to qualify for residual-waste treatment permits [3].


Regional Market Share Analysis

Region Metric Primary Investment Themes
Europe ~35% share Retrofit, CCS integration, emission compliance
North America USD 11.3 B RPS eligibility, tipping-fee economics
Asia-Pacific 8.2% CAGR Urbanization, PPP concessions, greenfield builds
South America USD 2.0 B Landfill remediation, São Paulo mega-projects
Middle East & Africa 9.1% CAGR Sovereign diversification, waste import bans
Total USD 40.5 B  

The Waste To Energy Market exhibits pronounced regional asymmetry. Mature European economies operate near theoretical landfill-diversion limits, while the Asia-Pacific is building capacity at an unprecedented pace. Below is the regional breakdown for 2025.


Europe

Country Metric Key Driver
Germany ~24% of regional share 90+ operational facilities, the highest per-capita treatment
France USD 2.1 B ADEME-funded capacity expansion program
Sweden 7.8% CAGR Waste import model and district heating integration
Netherlands USD 1.4 B Circular economy industrial symbiosis clusters
Rest of Europe ~31% of regional share Eastern EU accession-driven infrastructure catch-up


Europe's Waste To Energy Market leadership stems from decades of landfill taxation, with Sweden and Denmark effectively eliminating landfilling of combustible waste. Germany alone processes over 26 million tonnes annually through thermal treatment, generating roughly 5% of the nation's district heating supply [5]. The European Commission's 2024 revision of Best Available Techniques (BAT) reference documents set new emission floors that are pushing older plants toward USD 8–12 million retrofits, sustaining capex cycles even in otherwise saturated markets.

North America

Country Metric Key Driver
United States ~82% of regional share 75 operational facilities, RPS-driven revenue
Canada 6.8% CAGR British Columbia and Ontario procurement programs
Mexico USD 0.4 B SEMARNAT clean energy integration targets


The United States hosts the largest installed base in the North American Waste To Energy Market, with facilities concentrated in the Northeast corridor, where landfill space is constrained, and tipping fees exceed USD 80 per tonne. The 2021 Infrastructure Investment and Jobs Act allocated USD 3.5 billion broadly to solid waste management, a portion of which has been directed to WtE feasibility studies in Florida, Texas, and California [10]. Canada's evolving carbon-pricing framework is shifting provincial waste strategies toward energy recovery, particularly in densely populated corridors around Toronto and Vancouver.

Asia-Pacific

Country Metric Key Driver
China USD 8.4 B 14th Five-Year Plan mega-facility program
India 10.5% CAGR Swachh Bharat Mission Phase III
Japan ~18% of regional share Advanced thermal treatment and ash vitrification
South Korea 7.4% CAGR Metropolitan waste reduction policy
Rest of Asia-Pacific USD 1.8 B ASEAN PPP project pipeline


Asia-Pacific is the undisputed growth engine of the Waste To Energy Market. China commissioned more thermal treatment capacity between 2020 and 2024 than the rest of the world combined, adding over 200,000 tonnes per day of processing capacity [2]. India's pipeline of 55 operational and under-construction WtE plants is projected to triple by 2030 under the Swachh Bharat urban mission, with tariff support of INR 7.0–7.5 per kWh secured through power purchase agreements with state distribution companies [6].

South America

Country Metric Key Driver
Brazil ~62% of regional share São Paulo Bandeirantes and Caieiras expansions
Argentina 8.3% CAGR Buenos Aires landfill closure mandates
Rest of South America USD 0.5 B IDB-funded feasibility studies


Brazil dominates the South American Waste To Energy Market, with the Waste To Energy Market in São Paulo state alone representing four of the region's largest operational facilities. The National Solid Waste Policy (PNRS) set 2024 deadlines for open-dump closure across all municipalities, creating urgent demand for alternative treatment infrastructure [21]. Argentina's CEAMSE agency is actively procuring its first large-scale thermal treatment facility for the greater Buenos Aires metropolitan area under a 25-year concession model.

Middle East & Africa

Country Metric Key Driver
UAE USD 0.9 B Sharjah and Dubai mega-projects
Saudi Arabia 10.2% CAGR Vision 2030 waste diversion targets
South Africa ~18% of regional share Johannesburg and Cape Town pilot programs
Rest of MEA 8.7% CAGR African Development Bank project financing


The Middle East & Africa Waste To Energy Market is nascent but accelerating. The UAE's Sharjah facility—one of the region's first large-scale WtE plants—processes 300,000 tonnes per year and began commercial operations in 2024 [22]. Saudi Arabia's National Waste Management Center has tendered three facilities under Vision 2030, targeting 3 million tonnes of annual treatment capacity by 2030 and signaling a structural shift away from landfill dependence in the Gulf Cooperation Council.


Waste to Energy Market By Region, 2025-2035

Competitive Benchmarking

The global Waste To Energy Market is moderately concentrated, with an estimated Herfindahl-Hirschman Index below 1,200 and the top five players collectively commanding approximately 30–35% of revenue. The landscape blends multinational environmental services conglomerates with specialized EPC contractors and regional municipal utilities, creating layered competition across project development, equipment supply, and facility operations.

Company Est. Revenue Share Range Key Offerings Strategic Positioning
Veolia Environnement ~7–10% Full-service O&M, thermal and biological treatment Vertically integrated global operator
Covanta (now Reworld) ~5–8% Mass-burn incineration, metals recovery Dominant U.S. operator, CCS pilot
Hitachi Zosen (Inova) ~4–7% Grate and gasification systems, EPC Technology licensor, strong in Asia
SUEZ (post-Veolia) ~3–6% Modular WtE, anaerobic digestion European and MENA presence
China Everbright Environment ~4–6% Large-scale incineration, BOT concessions Largest Chinese WtE operator
Keppel Infrastructure ~2–4% Integrated waste management, Singapore hub Southeast Asian regional leader
Babcock & Wilcox ~2–4% Boiler technology, renewable segment Legacy combustion expertise
JFE Engineering ~2–3% Direct-melting gasification Japanese municipal contract-based
Martin GmbH ~2–3% Grate systems, reverse-acting technology European equipment OEM
CNIM Group ~1–3% Turnkey EPC, modular designs French engineering specialist


Recent News & Developments

  • India Ministry of Environment (August 2024): Issued revised emission standards for WtE facilities under the Environment Protection Act, aligning Indian limits with EU BAT-AEL thresholds for particulates, SOx, and NOx [6].
  • European Commission (February 2024): Published updated BAT Reference Document (BREF) for waste incineration, setting stricter continuous emission monitoring requirements effective January 2026 [3].
  • China Everbright Environment (November 2023): Completed acquisition of three operating WtE plants in Vietnam with a combined capacity of 4,500 tonnes per day, expanding its Southeast Asian footprint [2].
  • Babcock & Wilcox (June 2023): Signed a technology licensing agreement with a Saudi Arabian consortium for two 3,000-tonne-per-day facilities under the National Waste Management Center's development program [22].


Waste to Energy Market Report Scope

Parameter Details
Market Scope Global Waste To Energy Market covering thermal treatment, biological treatment, and fuel-production technologies
Study Period 2021–2035
CAGR 6.5% (2026–2035)
Market Size — Base Year (2025) USD 40.5 Billion
Market Size — Forecast End (2035) USD 76.0 Billion
Fastest Growing Segment (Technology) Gasification (8.9% CAGR)
Fastest Growing Region Asia-Pacific (8.2% CAGR)
Companies Profiled 10 major players
Valuation Currency USD (constant 2025 dollars)


FAQs

How do WtE facilities manage bottom-ash residues to meet environmental standards?
Bottom ash undergoes ferrous and non-ferrous metal extraction before being processed into secondary aggregate for road construction. European facilities recover over 90% of metals and divert 80% of treated ash from landfill [16].
What contractual structures are most common for WtE project financing?
Build-Operate-Transfer concessions with 20–30 year terms dominate, pairing municipal tipping-fee guarantees with power purchase agreements. This dual-revenue structure reduces lender risk and supports investment-grade credit ratings [13].
How does feedstock calorific variability affect Waste To Energy Market plant economics?
Lower calorific waste reduces electricity output per tonne, compressing revenue margins. Modern facilities address this through blending strategies and auxiliary fuel co-firing to maintain minimum boiler temperatures [4].
What distinguishes European WtE emission standards from those in Asia?
EU BAT-AEL limits require continuous monitoring of 15+ pollutant parameters, while many Asian jurisdictions still rely on periodic stack testing. India's 2024 standards revision narrowed this gap significantly [3].
Can existing WtE plants be retrofitted with carbon capture technology?
Retrofits are technically viable using amine-based post-combustion capture on existing flue-gas streams. Oslo's Klemetsrud project demonstrated retrofit feasibility at costs of EUR 80–120 per tonne of CO₂ captured [18].
How do Waste To Energy Market operators mitigate waste supply risk in long-term concessions?
Contracts typically include minimum-tonnage guarantees from municipal authorities, with penalty clauses for shortfalls. Some operators diversify by accepting commercial and industrial waste streams [12].
What role does the Waste To Energy Market play in meeting Sustainable Development Goals?
WtE directly supports SDG 7 (affordable energy), SDG 11 (sustainable cities), and SDG 12 (responsible consumption).    
Author
Author
Author Profile
Chitranshi Jaiswal LinkedIn
Team Lead - Research
Chitranshi is a Team Leader in the Chemicals & Materials (CnM) and Energy & Power (EnP) domains, with 6+ years of experience in market research. She leads and mentors teams to deliver cross-domain projects that equip clients with actionable insights and growth strategies. She is skilled in market estimation, forecasting, competitive benchmarking, and both primary & secondary research, enabling her to turn complex data into decision-ready insights. An engineer and MBA professional, she combines technical expertise with strategic acumen to solve dynamic market challenges. Chitranshi has successfully managed projects that support market entry, investment planning, and competitive positioning, while building strong client relationships. Certified in Advanced Excel & Power BI she leverages data-driven approaches to ensure accuracy, clarity, and impactful outcomes.

Research Approach


Secondary Research

The secondary research process involved comprehensive analysis of environmental regulatory databases, energy sector publications, waste management statistics, and authoritative industry bodies. Key sources included the US Environmental Protection Agency (EPA), European Environment Agency (EEA), International Energy Agency (IEA), International Renewable Energy Agency (IRENA), Confederation of European Waste-to-Energy Plants (CEWEP), Energy Recovery Council (ERC), Solid Waste Association of North America (SWANA), World Energy Council, UN Environment Programme, OECD Environmental Statistics, Eurostat Waste Database, National Renewable Energy Laboratory (NREL), China Ministry of Ecology and Environment, Japan Ministry of Environment, and national environmental protection agencies from key markets. These sources were used to collect municipal solid waste generation statistics, installed plant capacity data, emissions regulatory frameworks, technology adoption trends, tariff structures, and competitive landscape analysis for thermal-based (incineration, gasification, pyrolysis) and biological-based (anaerobic digestion, fermentation) waste-to-energy technologies.


Primary Research

To gather both qualitative and quantitative insights, supply-side and demand-side stakeholders were interviewed during the primary research phase. CEOs, VPs of technology, directors of plant operations, and heads of business development from WtE plant operators, technology licensors, EPC contractors, and manufacturers of combustion and boiler equipment were examples of supply-side sources. Demand-side sources included sustainability executives from landfill operators and industrial waste generators, public works department representatives, utility procurement managers, and directors of municipal solid waste management authorities. In addition to verifying project pipeline timings and validating market segmentation, primary research also provided insights into the factors that influence technology uptake, tipping fee dynamics, power purchase agreement structures, and the expenses associated with regulatory compliance.

Primary Respondent Breakdown:

By Designation: C-level Primaries (40%), Director Level (25%), Others (35%)

By Region: North America (30%), Europe (32%), Asia-Pacific (25%), Rest of World (13%)


Market Size Estimation

Global market valuation was derived through installed capacity analysis and revenue mapping across the value chain. The methodology included:

Identification of 50+ key plant operators and technology providers across North America, Europe, Asia-Pacific, and Latin America

Technology mapping across incineration, gasification, pyrolysis, anaerobic digestion, and other thermal/biological treatment categories

Analysis of reported and modeled annual revenues specific to WtE operations, equipment supply, and maintenance services

Coverage of operators and technology providers representing 75-80% of global installed capacity in 2024

Extrapolation using bottom-up (waste throughput volume × tipping fees + energy sales by country) and top-down (operator revenue validation) approaches to derive segment-specific valuations for thermal and biological WtE technologies

Download Free Sample

Kindly complete the form below to receive a free sample of this Report

Download PDF ×

We do not share your information with anyone. However, we may send you emails based on your report interest from time to time. You may contact us at any time to opt-out.

















